fig4

A target extraction method for 3D pig point clouds from a top-down perspective

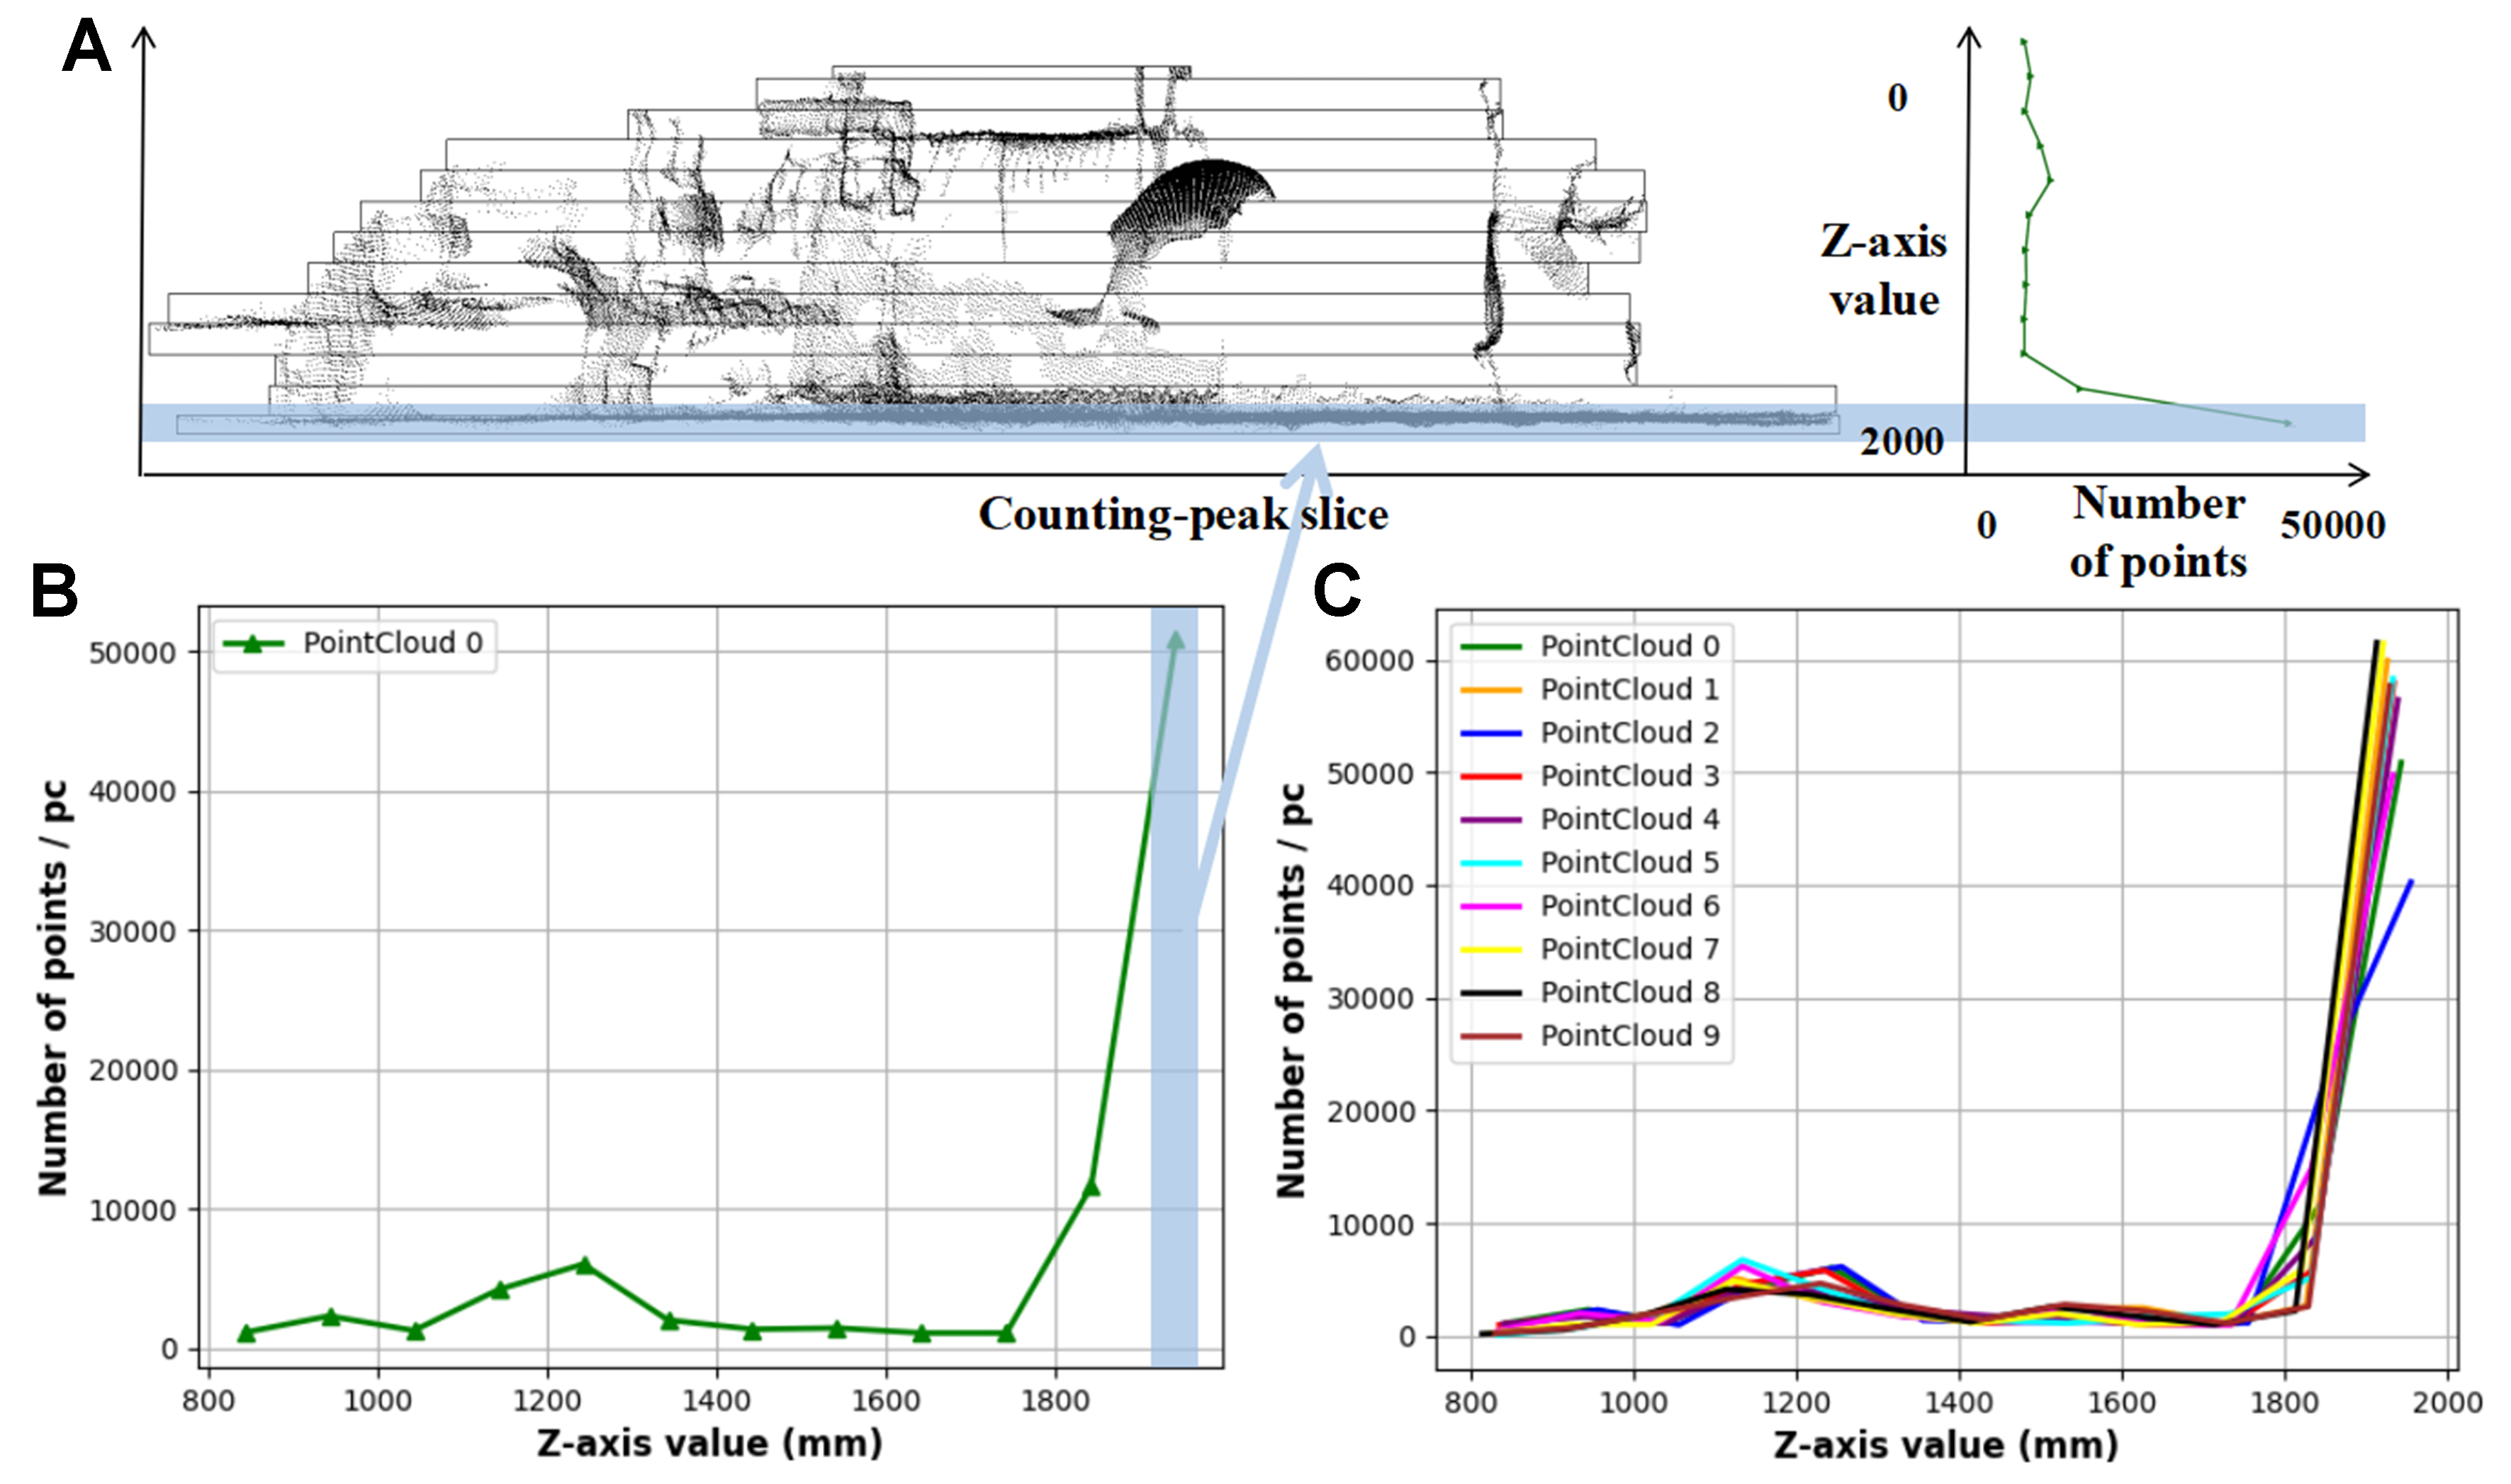
Figure 4. The distribution chart of point quantities within point cloud slices in the [Zmax - ΔZ, Zmax] interval. (A) The correspondence between slices and number of points; (B) The distribution chart of points in one point cloud set; (C) The distribution chart of points in ten point cloud sets.

Intelligence & Robotics
ISSN 2770-3541 (Online)

Portico

All published articles are preserved here permanently:

https://www.portico.org/publishers/oae/

Portico

All published articles are preserved here permanently:

https://www.portico.org/publishers/oae/