


Prognostic migrasome-associated long noncoding RNA model and tumor immune landscape in bladder cancer
 0
0 
Abstract
Aim: This study aims to identify migrasome-associated long non-coding RNA (lncRNA) signatures for prognostic prediction and to analyze their correlation with tumor microenvironment (TME) features in bladder cancer.
Methods: Data including transcriptome, mutation, and clinical profiles were obtained from TCGA. A total of 10 migrasome-related genes were used to screen co-expressed lncRNAs by Pearson correlation. Univariate Cox and LASSO-Cox regression analyses were performed for the selection of essential prognostic lncRNAs to construct a risk score model. Kaplan-Meier survival analysis, ROC curve, and nomogram were applied in model validation. The characteristics of TME were evaluated using ESTIMATE and CIBERSORT. Drug sensitivity was predicted using the oncoPredict algorithm.
Results: A total of 808 lncRNAs associated with the migrasome were identified, and seven lncRNAs were selected to construct a prognostic model. The overall survival (OS) of individuals in the high-risk group was significantly shorter than that of those in the low-risk group in training, testing, and full datasets (all P < 0.001), with a 5-year AUC of 0.685. Multivariate analysis showed that the risk score was an independent prognostic factor (HR = 1.119,
Conclusion: A 7-lncRNA signature serves as an effective predictor of bladder cancer prognosis, demonstrating a correlation with TME immune suppression and stromal activation. This discovery offers novel biomarkers for prognostic evaluation and the development of personalized therapy strategies.
Keywords
INTRODUCTION
Globally, bladder cancer is one of the most common malignancies in the urinary tract. Clinical outcomes for patients remain poor due to the high rates of recurrence and metastasis[1,2]. Despite advances in clinical diagnosis and treatment, late-stage or metastatic bladder cancer patients still face severe challenges such as limited treatment options and poor survival[3,4]. Tumor metastasis is a highly inefficient multistep process, as only a small fraction of cells shed from the primary tumor successfully establish metastases[5]. This low efficiency poses a major clinical challenge: how to accurately identify those early-stage patients whose tumor cells have strong metastatic ability and poor prognosis. These challenges highlight the urgent need to move beyond conventional clinicopathological staging and develop new molecular prediction tools.
The recent identification of a novel organelle, the migrasome, has provided new insights into tumor metastasis[6]. Migrasomes are vesicular structures formed by migrating cells to store and transfer information during directional cell migration[7]. Their formation relies on the precise assembly of tetraspanin proteins including TSPAN4[8]. Given their main function in long-range delivery of signaling molecules, migrasomes have been proposed to contribute to pre-metastatic niche formation[9]. They may act as a new type of signaling depot that enables distant colonization by tumor cells.
lncRNAs are important epigenetic regulatory factors that have been shown to regulate key biological processes, such as cell migration in a variety of cancers[10-12]. We hypothesize that lncRNAs may affect the biogenesis and function of migrasome by regulating the expression of migrasome-related genes, thereby affecting the metastatic efficiency of bladder cancer cells. However, current studies still have shortcomings: First, most existing prognostic models based on lncRNAs are only constructed according to statistical differences and do not directly correspond to specific biological functional phenotypes such as "migrasome", resulting in poor biological interpretability[13]. Second, most studies remain at the level of bioinformatics analysis and lack experimental verification for clinical translation, as well as further exploration of mechanisms such as the TME and treatment sensitivity[14].
This study addresses the above challenges by attempting to construct a lncRNA prognostic model that is highly consistent with the biological functions of migrasomes, so as to provide a predictive tool for bladder cancer with more mechanistic interpretability. It should be noted that this study is the first to systematically introduce the advanced concept of migrasome into the research framework of bladder cancer prognosis. By screening and modeling migrasome-related lncRNAs, it breaks through the limitations of traditional prognostic models that only rely on statistical correlation, thus establishing a functional basis for the model. Through multi-dimensional bioinformatics analysis, we constructed and verified a robust lncRNA feature model, and further revealed its regulatory significance in TME, mutation burden, treatment sensitivity and other aspects, which greatly improved the clinical translation potential of the model. This study not only provides a novel and reliable molecular label for bladder cancer prognosis evaluation, but also reveals a new mechanism of tumor metastasis from the perspective of migrasome, which provides a theoretical basis and data support for patient risk stratification and individualized treatment.
METHODS AND MATERIALS
Extracting information from the database
The Genomic, clinical and mutational data of bladder cancer were downloaded from the public portal of The Cancer Genome Atlas (TCGA) (https://tcga-data.nci.nih.gov/tcga/). The data were screened according to the following criteria: a diagnosis of bladder cancer and the availability of whole-exome sequencing (WES) data. A Perl script (version 5.40.0) was used to structure the data into a matrix representing the expression of genes related to bladder cancer in different samples. This script was also used to divide the original dataset into mRNA and lncRNA level matrices for structural clarity during subsequent computational steps.
Identification of migrasome-linked lncRNAs and evaluation of the TME
Ten key genes involved in migrasome-related biological processes were obtained from previous studies. Firstly, the expression profiles of these specific genes were extracted from the mRNA matrix of bladder cancer using the R environment (v4.4.2). Then, we intersected the migrasome-related genes with the lncRNA expression data previously extracted to obtain the expression patterns of migrasome-related lncRNAs. The co-expression between migrasome-related mRNA and lncRNA was evaluated and visualized by Sankey diagrams.
Establishment of prognostic model
Univariate Cox regression analysis was performed to screen the lncRNAs related to prognosis (P < 0.05). Then, related lncRNAs were further identified by using least absolute shrinkage and selection operator (LASSO) Cox algorithm. Based on these lncRNAs, a prognostic model of migrasome-related signature was constructed. The RiskScore is calculated as follows: riskScore = ∑[Exp(lncRNA) × coef(lncRNA) (Equation 1)]. Subsequently, samples were randomly divided into test group and training group. According to the median risk score, patients were divided into high-risk and low-risk groups. ROC curve, area under the curve (AUC), survival curves, univariate and multivariate Cox regression analyses were used to evaluate the reliability and accuracy of the prediction model. In addition, a nomogram integrating clinical data was also established to better validate the model's accuracy.
PCA and Calibration curves for the model validation
Principal component analysis (PCA) was performed on the signature lncRNAs, palmitoylated genes and lncRNAs, as well as the total gene set to evaluate the efficiency of the lncRNA-based model in distinguishing high-risk samples from low-risk ones.
To further verify the predictive accuracy, we constructed a nomogram and calibration plots based on clinicopathological parameters including age, sex, tumor grade, and TNM stage using the R package "RMS" (R v4.4.2). This methodology enabled estimation of cumulative survival probabilities for bladder cancer patients at 1-, 3-, and 5-year time points, with subsequent generation of Calibration plots to evaluate the alignment between nomogram-predicted outcomes and observed survival data.
Functional pathway analysis of genes with significant risk differences
We first conducted Gene Ontology (GO) and Kyoto Encyclopedia of Genes and Genomes (KEGG) pathway analyses on the differentially expressed genes between risk groups. The functional enrichment results were classified into three categories: molecular function (MF), cellular component (CC), and biological process (BP). We focused on the genes that participated in pathways identified by GO and KEGG analyses. Gene Set Enrichment Analysis (GSEA) was used to identify pathways from the KEGG database and differentially expressed genes between the two risk groups. Significance for enrichment was defined as P < 0.05 and
Clinical correlation analysis and validation of grouping models
The R packages "survminer" and "survival" were employed within the R environment (v4.4.2) to analyze pre-organized clinical data. Survival analysis was conducted with respect to age, gender, stage, and grade. Based on a previously established predictive model, the study cohort was stratified into two risk groups using the median value of the calculated RiskScore as the cutoff. Subsequently, survival probabilities for both high-risk and low-risk cohorts were visualized and compared using the organized clinical information. The analytical results indicated that when P > 0.05, different clinical characteristics did not exert a statistically significant impact on the risk stratification model.
TMB analysis and survival analysis
To explore the differences in TMB among different risk levels, we used the “limma” package in R to test for differences and calculate p values. We then performed survival analysis of TMB to determine whether there are significant differences in patient survival between high and low groups of TMB, which can verify that TMB is a useful prognostic predictor.
TME analysis
The TME was evaluated using the R package “estimate” (v4.4.2) to calculate the ImmuneScore and StromalScore for each specimen, which were then combined into a single value called ESTIMATEScore per sample. High and low concentrations of different cells in samples were determined based on these scores. The ESTIMATEScore represents the total amount of stroma and immune components within the tissue being analyzed. The three indices were compared statistically between high- and low-risk groups, and their variations were plotted. These profiles were used to estimate how sensitive tumor cells might be to treatment with immune checkpoint inhibitors.
Immune infiltration analysis
The CIBERSORT algorithm was used to analyze the distribution of various immune cell types, using the "preprocessCore" and "limma" packages in R. A self-written R script (v4.4.2) was used to calculate the proportion content of immune cells for each sample. At the same time, a P value was calculated to determine the accuracy of the previous relative content. Therefore, we considered that the samples with P < 0.05 had more reliable estimation results. Then, box plots were drawn to show the differences in the content of immune cells in samples that met the " P < 0.05" standard.
Analyzing mutations between different risk subgroups
High- and low-risk mutation data files were organized by running a perl (5.40.0) script. The column header of the file was sample name, and row header was various information about mutations including mutation site and type. Waterfall plots were drawn to visualize mutated samples, genes, and their frequencies. By comparing two waterfall plots, we could check which genetic alterations occurred in individual samples between high-risk and low-risk groups, and also see how frequently a certain gene is mutated within the same group of samples. As a result, it allowed us to screen genes that might have prognostic value.
Evaluation of pharmacological sensitivity
We used the oncoPredict R package to estimate IC50 values for a variety of therapeutic agents. Both CTRP and GDSC data were included in our analysis. We applied a stringent filtering threshold of P < 10-9 to identify drugs with highly divergent sensitivity profiles across risk groups.
RESULTS
Recognition of lncRNAs linked to migrasomes in bladder cancer
A total of 10 migrasome-related genes were identified. We then performed co-expression analysis and identified 808 migrasome-related lncRNAs, which are represented in the Sankey diagram [Figure 1A]. The different colors represent the different migrasome genes, with lines drawn to connect corresponding lncRNAs. It is noteworthy that the EPCIP co-expressed lncRNAs account for more than 90% of all lncRNAs in the pool of identified migrasome-related lncRNAs.
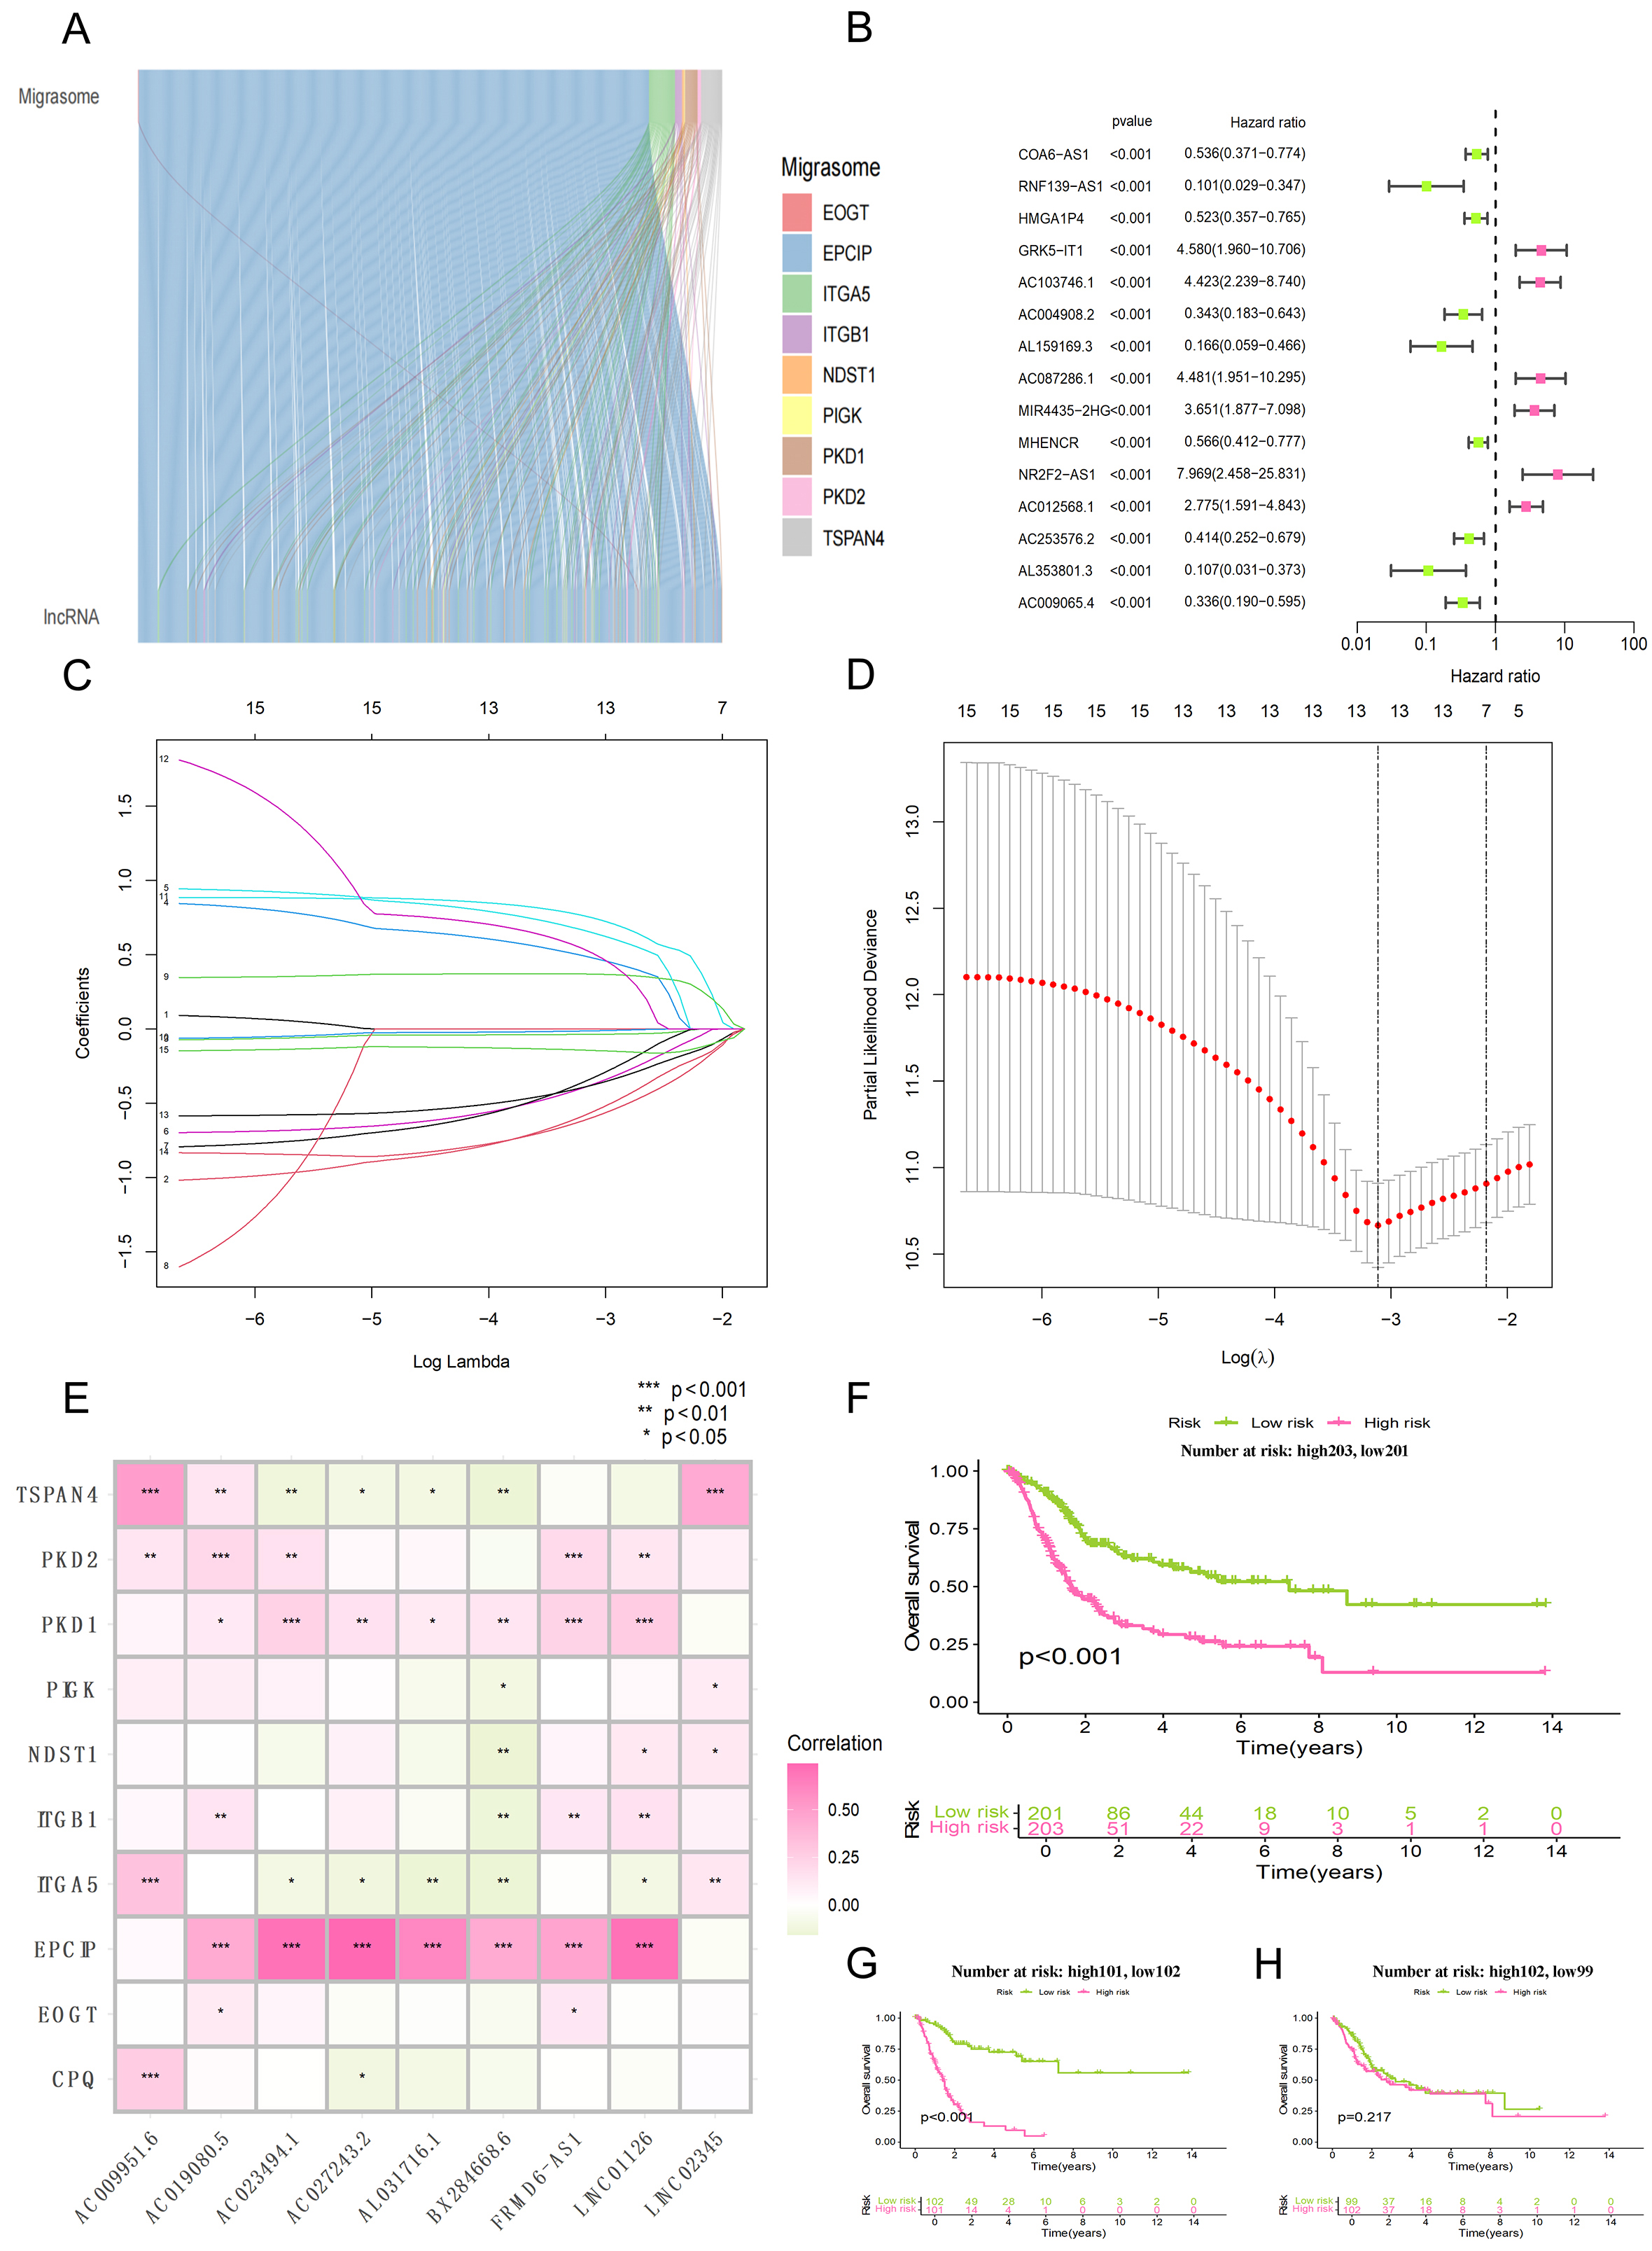
Figure 1. Screening of migrasome-associated lncRNA and construction of prognostic model. (A) Sankey diagram illustrating the regulatory associations between core migrasome genes and their co-expressed lncRNAs; (B) Forest plot displaying the results of the univariate Cox regression analysis for the candidate lncRNAs; (C) Distribution of LASSO coefficients for the migrasome-associated lncRNAs (presenting only the top 15 entries with the lowest p-values); (D) Determination of the optimal tuning parameter (lambda) within the LASSO Cox regression framework via 10-fold cross-validation; (E) Correlation heatmap depicting the associations between specific migrasome genes and the related lncRNAs used in the model; (F) Kaplan-Meier analysis comparing survival outcomes between the high-risk and low-risk subgroups within the entire study cohort; (G) Kaplan-Meier curves illustrating the survival disparities between risk categories within the training dataset; (H) Kaplan-Meier survival assessment for high-risk vs. low-risk patients in the independent testing dataset.
Development of the predictive model
To begin with, the forest plot was used to screen out specific migrasome-related lncRNAs by univariate Cox regression modeling [Figure 1B]. Next, related lncRNAs were obtained through Lasso regression analysis, such as LINC02345, AL031716.1, LINC01126, AC027243.2, AC023494.1, AC019080.5, AC009951.6, BX284668.6 and FRMD6-AS1 [Figure 1C and D].
To determine whether the model lncRNAs have functional relevance to migrasome biology, we performed correlation analysis between them and core migrasome genes. The correlation analysis of lncRNAs and migrasome genes was used as part of the model building process [Figure 1E]. Of note, the migrasome gene EPCIP showed the strongest correlations with AC023494.1, AC027243.2, and LINC01126 (all P < 0.001).
Prognostic model accuracy validation
The bladder cancer study population was divided into a training set and test set at a ratio of 1:1. The survival analyses for all samples, the training cohort, and the test cohort are shown in Figure 1F-H, respectively. The median riskScore was calculated according to Equation 1. Then, the subjects were divided into high-risk and low-risk groups based on this median value. A heatmap of gene expression in each sample was drawn for both groups. Survival analysis including riskScore distribution, as well as vital status and survival time were performed subsequently. The expression heatmap, risk score distribution map and survival state plot of the three groups are as follows: All samples [Figure 2A-C], results of the training set [Figure 2D-F] and test set [Figure 2G-I]. In the survival state plot, it can be seen that with the increase of risk score, the proportion of dead samples increased significantly.
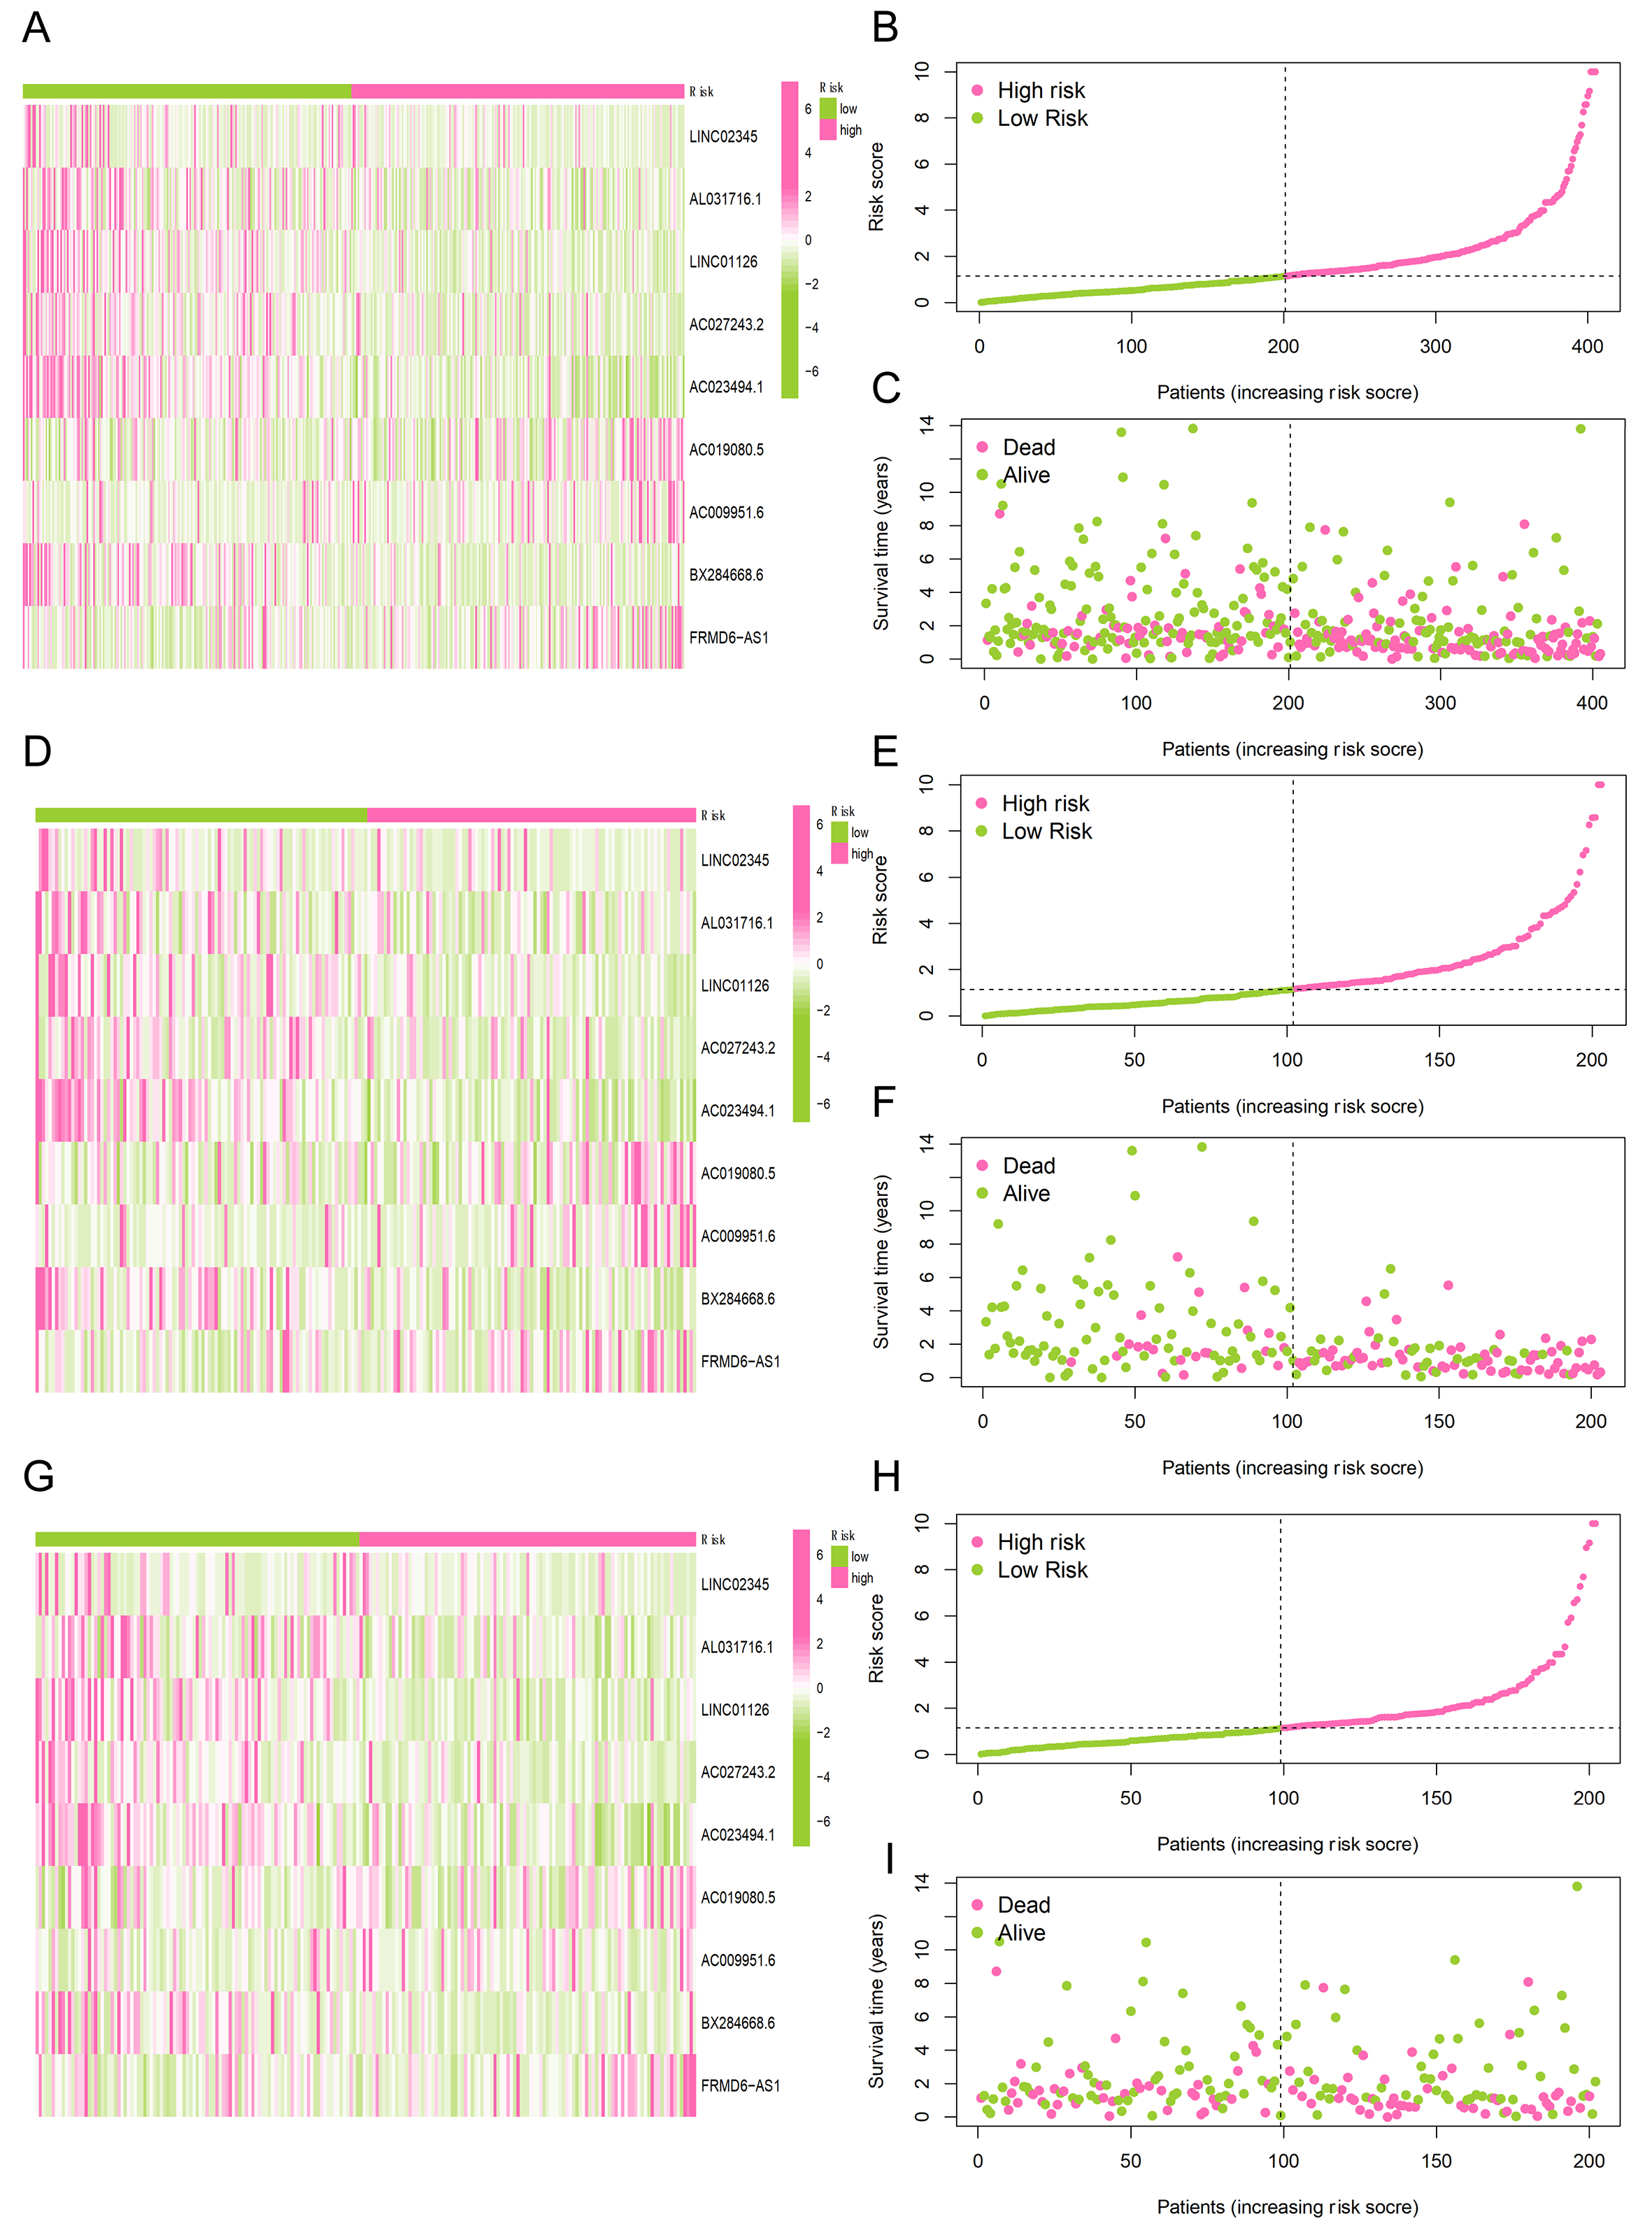
Figure 2. Visualization of gene expression, risk score, and survival status for risk groups. (A, D, G) Heatmaps illustrating the hierarchical clustering of migrasome-associated lncRNAs across both high-risk and low-risk cohorts; (B, E, H) Ranking and distribution profiles of the risk scores for participants in the two risk categories; (C, F, I) Scatter plots depicting the survival duration and current status of patients within the high-risk vs. low-risk subgroups.
We evaluated the prognostic accuracy of clinical features and riskScore by several methods. Both the clinical feature information and the riskScore were subjected to univariate cox analysis, in which each clinical feature was used as a prognostic indicator alone, and multi-variable Cox regression model, in which multiple factors interact with each other [Figure 3A and B]. The p value of riskScore was always less than 0.05, indicating that it had prognostic significance. Other significant prognostic factors included age and staging. Hazard ratio greater than 1 indicates that this factor is a risk factor and may worsen the disease.
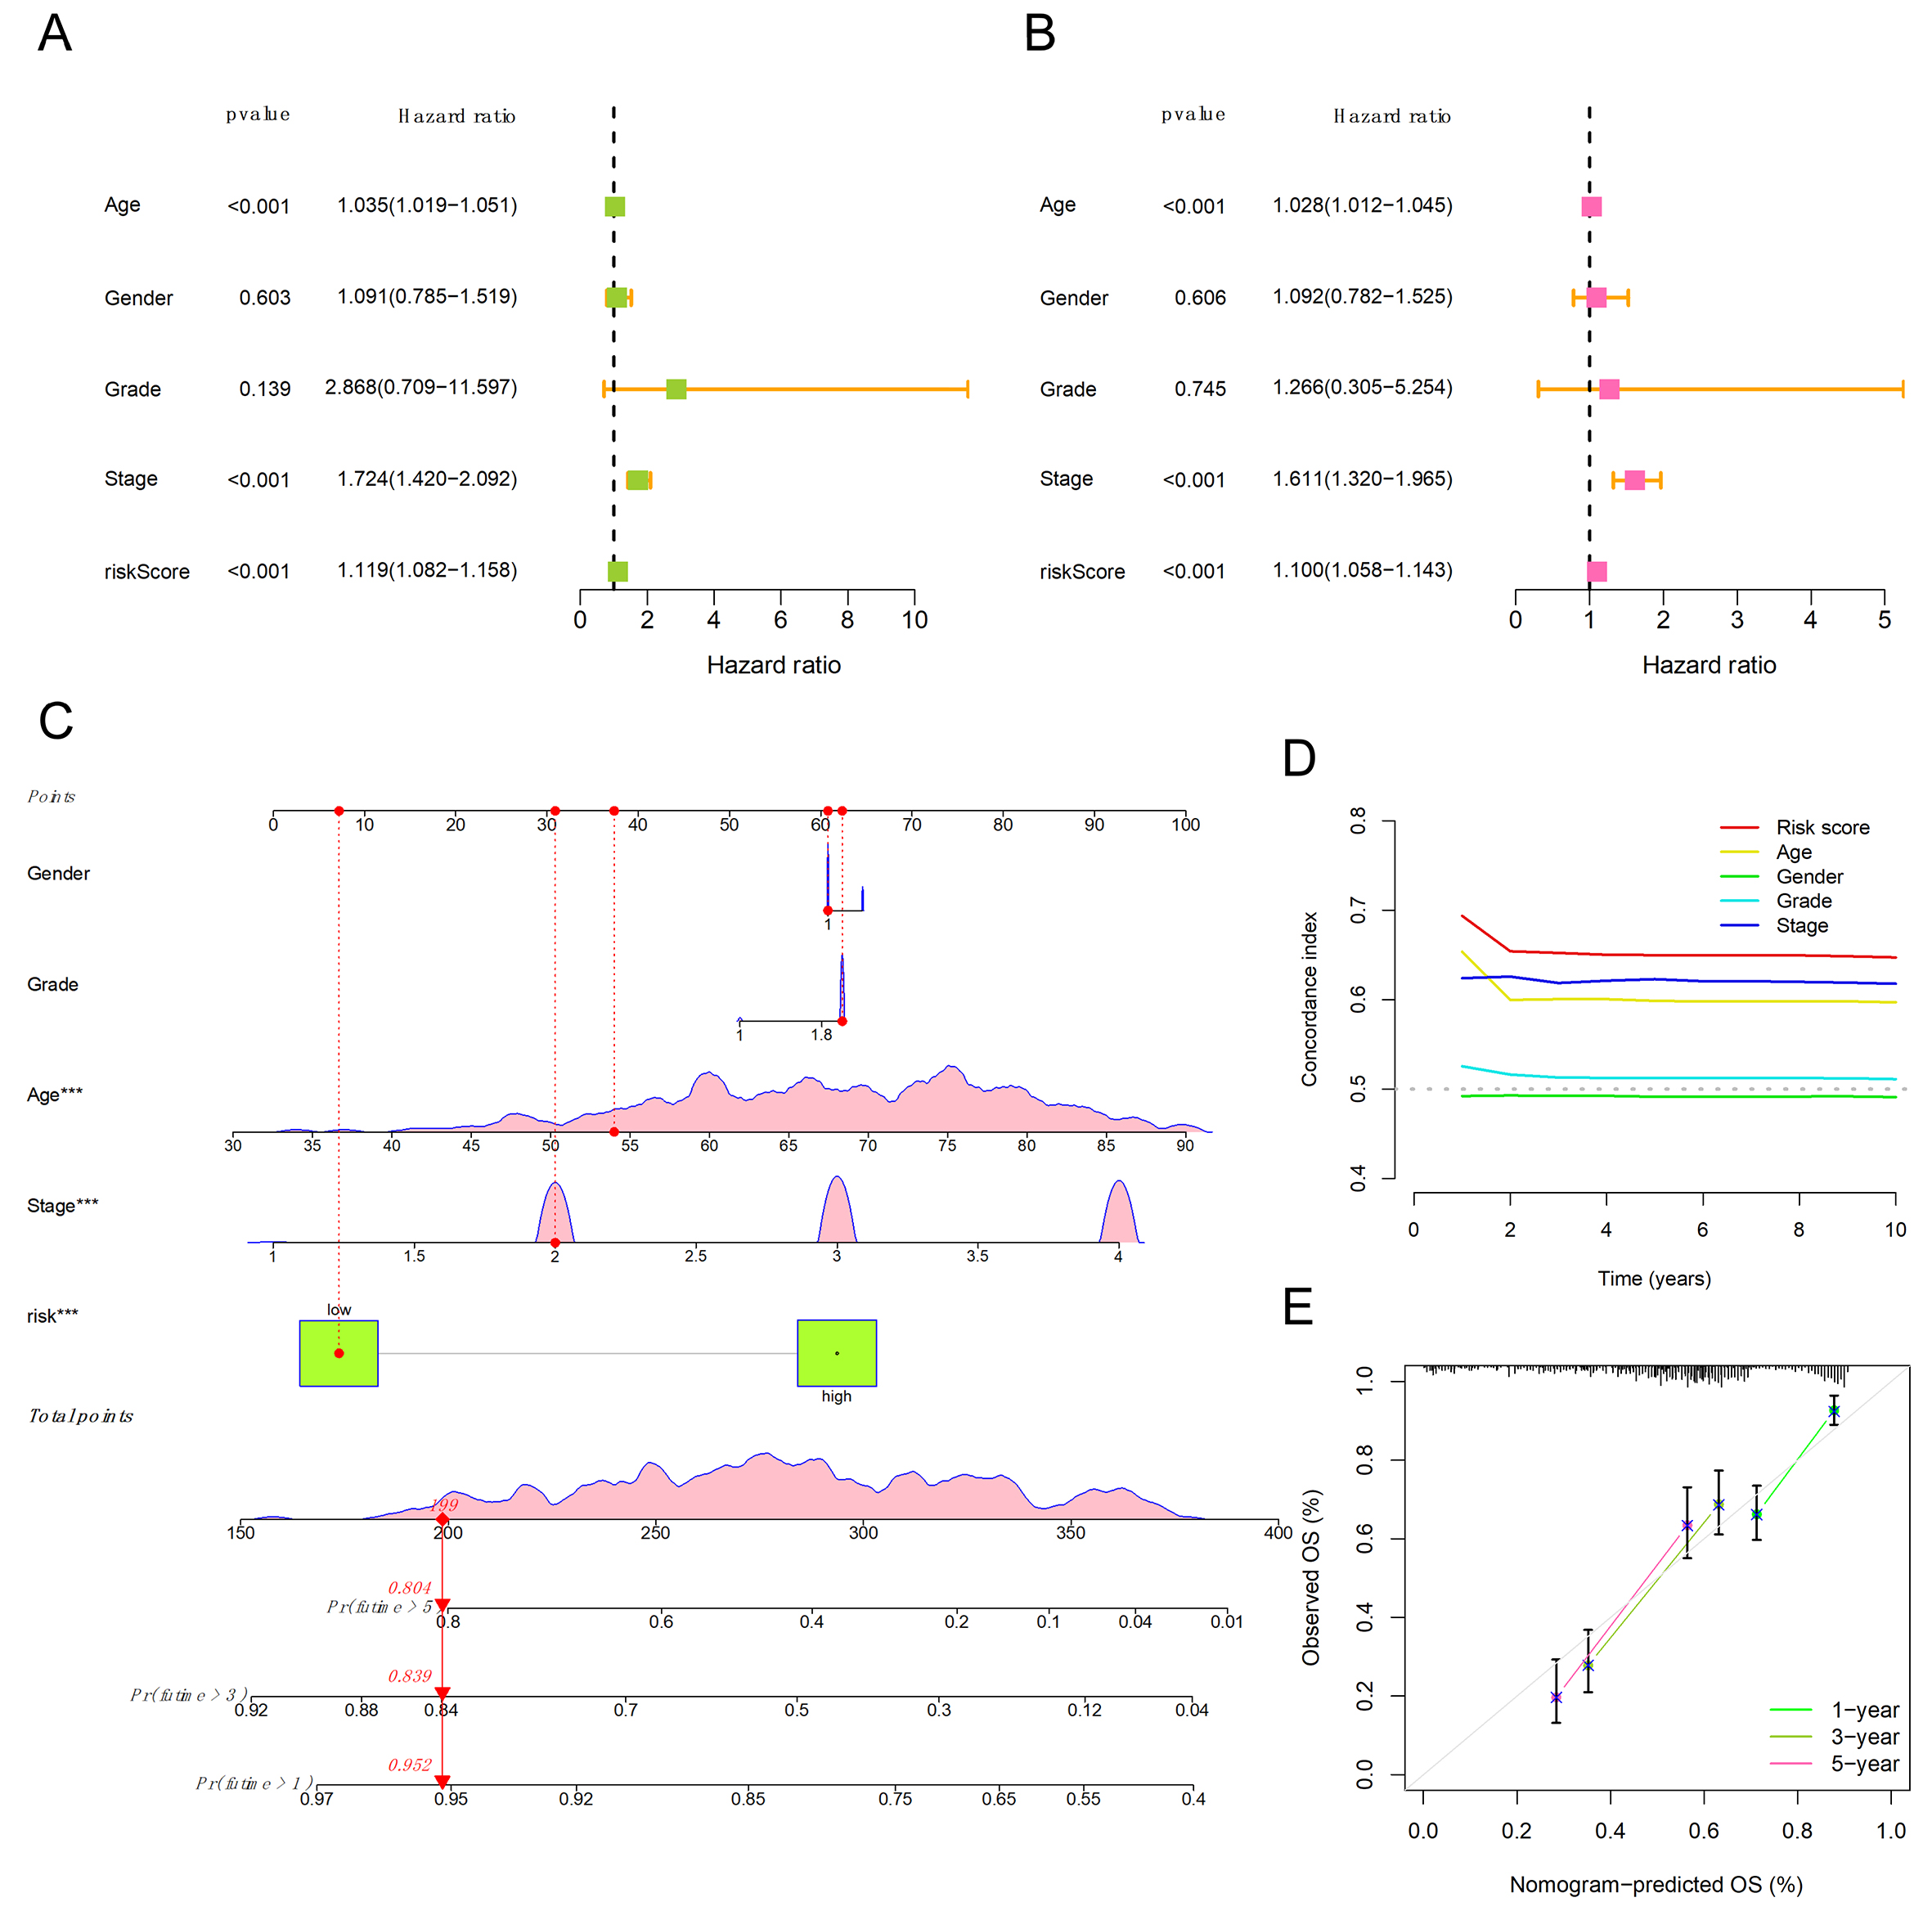
Figure 3. Clinical independence verification and nomogram prediction model. (A) Forest plot of the univariate Cox regression analysis, illustrating the prognostic impact of clinical parameters and the risk signature in bladder cancer; (B) Multivariate Cox regression findings, evaluating the independent predictive value of clinical features alongside the risk scoring system; (C) Construction of a nomogram by integrating the migrasome-associated risk signature with relevant clinical indicators; (D) Comparison of the Concordance index (C-index) between the established risk model and traditional clinical traits; (E) Assessment of the nomogram's predictive reliability for bladder cancer survival at 1-, 3-, and 5-year marks using calibration plots.
We generated calibration curves [Figure 3C] using the clinical factors and riskScore. As shown in Figure 3C, the probability of a patient surviving for more than one year was 0.952, for more than three years was 0.839, and for more than five years was 0.804. In the C-index plot, the vertical axis represents the value of the C-index, while the horizontal axis indicates the predicted survival time. The magnitude of the C-index value reflects the level of accuracy of the factor. As shown in Figure 3D, the riskScore showed the highest C-index value, providing further evidence for the predictive reliability of our model. Furthermore, Figure 3E validates the validity of the model by verifying the estimated probabilities of survival at 1-, 3-, and 5-year intervals as produced by our signature.
Survival analysis by clinical trait groups
The survival Sankey diagrams of age (≥ 65 years and < 65 years) as the classification standard in the high-risk and low-risk groups are shown Figure 4A and B. The survival Sankey diagrams of grade as the classification standard in the high-risk and low-risk groups with different tumor grades are shown in Figure 4C and D. Figure 4E-H show gender and staging as classification criteria, respectively. P < 0.05 indicates that the model can effectively distinguish and predict high and low risk for these characteristics. However, the p values for “low grade” and “Stage 1-2” were greater than 0.05, indicating that the model does not apply to this characteristic, but the overall accuracy of the model is very high.
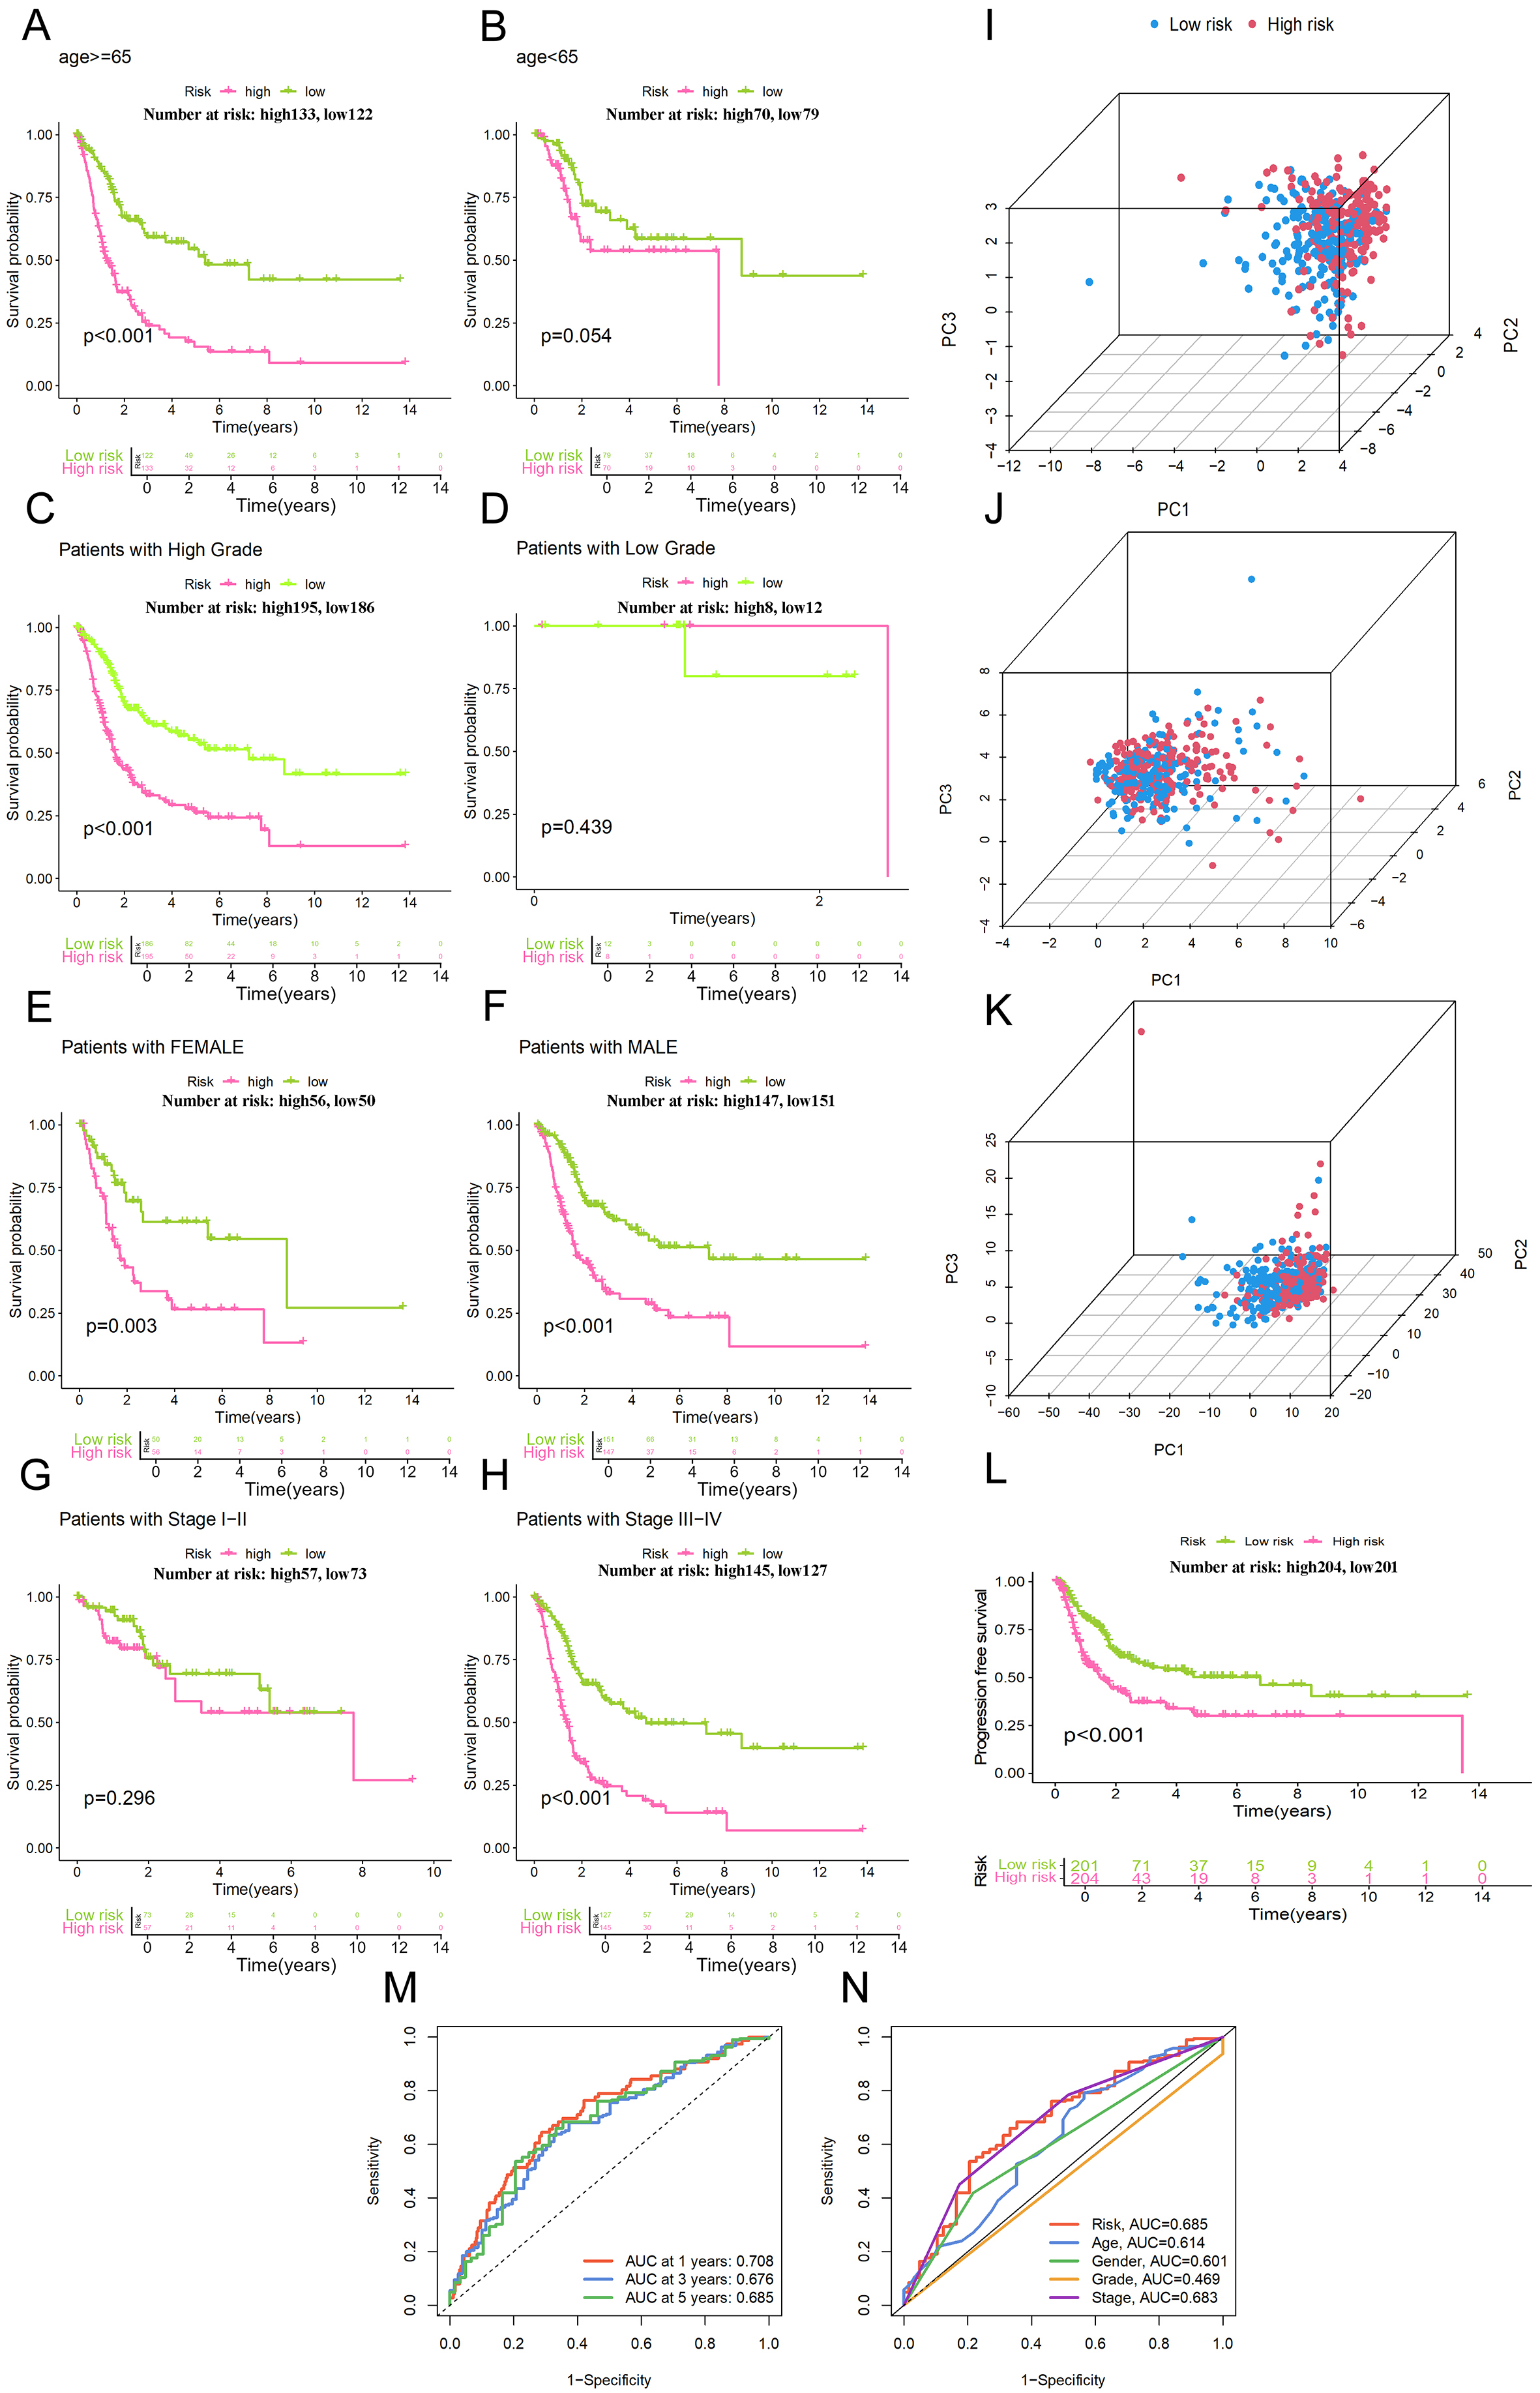
Figure 4. Subgroup survival analysis and PCA. (A and B) Stratified survival analysis using Kaplan-Meier curves for high- and low-risk cohorts divided by age; (C and D) Comparison of Kaplan-Meier survival outcomes between high-risk and low-risk participants based on tumor grade; (E and F) Evaluation of survival probabilities for different risk groups via Kaplan-Meier plots, categorized by patient gender; (G and H) Kaplan-Meier estimates showing survival differences for high-risk vs. low-risk cases across distinct pathological stages; (I) PCA of risk lncRNA. (J) PCA of migrasome genes. (K) PCA of migrasome lncRNA; (L) Survival curve of PFS (Progression-Free Survival) analysis; (M) Assessment of the risk model's performance through time-dependent ROC analysis for bladder cancer at intervals of 1, 3, and 5 years; (N) Relative predictive performance of the risk-scoring system in comparison with various clinicopathological traits.
PCA plots of lncRNAs, migrasome-related genes and migrasome-related lncRNAs used for model construction are shown in Figure 4I-K, respectively, which were applied to assess the ability of these variables as classification criteria for distinguishing high-risk group from low-risk group. The selected lncRNAs in final model showed better performance on discriminating high-risk samples from low-risk ones, indicating that our 7-lncRNA signature could capture most relevant transcriptomic variation associated with migrasome-related high-risk phenotype.
Figure 4L shows the Kaplan-Meier analysis of Progression-Free survival (PFS) with PFS in y-axis. As time goes by, patient survival decreases and high-risk group declines more rapidly and reaches a plateau at about five years while low-risk cohort remains stable after approximately eight years of follow up. The receiver operating characteristic (ROC) analysis for risk score yielded an AUC of 0.685 [Figure 4M and N]. Of note, this value is higher than AUC for all clinical traits, indicating robustness of the model.
Functional analysis of biological pathways
The x-axes of Figure 5A and B represent the “Enrichment Score” and “Counts”, respectively, showing the results of GO and KEGG enrichment analysis. Pathways with smaller p values are considered to be more significant. These include extracellular space, cornified envelope, and structural molecule activity. The genes involved in these pathways are shown in Figure 5C, where most of the genes were located in the extracellular region.
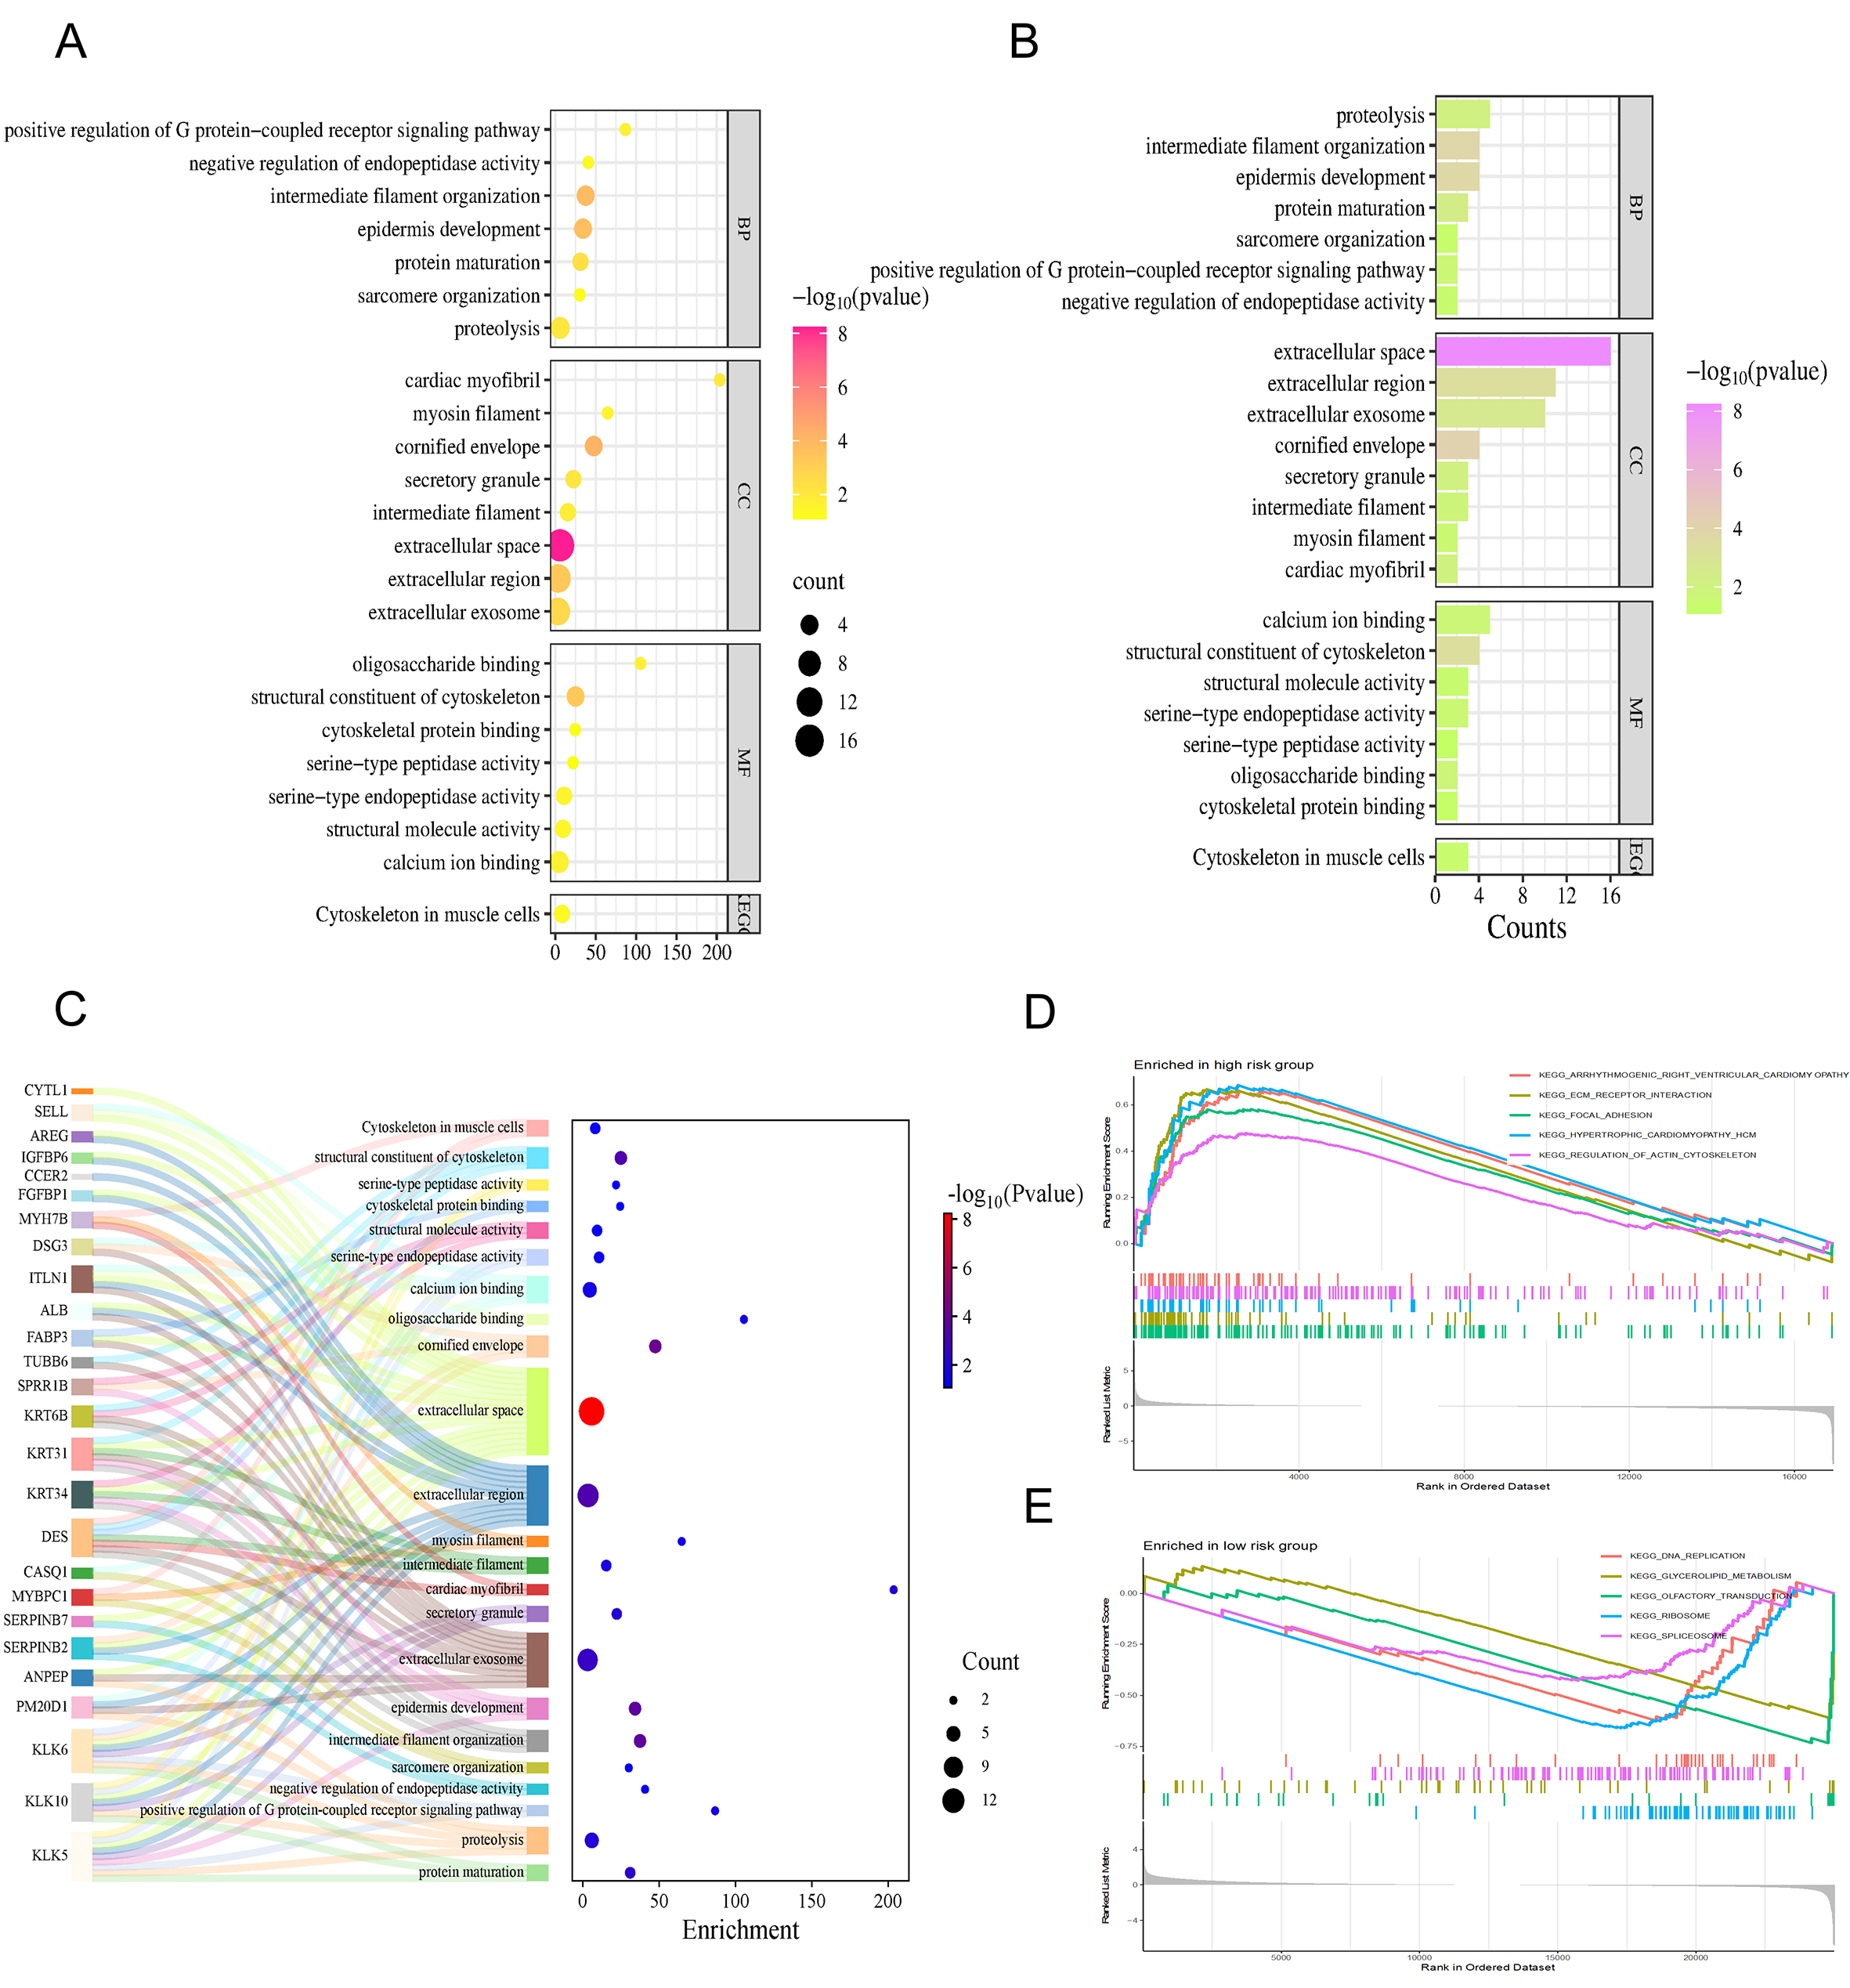
Figure 5. Functional enrichment analysis and pathway differences. (A) Outcomes from the GO and KEGG functional enrichment, where the horizontal axis represents the Enrichment Score; (B) Pathway profiles from GO and KEGG analyses, with the x-axis indicating the number of genes (Counts); (C) Sankey diagram demonstrates the genes involved in the pathways; (D) GSEA-based enrichment findings for high-risk patients utilizing the KEGG signaling pathway library; (E) Results of the GSEA analysis identifying active pathways within the low-risk subgroup derived from the KEGG repository.
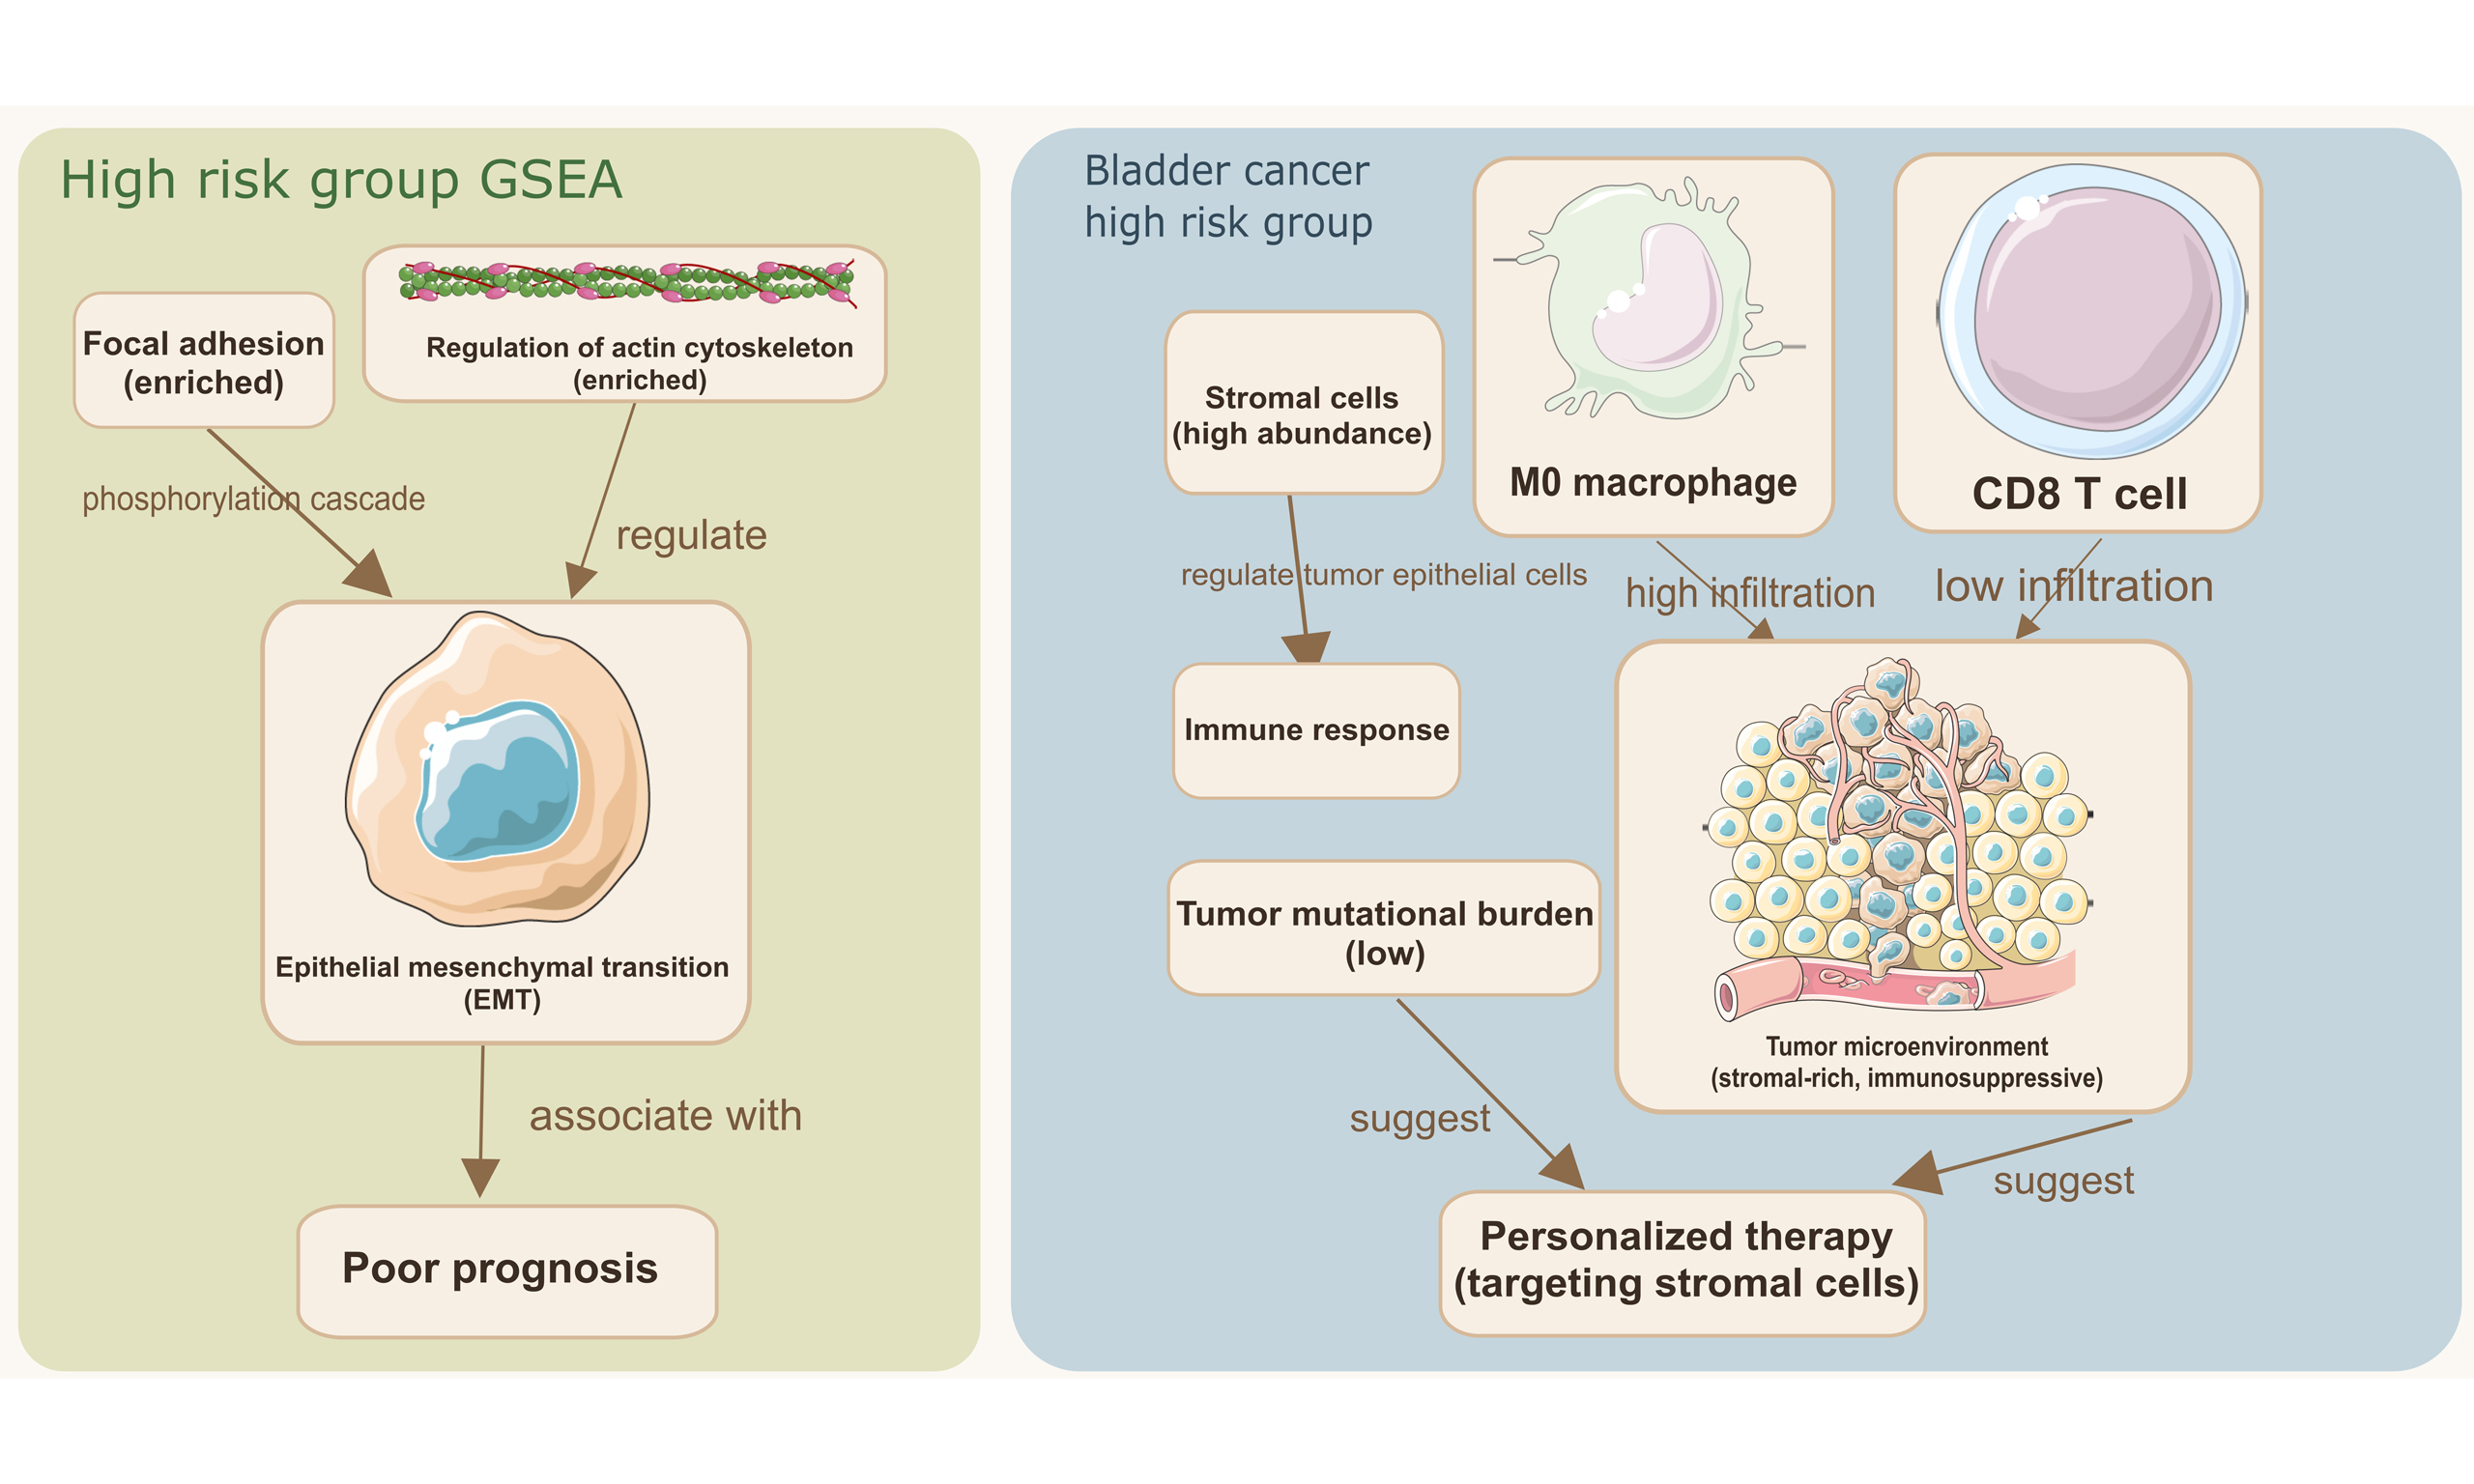
In addition, we performed GSEA enrichment analysis using the KEGG database. Figure 5D and E shows five pathways with the highest enrichment scores in high-risk vs. low-risk groups. The following pathways were enriched in the high-risk group: Arrhythmogenic right ventricular cardiomyopathy, regulation of actin cytoskeleton, ECM receptor interaction, Focal adhesion. Interestingly, the pathways that were enriched in the high-risk group were completely different from those in the low-risk group.
Importantly, the pathways enriched in the high-risk group, namely “Focal adhesion”, “Regulation of actin cytoskeleton”, and “ECM-receptor interaction”, are all closely associated with cell migration, mechanical force transduction, and invasion. These biological processes are directly connected to migrasome function. When combined with the strong co-expression observed between the model lncRNAs (AC023494.1, AC027243.2, LINC01126) and the core migrasome gene EPCIP, these enrichment results offer convergent evidence that our lncRNA signature captures a cellular state conducive to migrasome-mediated migration and invasion.
Immune infiltration analysis and TME analysis
The comparative proportions of 22 immune cell types in the analyzed cohort are shown in Figure 6A, and differentially expressed immune cells are highlighted in Figure 6B. Compared with the low-risk cohort, resting mast cells, M0 macrophages, and resting memory CD4+ T cells were more prevalent in the high-risk group. In contrast, activated dendritic cells, regulatory T cells (Tregs), and CD8+ T cells were increased in the low-risk population. The remaining immune cells demonstrated no statistically significant differences among the risk subgroups. This distribution pattern, which is characterized by a decrease in cytotoxic CD8+ T cells and an increase in resting immune cell types in the high-risk group, suggests microenvironmental immunosuppression.
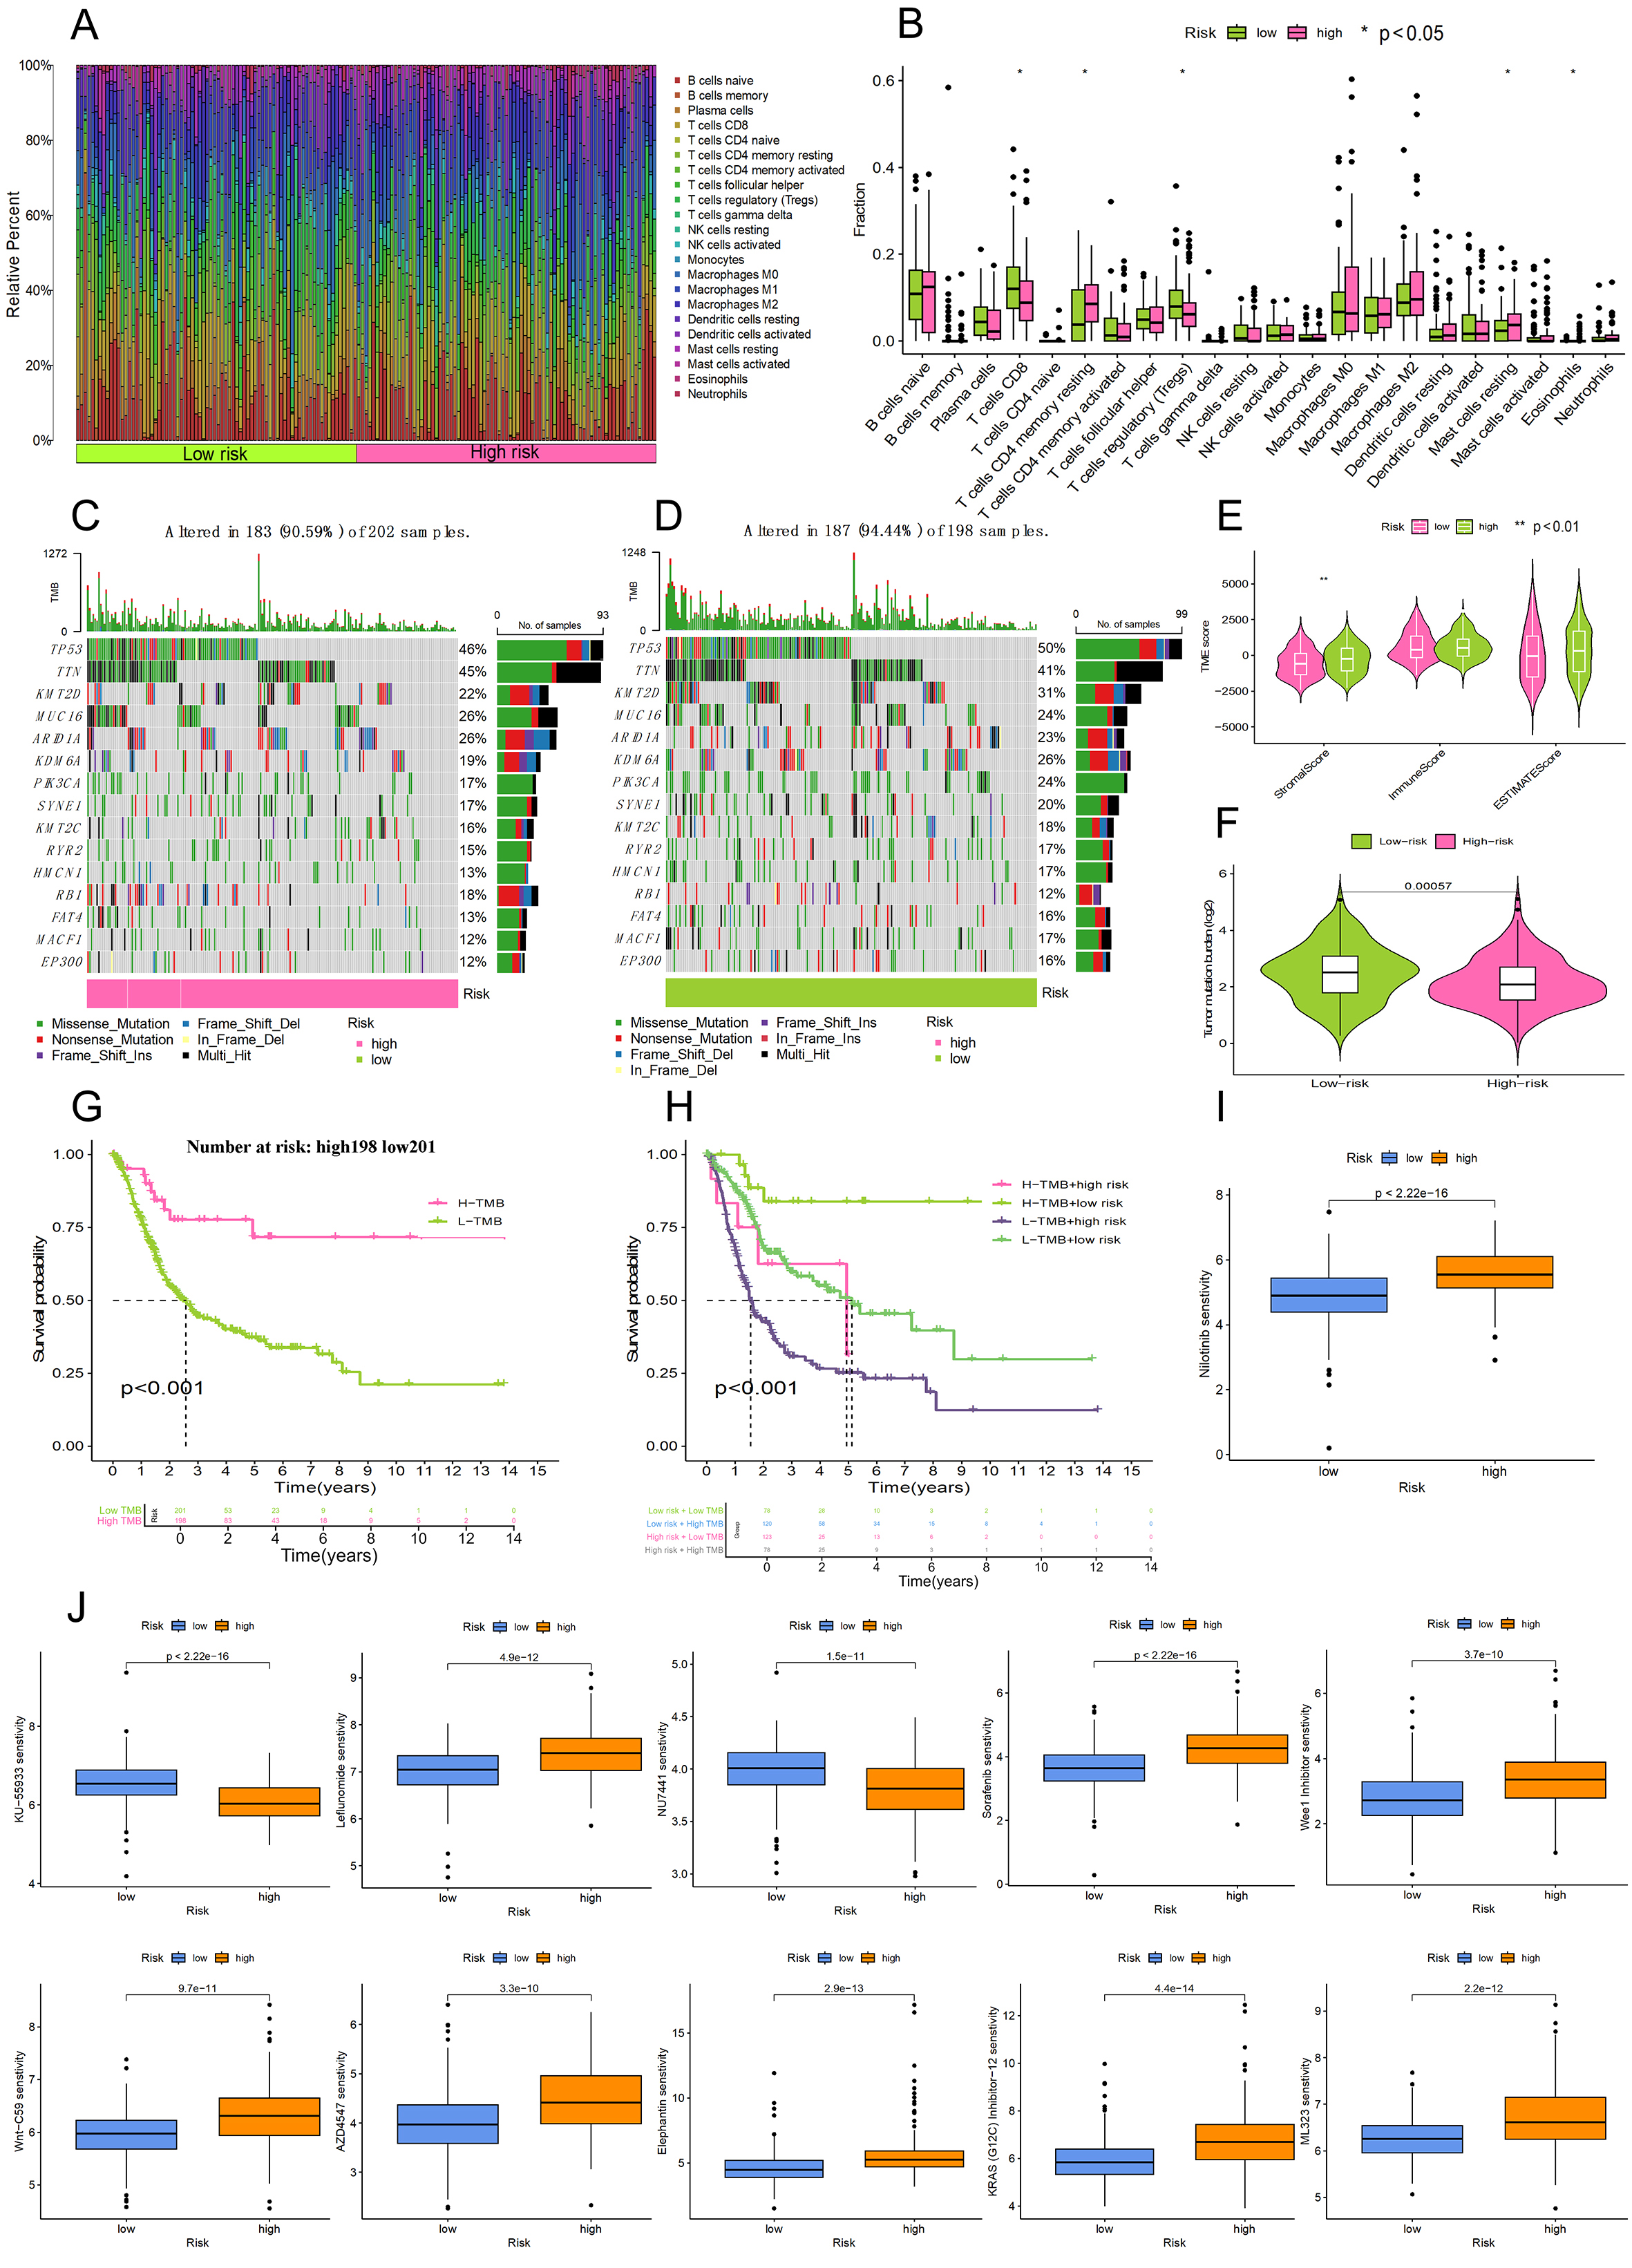
Figure 6. Analysis of the tumor microenvironment, mutational burden, and drug sensitivity. (A) Proportional distribution of various immune cell types within the bladder cancer cohort; (B) Comparison of infiltrating immune cell levels between the high-risk and low-risk categories; (C and D) Genomic landscape of somatic mutations presented via waterfall diagrams for both risk subgroups; (E) Violin plots illustrating variations in ImmuneScore, StromalScore, and ESTIMATEScore across the risk cohorts; (F) Comparative analysis of tumor mutational load (TMB) between the high-risk and low-risk participants; (G) Influence of TMB levels on the overall survival of bladder cancer patients using Kaplan-Meier modeling; (H) Survival curves for patients stratified by the combined evaluation of risk scores and TMB status; (I) Drug sensitivity (Nilotinib). A lower IC50 value (Vertical axis) signifies higher drug sensitivity; (J) Drug sensitivity (other drugs).
TMB
Using the R package “maftools”, we calculated the statistical results of tumor mutation load and evaluated the probability and type of gene mutations in our samples. The waterfall plots [Figure 6C and D] intuitively show the alteration rate of genes in two risk groups, indicating that patients in the high-risk group have a significantly lower TMB than those in the low-risk group. It can also be seen that the larger the TMB value, the weaker the immune escape ability, and consequently, the better the anticipated response to immunotherapy. In addition, there were significant differences in the frequency of variation between the two groups for TP53 and KMT2D. As far as TME was concerned, Figure 6E showed that the stroma component in high-risk patients was significantly higher than that in low-risk patients (P < 0.001). However, no significant difference was found in the ESTIMATE score or the overall proportion of immune cells in different risk groups. The increased stromal scores observed in high-risk samples indicate an increase in cancer-associated fibroblasts (CAFs) activity and extracellular matrix remodeling, which are known to promote tumor invasion and metastasis. This is consistent with the pro-invasive phenotype of the migrasome. The p value obtained by analysis of variance of TMB [Figure 6F] on high and low risk groups was 0.00057, less than 0.05, and the result was considered statistically significant.
The samples were further grouped by TMB size, and the high-TMB and low-TMB groups were used for survival analysis [Figure 6G]. The results showed that the prognosis of the low-risk subgroup was significantly better than that of the high-risk cohort. The p value of the model constructed with TMB was calculated to be less than 0.001, indicating a good accuracy. In addition, we combined the TMB score with the risk score of the previously established model. As shown in Figure 6H, patients in the high TMB and high-risk group (the gray line) had the worst prognosis, suggesting that poor prognosis is related to high risk and low TMB. The p value was calculated to be less than 0.001, which again confirmed the reliability of our previous risk score grouping. These data indicate that the poor clinical outcome of high-risk patients may be due to biologically aggressive, metastasis-related phenotypes rather than a high neoantigen load and that these patients are unlikely to respond well to immunotherapy alone[15].
Drug sensitivity analysis
Drug sensitivity analysis using the OncoPredict algorithm revealed 11 pharmaceuticals with significant differences in sensitivity between high-risk and low-risk participants (P < 10-9). A lower half-maximal inhibitory concentration (IC50) represents higher sensitivity to the drug. Of particular interest, nilotinib showed the most pronounced difference in response, where the high-risk cohort was significantly more sensitive (as indicated by a lower IC50 level) than the low-risk population (P < 10-9, Figure 6I). In contrast, KU-55933 showed the exact opposite pattern, where the low-risk cohort was more sensitive (reflected by decreased IC50 values) than the high-risk group (P < 10-9, Figure 6J). The results indicate different therapeutic response profiles between risk subgroups and suggest that patients could be treated differently based on their migrasome-associated lncRNA risk score. This goes beyond pure prognostication and suggests potential personalized or tailored treatment approaches, indicating that the migrasome-related high-risk phenotype may harbor specific druggable weaknesses. Table 1 shows the drug sensitivity analysis of 11 drugs.
Results of drug sensitivity analysis
| Drug | Sensitive group |
| Nilotinib | Low |
| KU-55933 | High |
| Leflunomide | Low |
| NU7441 | High |
| Sorafenib | Low |
| Wee1 Inhibitor | Low |
| Wnt-C59 | Low |
| AZD4547 | Low |
| Elephantin | Low |
| KRAS (G12C) Inhibitor-12 | Low |
| ML323 | Low |
DISCUSSION
Although the metastatic process is notoriously inefficient, it remains the main cause of death from bladder cancer. Only a small fraction of shed tumor cells will ever give rise to overt metastases[16]. This biological inefficiency translates into the major clinical challenge of identifying patients whose tumors are equipped with the molecular machinery for efficient metastasis. The migrasome is an organelle that was recently described to form on retraction fibers of migrating cells and shown to coordinate cell-cell communication and spatial organization during migration[17]. Its formation via tetraspanin macrodomain assembly is significantly increased in invasive tumor cells and may facilitate their ability to metastasize efficiently. In the current study, we aimed to develop a model based on the biological function of the migrasome with potential clinical applicability. We reasoned that a migrasome-related lncRNA signature could help stratify bladder cancer patients according to their metastatic competence and thus serve as both a prognostic tool and a mechanism underlying aggressive disease.
In this study, we developed and validated a novel prognostic signature for bladder cancer based on migrasome-associated lncRNAs. Using transcriptomic data from TCGA, we screened 808 lncRNAs co-expressed with core migrasome genes and constructed a related-lncRNA risk model through univariate Cox and LASSO-Cox regression analyses. The model demonstrated robust predictive performance across training, testing, and full cohorts, and the risk score was confirmed as an independent prognostic factor in multivariate analysis. These findings establish a clinically relevant tool for risk stratification and lay the foundation for exploring the underlying biological mechanisms linking migrasome biology to poor prognosis in bladder cancer.
Gene Set Enrichment Analysis (GSEA) revealed that actin cytoskeleton organization and dynamics were significantly enriched in the high-risk cohort, suggesting their role as key drivers of tumor progression. these processes can regulate epithelial-mesenchymal transition (EMT), a cellular program often associated with poor prognosis in metastatic cancer cells[18,19]. The GSEA enrichment results strongly support this. High-risk enriched pathways such as ‘focal adhesion’ and ‘regulation of actin cytoskeleton’ have direct roles in regulating cell migration and invasion. These functions are essential for cancer cells to overcome multiple biological barriers during metastasis. Previous studies have shown that expression of actin cytoskeletal regulators and proteins has a critical impact on clinical progression and adverse outcomes in several malignancies including lymphoma[20], breast cancer[21] and hepatocellular carcinomas[22]. Adhesion plaque kinases in focal adhesions activate molecular mechanisms that regulate the tumor’s malignant phenotype by phosphorylating and modifying downstream effector proteins within the cytoplasm[23]. These processes reinforce cell-cell adhesive junctions, drive tumor proliferation, maintain cancer stemness, and increase invasive and metastatic potential[24]. Further research has revealed that this phosphorylation cascade triggers EMT program initiation, accelerates neoangiogenesis, reduces chemosensitivity, and initiates desmoplastic remodeling of the TME[25]. The enrichment of these particular pathways in our high-risk metastasis group strongly links our migrasome-derived signature to specific biological functions proposed for migrasomes. These include increased motility, invasion, and interaction with the ECM, all of which are crucial for cancer cell dissemination. This suggests that migrasome-associated genes in bladder cancer may also act through these mechanisms to promote tumor progression. However, further empirical validation is still required.
Few studies have directly explored the impact of migrasomes on tumors. Most studies have focused on exploring the effects of cytokines or proteins related to migrasomes on tumors. As an important protein for the formation of migrasomes, TSPAN4 is highly expressed in many cancers[26], which is not only associated with tumor progression but also immune infiltration[27].
Analysis of the TME further refined our understanding of high-risk phenotypes. The TME primarily consists of malignant cells, stromal cells and immune infiltrating cells[28,29]. By secreting specific signaling ligands, tumor cells can remodel the TME to establish an immune-tolerant state[30,31]. We found that the TME in high-risk patients was characterized by a stroma-rich immunosuppressive environment. As essential components within the TME, stromal cells have immunoregulatory properties and play important roles in regulating tumor progression and immune responses[32]. It has been demonstrated that stromal cells in the bladder cancer microenvironment dynamically regulate the development of heterogeneous tumor epithelial subpopulations. This process subsequently reshapes the TME, including the degree of immune cell recruitment and activation of various immune checkpoint markers, ultimately resulting in significant variability in patient response to immunotherapy treatments[33,34]. Recent reports have shown that stromal cells can support tumor angiogenesis in various tumors and help differentiate cancer-associated fibroblasts from soluble factors produced by cancer cells[35,36]. This promotes metastasis and growth of tumor cells, thereby increasing the aggressiveness of the tumor. Although the pro-tumorigenic phenotype of stromal cells has been well documented in recent years[37], there are also examples where specific subpopulations of stroma inhibit tumor growth through different mechanisms[38]. In our study, we found a higher content of more abundant stromal cells in the high-risk cohort than in the low-risk group, suggesting that in the context of bladder cancer, stromal cells probably contribute to tumor progression in a manner consistent with the abovementioned pro-tumorigenic model. This is consistent with the known role of stromal activation in promoting invasion and creating a physical barrier against immune cell infiltration. At the same time, CD8+ T cells enter the TME and become activated through interactions with macrophages, B cells, dendritic cells, and other antigen-presenting cells to regulate cytotoxic T cell activity[39]. In general, rapidly growing malignancies build an immunosuppressive TME that significantly hinders the antitumor function of effector immune cells, ultimately leading to synergistic enhancement of immune escape and malignant progression[40]. Our study showed no statistically significant differences in the ESTIMATE scores between the two risk subgroups. Nevertheless, the high-risk group showed a significantly higher extent of immune cell infiltration compared to the low-risk group, with M0 macrophages being particularly prominent. In contrast, CD8+ T cell infiltration was lower in the high-risk cohort than in the low-risk cohort. These findings highlight that tumor heterogeneity and the immune microenvironment should be taken into account when predicting treatment response. The combination of low TMB and this suppressive immune contexture may explain the poor clinical outcome reported for high-risk patients and suggests that these patients might better benefit from therapies targeting the stromal compartment or reverting immune suppression rather than ICB monotherapy[41,42].
Drug sensitivity analysis provides a translational perspective, suggesting that risk stratification by our model could inform therapeutic selection[43-45]. The identified differential sensitivity to agents such as nilotinib suggests potential vulnerabilities that may be therapeutically exploited in high-risk patients[46,47].
Although our study is the first to use migrasome-associated lncRNAs for bladder cancer prognostic prediction, there are still some limitations. Firstly, data were only obtained from a public database (TCGA), which may limit the novelty of the data source. Secondly, previous studies have mainly used computational biology methods for prediction analysis, and there is no experimental evidence based on in vitro or in vivo models to support the immune contexture and specific signaling pathways. Future research should be conducted with independent clinical cohorts for validation and functional experiments such as knocking down key lncRNAs in bladder cancer cell lines to confirm their roles in regulating migrasome formation, migration, and invasion[45,48,49]. To further address the limitations of this study, we acknowledge that additional validation through immunofluorescence co-localization of migrasome-related lncRNAs and CD8+ T cells is warranted. In addition, the prognostic significance of these lncRNAs and their characteristics should be validated using clinical bladder cancer tissue samples to improve the reliability and clinical relevance of the current results.
Conclusion
In conclusion, this study is the first systematic investigation of a migrasome-related lncRNA signature for predicting clinical outcomes in patients with bladder cancer. In addition to evaluating the immune cell landscape in bladder cancer, we compared treatment response between the two risk cohorts to identify more effective therapeutic strategies. Our findings extend beyond a bioinformatics signature by providing a new mechanistic framework based on migrasome biology that can be used to understand disease progression and guide prognosis, microenvironment regulation, and personalized therapy.
DECLARATION
Acknowledgements
The graphical abstract was created by the authors using original artwork and graphical elements adapted from Servier Medical Art (https://smart.servier.com/), licensed under CC BY 4.0 (https://creativecommons.org/licenses/by/4.0/).
Author contributions
Performed all the experiments, wrote the original draft, reviewed and edited the manuscript, and prepared the figures: Wu Y, Liang J, Sun R
Participated in the review and editing of the manuscript: Liang Y
Conceptualized and designed the study, wrote and reviewed the manuscript, and supervised the project: Li C, Zengin G, Li MY
All authors have read and approved the final manuscript.
Availability of data and materials
The data for this study came from TCGA-BRCA, and the processed expression matrix data are in the Supplementary Materials. All data used and/or generated in this study are available from the corresponding author upon reasonable request.
AI and AI-assisted tools statement
Not applicable.
Financial support and sponsorship
None.
Conflicts of interest
Li MY is a Junior Editorial Board of Journal of Translational Genetics and Genomics. Li MY was not involved in any steps of editorial processing, notably including reviewers’ selection, manuscript handling, or decision-making, while the other authors have declared that they have no conflicts of interest.
Ethical Approval and Consent to Participate
Not applicable.
Consent for publication
Not applicable.
Copyright
© The Author(s) 2026.
Supplementary Materials
REFERENCES
1. Van Hoogstraten LMC, Vrieling A, Van Der Heijden AG, Kogevinas M, Richters A, Kiemeney LA. Global trends in the epidemiology of bladder cancer: challenges for public health and clinical practice. Nat Rev Clin Oncol. 2023;20:287-304.
2. Terashima M, Nakayama K, Shirai S, et al. Diverging global incidence trends of early-onset cancers: comparisons with incidence trends of later-onset cancers and mortality trends of early-onset cancers. Military Med Res. 2025;12:79.
3. Liu B, Zhou H, Tan L, Siu KTH, Guan X. Exploring treatment options in cancer: tumor treatment strategies. Sig Transduct Target Ther. 2024;9:175.
4. Cuprych-Belter M, Łupicka-Słowik A, Anisiewicz A, Michaelis M, Cinatl Jr J, Psurski M. Distinct adaptive strategies to cisplatin, vinblastine and gemcitabine in a panel of chemoresistant bladder cancer cell lines. Cancer Drug Resist. 2025;8:49.
5. Liu M, Yang J, Xu B, Zhang X. Tumor metastasis: mechanistic insights and therapeutic interventions. MedComm. 2021;2:587-617.
6. Yu J, Yu L. A decade of migrasome research: biogenesis, physiological functions, and disease implications. Cell Res. 2025;35:629-41.
7. Tan Z, Yang C, Fu S, et al. Migrasomes, critical players in intercellular communication. Cancer Cell Int. 2025;25:113.
8. Jiao H, Yu L. Migrasomes: biogenesis, physiological roles, and therapeutic potentials. J Cell Biol. 2024;223:e202403051.
9. Jiao H, Li X, Li Y, et al. Localized, highly efficient secretion of signaling proteins by migrasomes. Cell Res. 2024;34:572-85.
10. Mattick JS, Amaral PP, Carninci P, et al. Long non-coding RNAs: definitions, functions, challenges and recommendations. Nat Rev Mol Cell Biol. 2023;24:430-47.
11. Wu Y, Chen Z, Lee J, Zengin G, Li MY. Circular RNAs: epigenetic puppeteers pulling the strings of cancer pathogenesis. Med Bull. 2026;2:124-36.
12. Si J, Liang C, Zhang X, et al. LINC00922: a critical oncogenic long non-coding RNA involved in cancer progression, chemotherapy resistance, and microRNA regulation. Med Adv. 2025;3:65-79.
13. Li X, Zhang Z, Liu M, et al. Establishment of a lncRNA-based prognostic gene signature associated with altered immune responses in HCC. Front Immunol. 2022;13:880288.
14. Jafari M, Guan Y, Wedge DC, Ansari-Pour N. Re-evaluating experimental validation in the Big Data Era: a conceptual argument. Genome Biol. 2021;22:71.
15. Ye B, Fan J, Xue L, et al. iMLGAM: integrated machine learning and genetic algorithm‐driven multiomics analysis for pan‐cancer immunotherapy response prediction. iMeta. 2025;4:e70011.
16. Mani K, Deng D, Lin C, Wang M, Hsu ML, Zaorsky NG. Causes of death among people living with metastatic cancer. Nat Commun. 2024;15:1519.
17. Ma L, Li Y, Peng J, et al. Discovery of the migrasome, an organelle mediating release of cytoplasmic contents during cell migration. Cell Res. 2014;25:24-38.
18. Shankar J, Nabi IR. Actin cytoskeleton regulation of epithelial mesenchymal transition in metastatic cancer cells. PLoS ONE. 2015;10:e0119954.
19. Zhang J, Cai H, Sun L, et al. LGR5, a novel functional glioma stem cell marker, promotes EMT by activating the Wnt/β-catenin pathway and predicts poor survival of glioma patients. J Exp Clin Cancer Res. 2018;37:225.
20. Meacham CE, Ho EE, Dubrovsky E, Gertler FB, Hemann MT. In vivo RNAi screening identifies regulators of actin dynamics as key determinants of lymphoma progression. Nat Genet. 2009;41:1133-7.
21. Biber G, Ben-Shmuel A, Sabag B, Barda-Saad M. Actin regulators in cancer progression and metastases: from structure and function to cytoskeletal dynamics. Int Rev Cell Mol Biol. 2020;356:131-96.
22. Iwaya K, Norio K, Mukai K. Coexpression of Arp2 and WAVE2 predicts poor outcome in invasive breast carcinoma. Mod Pathol. 2007;20:339-43.
23. Murphy JM, Rodriguez YAR, Jeong K, Ahn EE, Lim SS. Targeting focal adhesion kinase in cancer cells and the tumor microenvironment. Exp Mol Med. 2020;52:877-86.
24. Wang C, Zhang S, Liu J, et al. Secreted pyruvate kinase M2 promotes lung cancer metastasis through activating the integrin beta1/FAK signaling pathway. Cell Rep. 2020;30:1780-97.e6.
25. Chen J, Huang X, Wang Q, et al. FAK is involved in invasion and metastasis of hepatocellular carcinoma. Clin Exp Metastasis. 2010;27:71-82.
26. Jiang D, Jiang Z, Lu D, et al. Migrasomes provide regional cues for organ morphogenesis during zebrafish gastrulation. Nat Cell Biol. 2019;21:966-77.
27. Zheng Y, Lang Y, Qi B, Wang Y, Gao W, Li T. TSPAN4 is a prognostic and immune target in Glioblastoma multiforme. Front Mol Biosci. 2023;9:1030057.
28. Li Q, Teitz-Tennenbaum S, Donald EJ, Li M, Chang AE. In vivo sensitized and in vitro activated B cells mediate tumor regression in cancer adoptive immunotherapy. J Immunol. 2009;183:3195-203.
30. Wu W, Wang X, Le W, et al. Immune microenvironment infiltration landscape and immune-related subtypes in prostate cancer. Front Immunol. 2023;13:1001297.
31. Liu Q, Dong Z, Wang Y, Jin W. Reprogramming neural-tumor crosstalk: emerging therapeutic dimensions and targeting strategies. Military Med Res. 2025;12:73.
32. Naji A, Eitoku M, Favier B, Deschaseaux F, Rouas-Freiss N, Suganuma N. Biological functions of mesenchymal stem cells and clinical implications. Cell Mol Life Sci. 2019;76:3323-48.
33. Lavallee E, Sfakianos JP, Mulholland DJ. Tumor heterogeneity and consequences for bladder cancer treatment. Cancers. 2021;13:5297.
34. Singh SB, Bhandari S, Siwakoti S, et al. PET/CT in the evaluation of CAR-T cell immunotherapy in hematological malignancies. Mol Imaging. 2024;23:15353508241257924.
35. Zhao Y, Shen M, Wu L, et al. Stromal cells in the tumor microenvironment: accomplices of tumor progression? Cell Death Dis. 2023;14:587.
36. Zhou T, Yan H, Deng Y, et al. The role of long non‐coding RNA maternally expressed gene 3 in cancer‐associated fibroblasts at single cell pan‐cancer level. Interdiscip Med. 2024;2:e20240018.
37. Galland S, Stamenkovic I. Mesenchymal stromal cells in cancer: a review of their immunomodulatory functions and dual effects on tumor progression. J Pathol. 2019;250:555-72.
38. Fathi E, Sanaat Z, Farahzadi R. Mesenchymal stem cells in acute myeloid leukemia: a focus on mechanisms involved and therapeutic concepts. Blood Res. 2019;54:165-74.
39. Kumar S, Singh SK, Rana B, Rana A. Tumor-infiltrating CD8+ T cell antitumor efficacy and exhaustion: molecular insights. Drug Discov Today. 2021;26:951-67.
40. Shukla S, Wang C, Beiss V, Steinmetz NF. Antibody response against cowpea mosaic viral nanoparticles improves in situ vaccine efficacy in ovarian cancer. ACS Nano. 2020;14:2994-3003.
41. Zhang L, Zhao L, Lin X, et al. Comparison of tumor non-specific and PD-L1 specific imaging by near-infrared fluorescence/cerenkov luminescence dual-modality in-situ imaging. Mol Imaging. 2024;23:15353508241261473.
42. Li AQ, Fang JH. Anti‐angiogenic therapy enhances cancer immunotherapy: mechanism and clinical application. Interdiscip Med. 2024;2:e20230025.
43. Luo Y, He X, Du Q, et al. Metal‐based smart nanosystems in cancer immunotherapy. Exploration. 2024;4:20230134.
44. Wang J, Liao Z. Research progress of microrobots in tumor drug delivery. Food Med Homol. 2024;1:9420025.
45. Wan G, Huang JD, Xu RH, Jin M. Advances and challenges in pluripotent stem cell‐based whole‐cell vaccines for cancer treatment. Med Bull. 2025;1:60-76.
46. Wu Y, Liang J, Liang Y, Zengin G, Miao H, Li M. Unveiling the frontiers of self-assembled chinese herbal medicines nanodrugs in cancer therapy: a comprehensive bibliometric analysis and insights into emerging vesicle-based strategies. Nano TransMed. 2026;5:100115.
47. Sharma R, Malviya R. Modifying the electrical, optical, and magnetic properties of cancer cells: A comprehensive approach for cancer management. Med Adv. 2024;2:3-19.
48. Song S, Liu Z, Wang Y, Gong B. Human organoids and their application in tumor models, disease modeling, and tissue engineering. Med Bull. 2025;1:17-36.
Cite This Article
How to Cite
Download Citation
Export Citation File:
Type of Import
Tips on Downloading Citation
Citation Manager File Format
Type of Import
Direct Import: When the Direct Import option is selected (the default state), a dialogue box will give you the option to Save or Open the downloaded citation data. Choosing Open will either launch your citation manager or give you a choice of applications with which to use the metadata. The Save option saves the file locally for later use.
Indirect Import: When the Indirect Import option is selected, the metadata is displayed and may be copied and pasted as needed.
About This Article
Copyright

Data & Comments
Data
0


Comments
Comments must be written in English. Spam, offensive content, impersonation, and private information will not be permitted. If any comment is reported and identified as inappropriate content by OAE staff, the comment will be removed without notice. If you have any queries or need any help, please contact us at [email protected].