


fig4
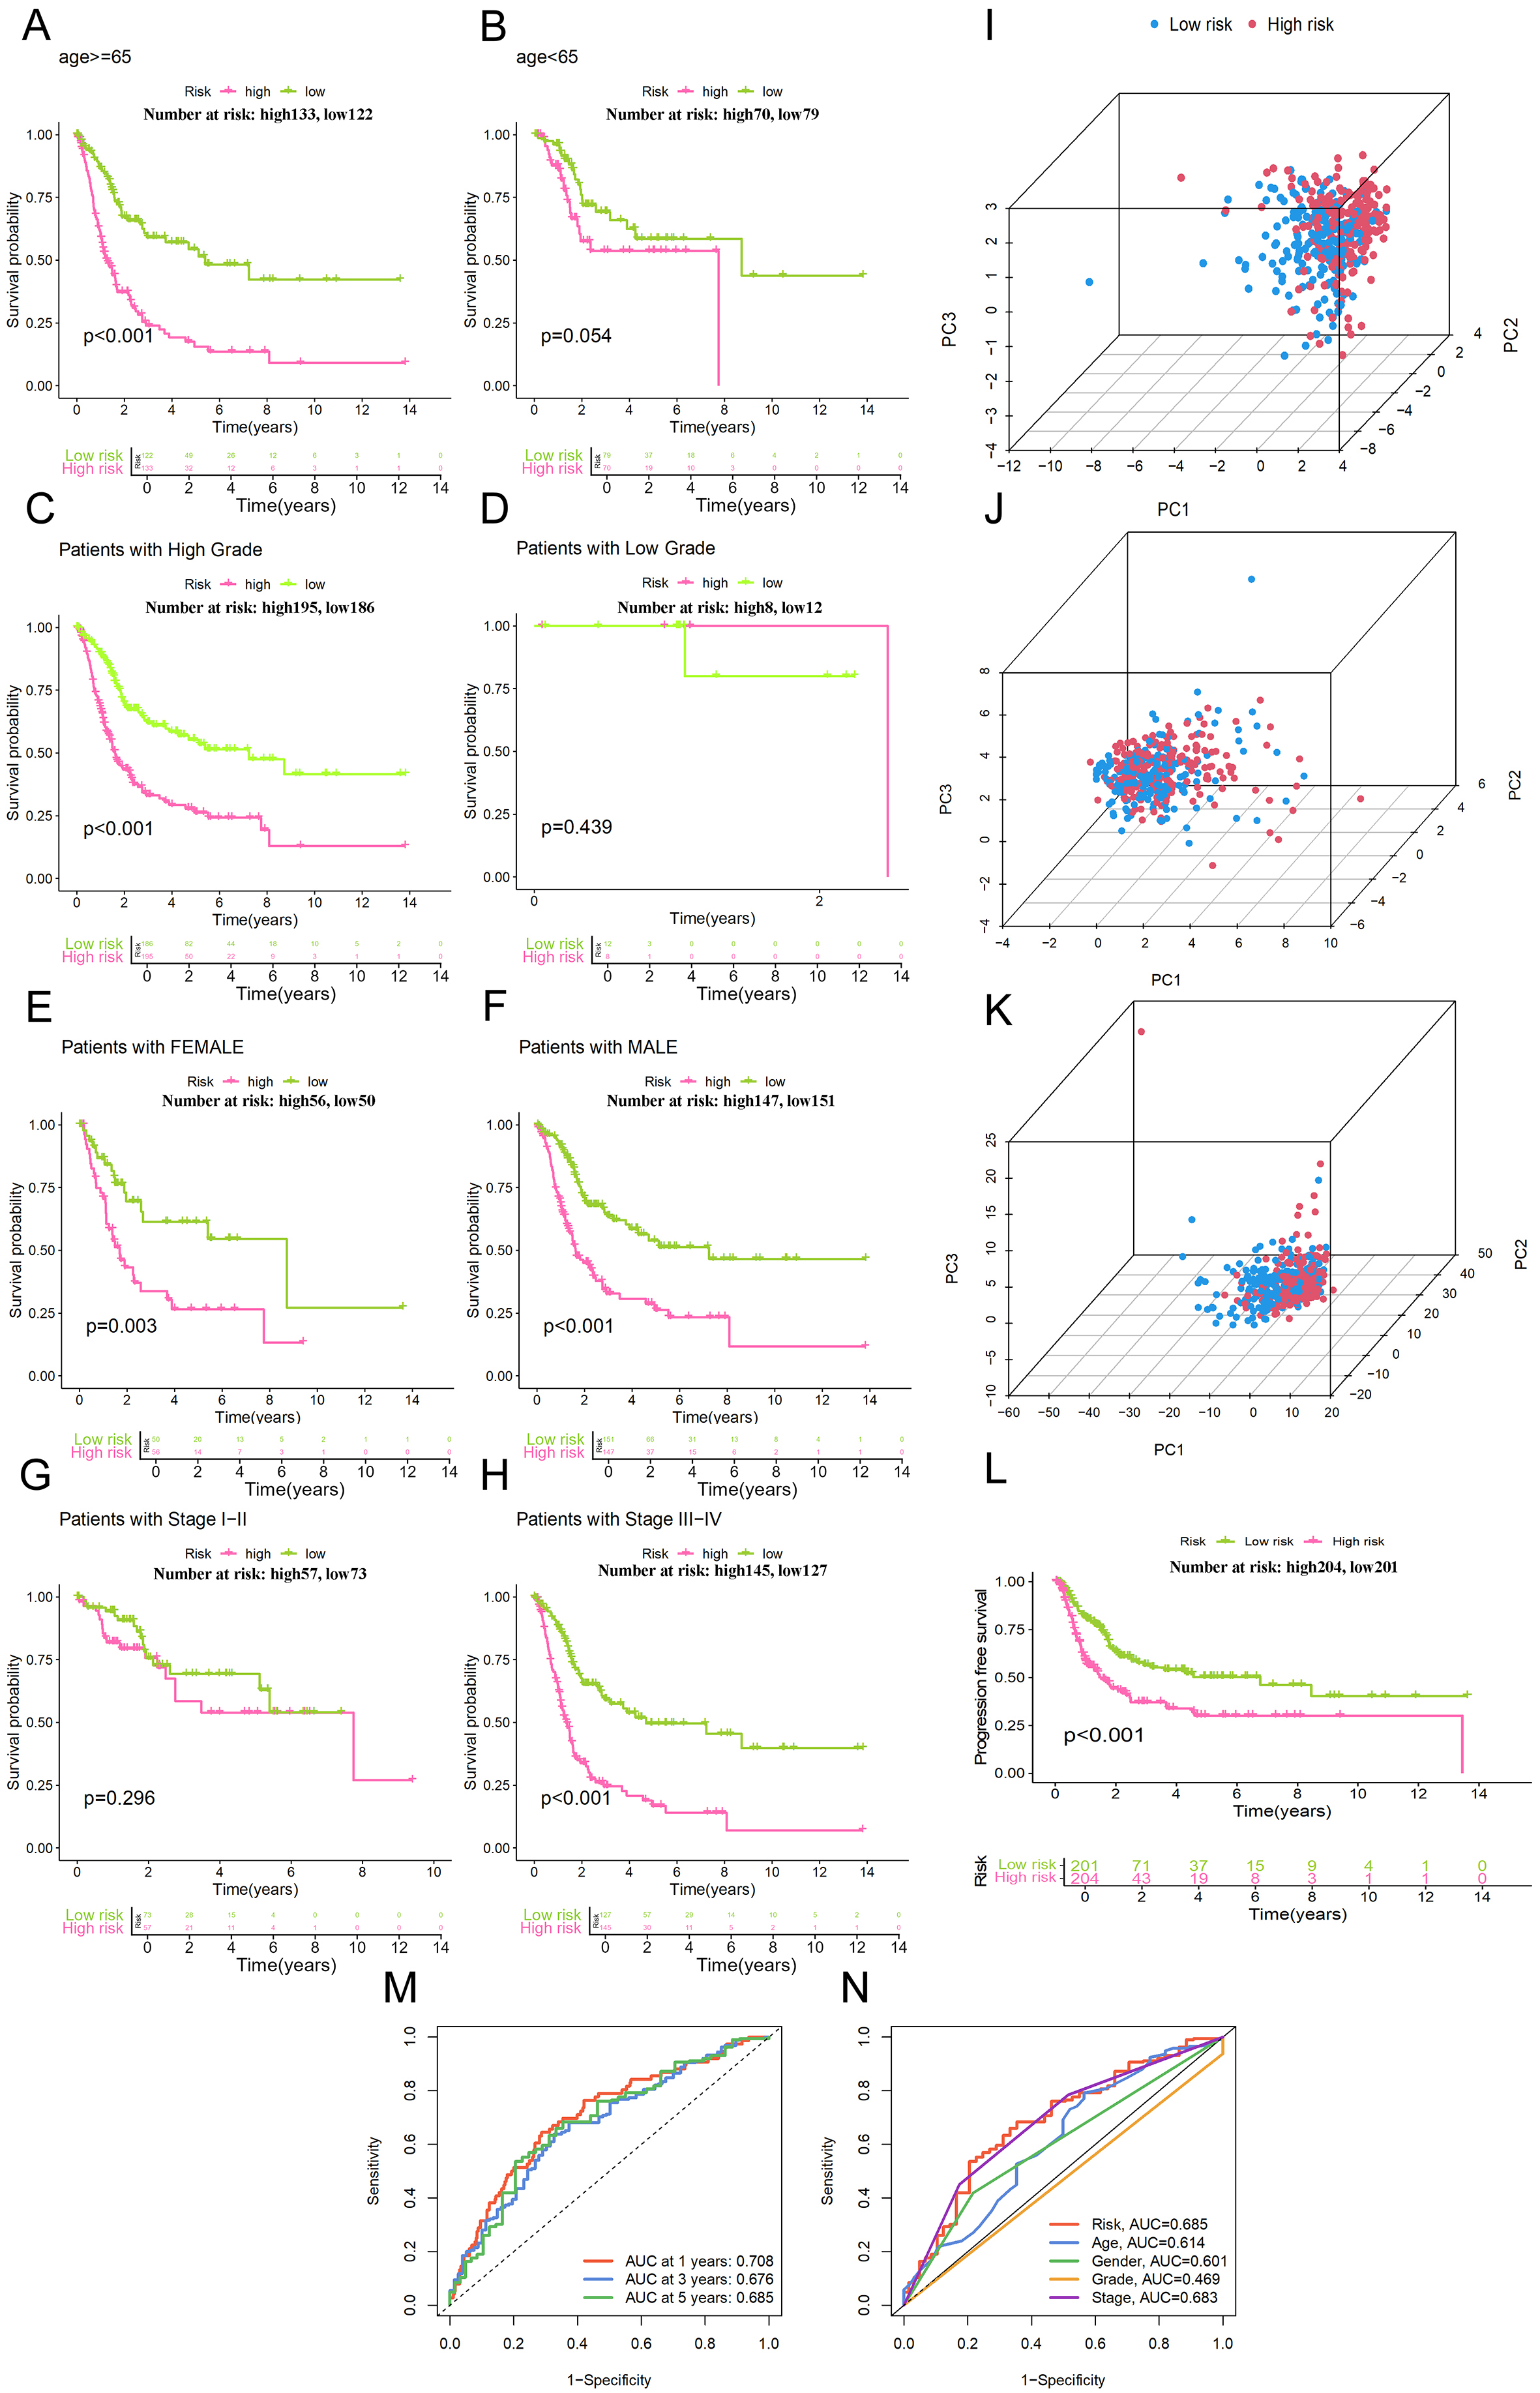
Figure 4. Subgroup survival analysis and PCA. (A and B) Stratified survival analysis using Kaplan-Meier curves for high- and low-risk cohorts divided by age; (C and D) Comparison of Kaplan-Meier survival outcomes between high-risk and low-risk participants based on tumor grade; (E and F) Evaluation of survival probabilities for different risk groups via Kaplan-Meier plots, categorized by patient gender; (G and H) Kaplan-Meier estimates showing survival differences for high-risk vs. low-risk cases across distinct pathological stages; (I) PCA of risk lncRNA. (J) PCA of migrasome genes. (K) PCA of migrasome lncRNA; (L) Survival curve of PFS (Progression-Free Survival) analysis; (M) Assessment of the risk model's performance through time-dependent ROC analysis for bladder cancer at intervals of 1, 3, and 5 years; (N) Relative predictive performance of the risk-scoring system in comparison with various clinicopathological traits.


