


fig6
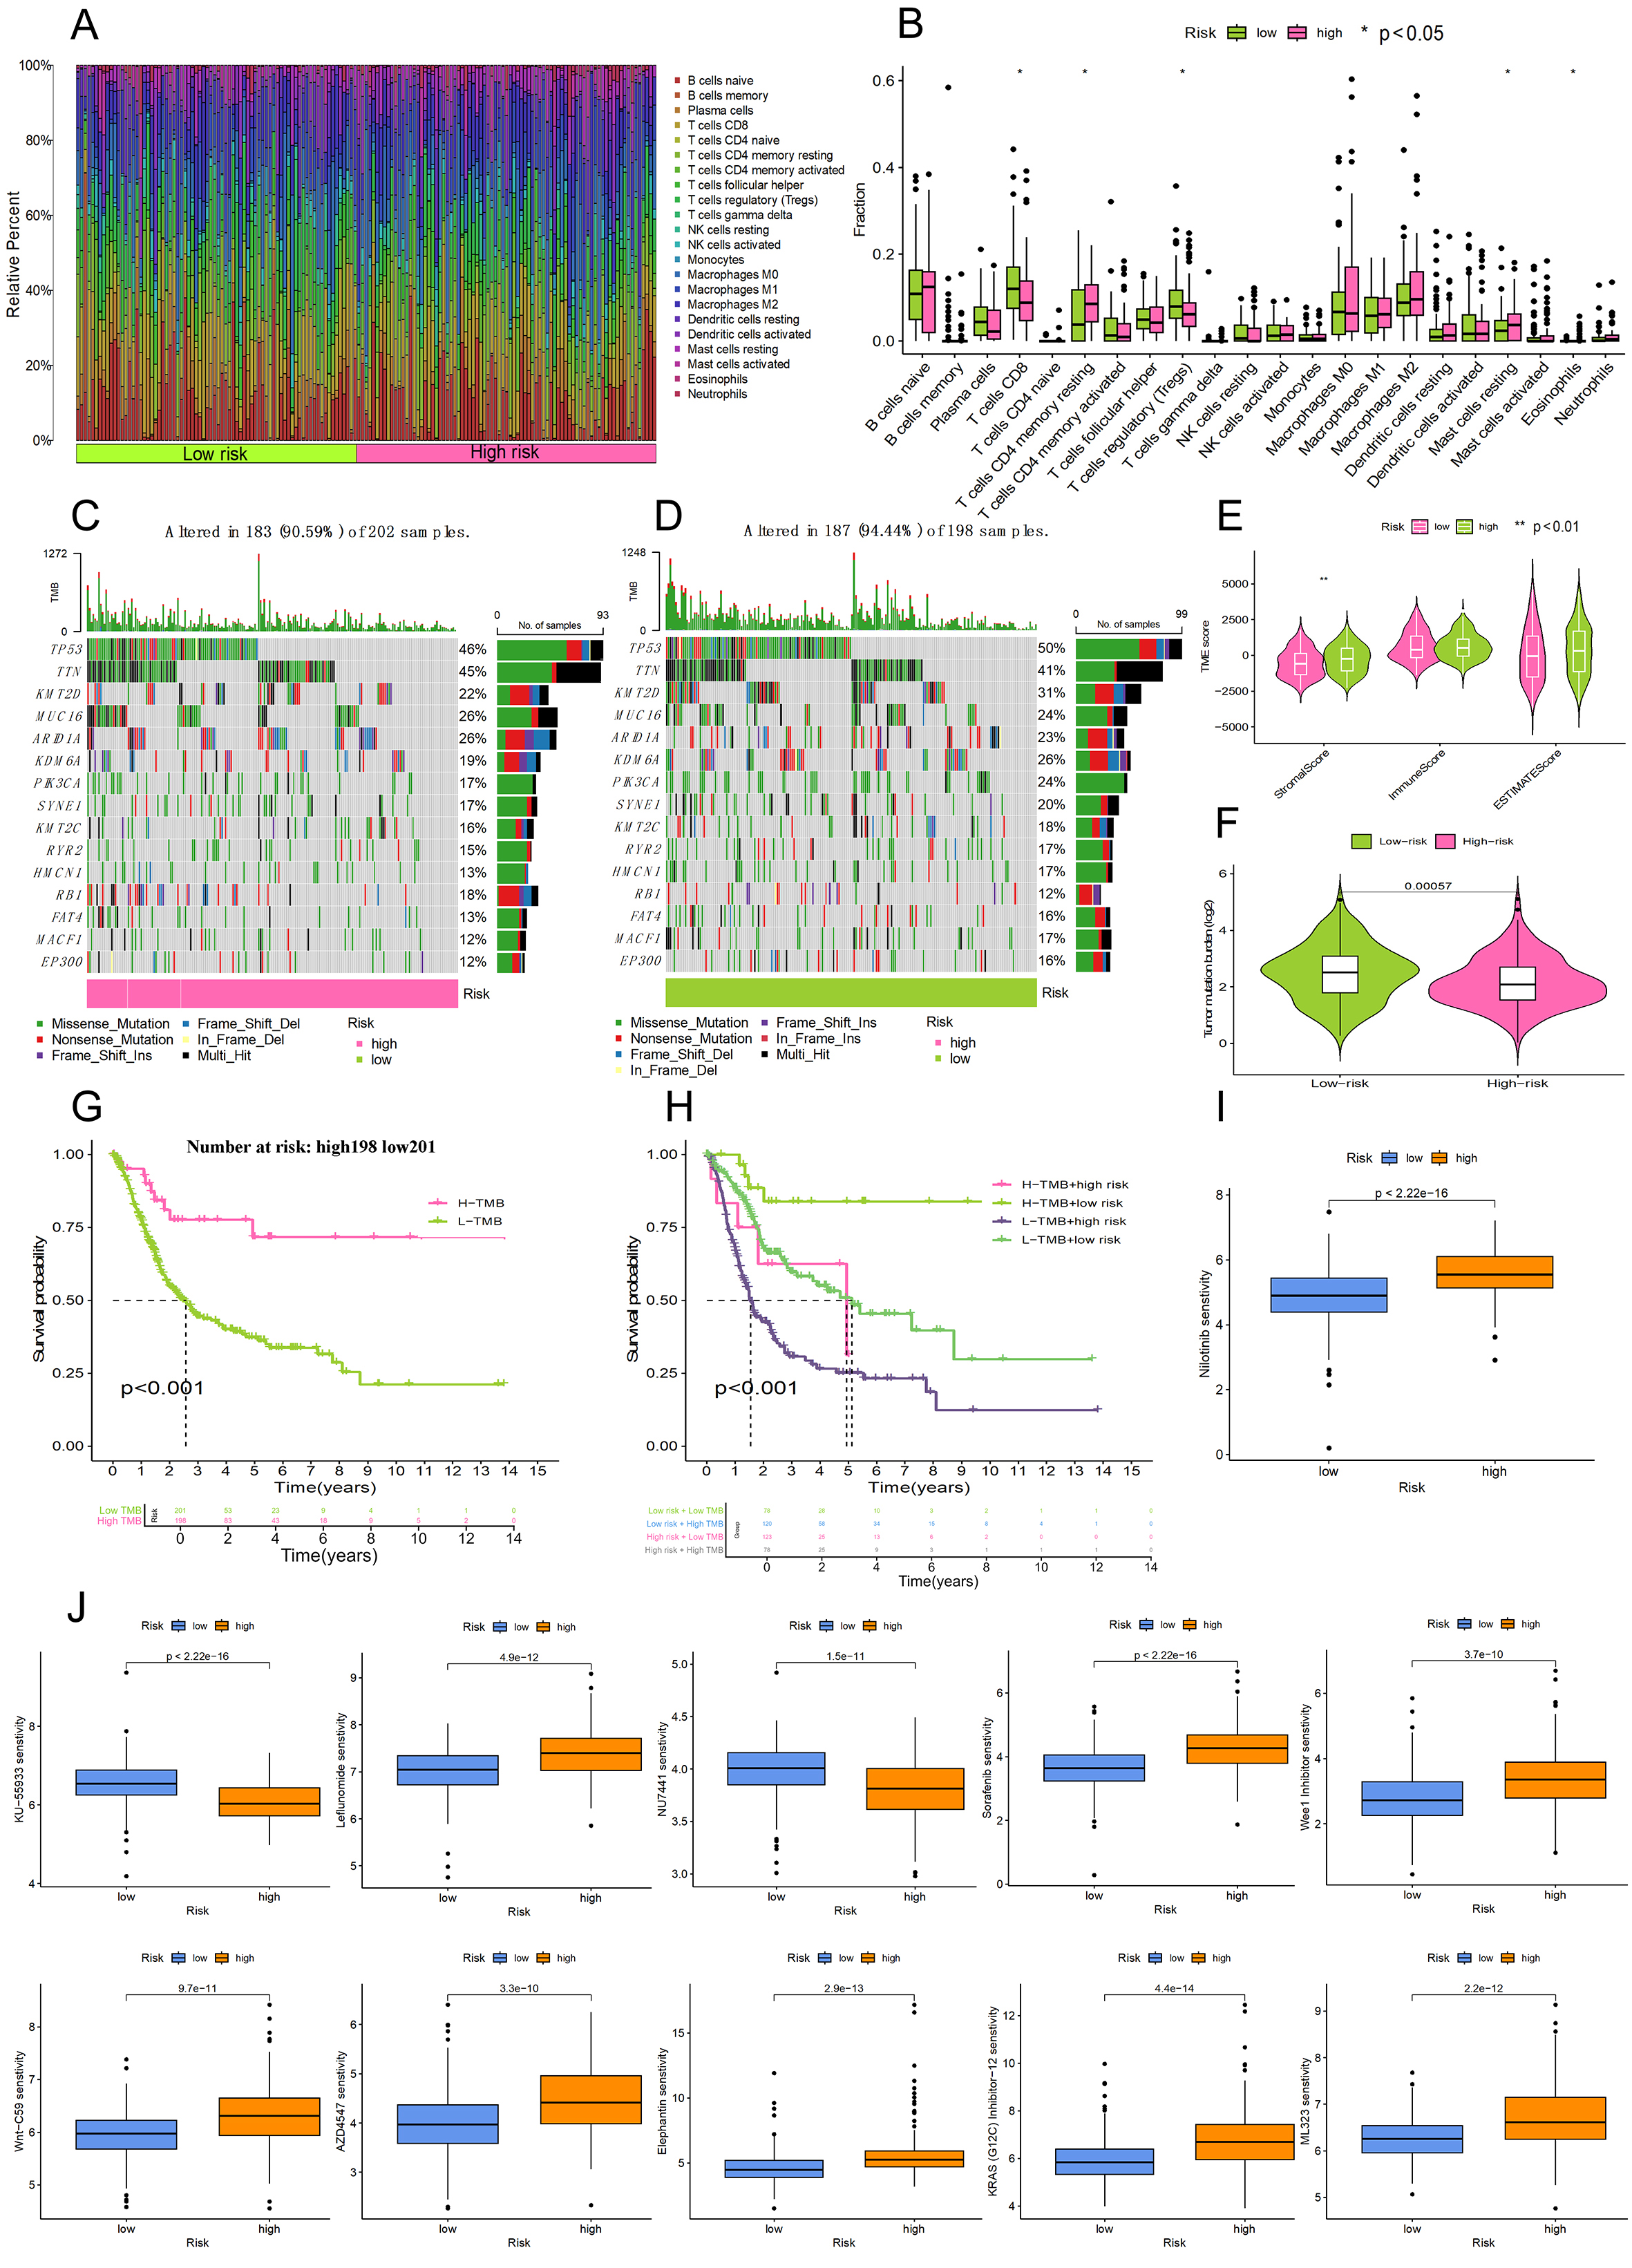
Figure 6. Analysis of the tumor microenvironment, mutational burden, and drug sensitivity. (A) Proportional distribution of various immune cell types within the bladder cancer cohort; (B) Comparison of infiltrating immune cell levels between the high-risk and low-risk categories; (C and D) Genomic landscape of somatic mutations presented via waterfall diagrams for both risk subgroups; (E) Violin plots illustrating variations in ImmuneScore, StromalScore, and ESTIMATEScore across the risk cohorts; (F) Comparative analysis of tumor mutational load (TMB) between the high-risk and low-risk participants; (G) Influence of TMB levels on the overall survival of bladder cancer patients using Kaplan-Meier modeling; (H) Survival curves for patients stratified by the combined evaluation of risk scores and TMB status; (I) Drug sensitivity (Nilotinib). A lower IC50 value (Vertical axis) signifies higher drug sensitivity; (J) Drug sensitivity (other drugs).


