


fig1
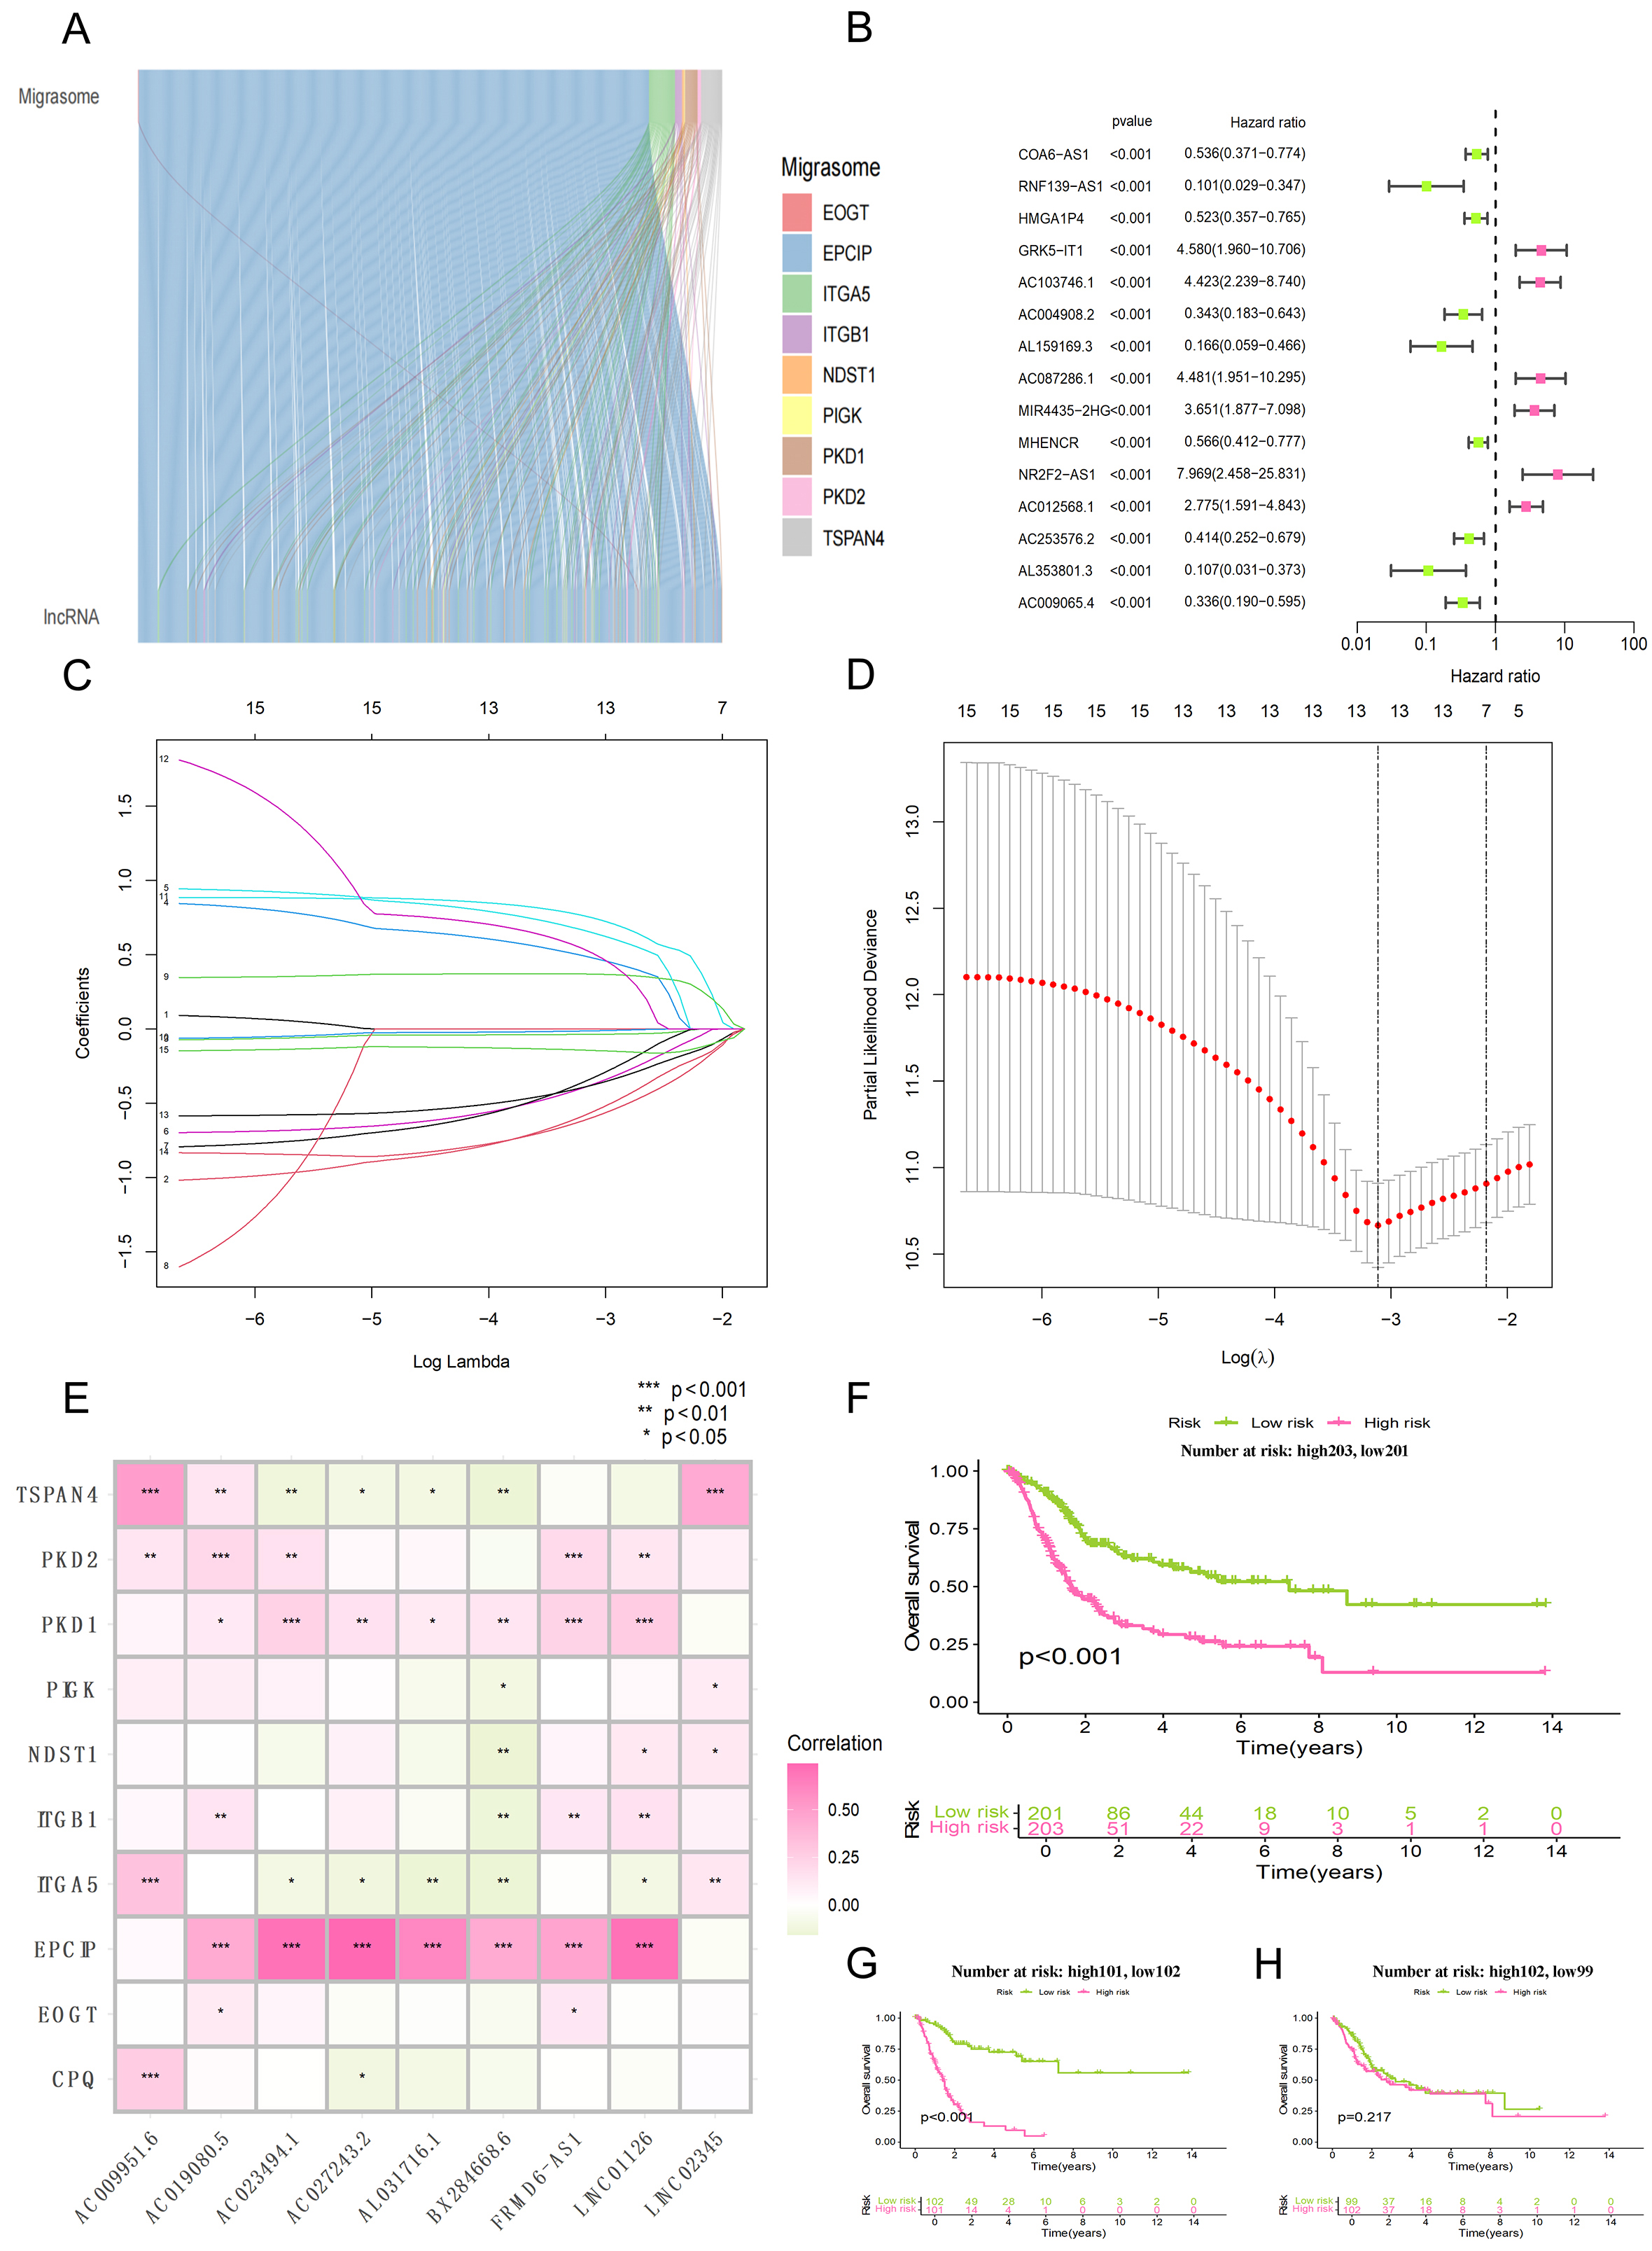
Figure 1. Screening of migrasome-associated lncRNA and construction of prognostic model. (A) Sankey diagram illustrating the regulatory associations between core migrasome genes and their co-expressed lncRNAs; (B) Forest plot displaying the results of the univariate Cox regression analysis for the candidate lncRNAs; (C) Distribution of LASSO coefficients for the migrasome-associated lncRNAs (presenting only the top 15 entries with the lowest p-values); (D) Determination of the optimal tuning parameter (lambda) within the LASSO Cox regression framework via 10-fold cross-validation; (E) Correlation heatmap depicting the associations between specific migrasome genes and the related lncRNAs used in the model; (F) Kaplan-Meier analysis comparing survival outcomes between the high-risk and low-risk subgroups within the entire study cohort; (G) Kaplan-Meier curves illustrating the survival disparities between risk categories within the training dataset; (H) Kaplan-Meier survival assessment for high-risk vs. low-risk patients in the independent testing dataset.


