


fig5
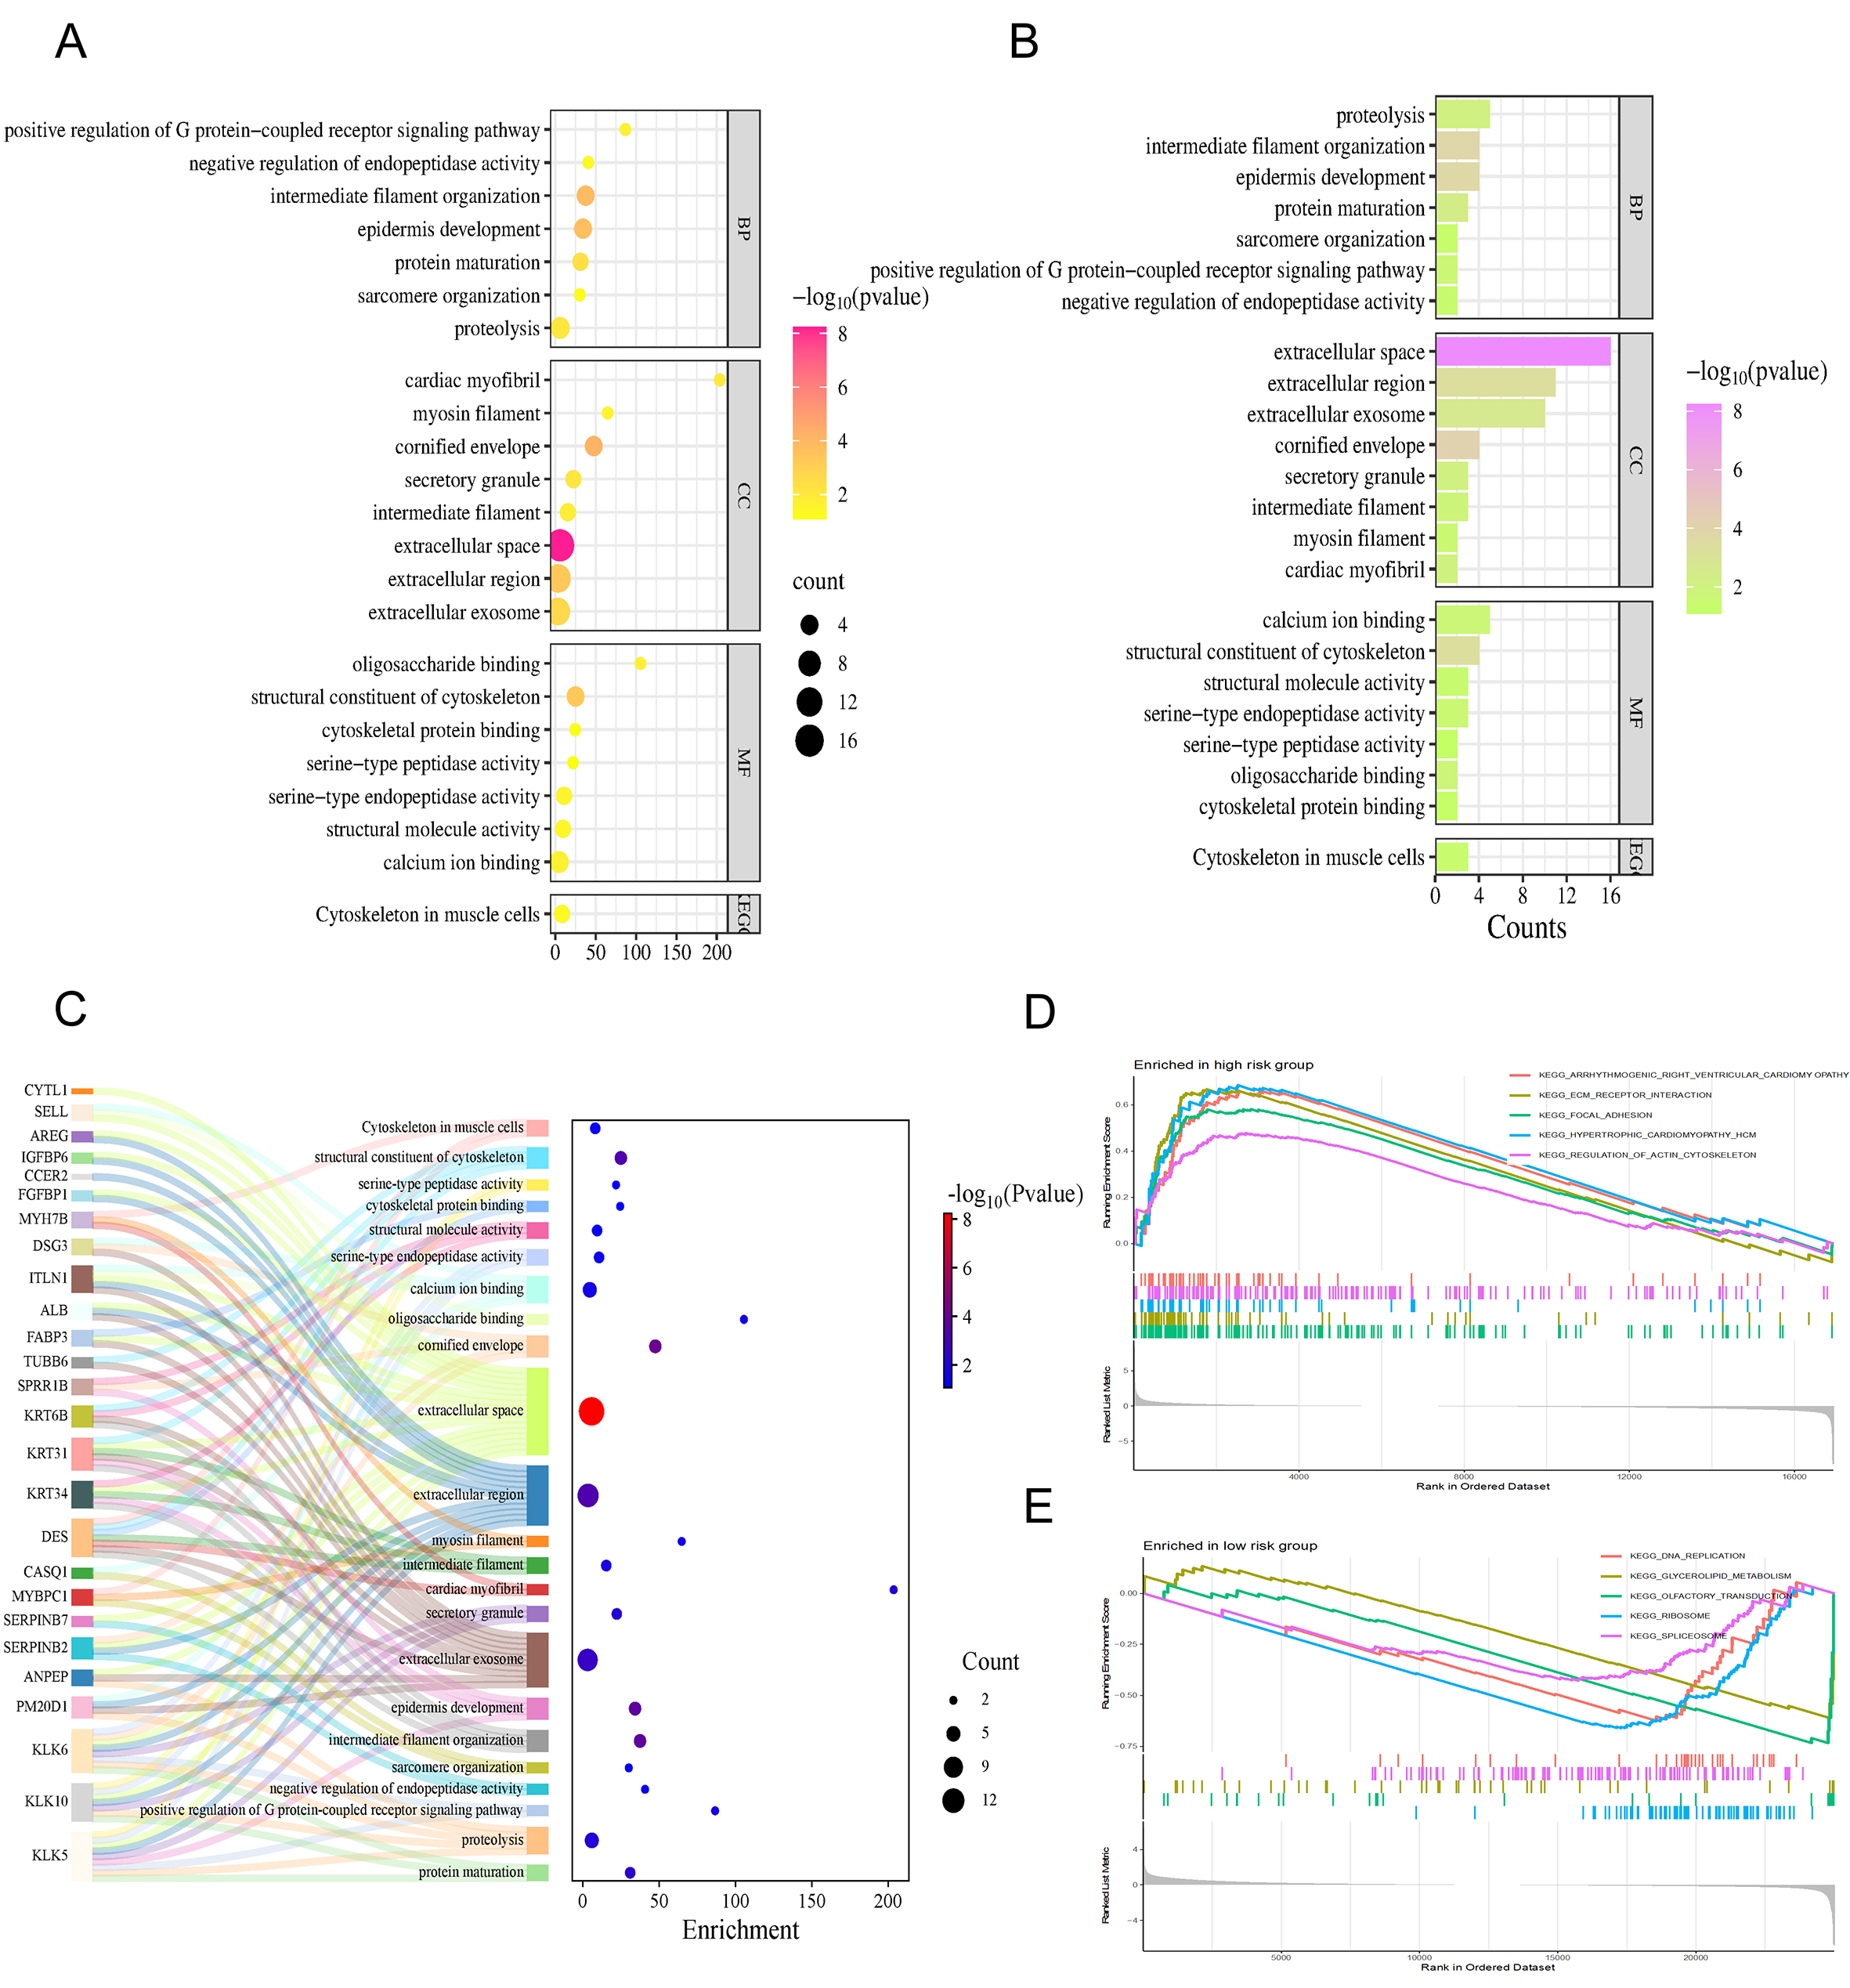
Figure 5. Functional enrichment analysis and pathway differences. (A) Outcomes from the GO and KEGG functional enrichment, where the horizontal axis represents the Enrichment Score; (B) Pathway profiles from GO and KEGG analyses, with the x-axis indicating the number of genes (Counts); (C) Sankey diagram demonstrates the genes involved in the pathways; (D) GSEA-based enrichment findings for high-risk patients utilizing the KEGG signaling pathway library; (E) Results of the GSEA analysis identifying active pathways within the low-risk subgroup derived from the KEGG repository.


