



Alterations in the serum lipid profile predict incident diabetes in obese individuals
 0
0 
Abstract
Aim: This study used lipidomic analysis to investigate how lipids and related metabolites are associated with insulin sensitivity and type 2 diabetes mellitus (T2DM) in the context of obesity.
Methods: A descriptive cross-sectional study recruited 73 obese participants, dividing them into three diagnostic categories: (1) obesity with metabolic health (n = 24, OB group), (2) obesity with impaired glucose tolerance (n = 24, IGT group), and (3) obesity-related diabetes (n = 25, OD group). In addition, lean, metabolically healthy individuals were included as normal controls (n = 23, NC group). Blood samples were collected and analyzed for untargeted lipidomics.
Results: The OB, IGT and OD groups showed a notable rise in homeostasis model assessment (HOMA) of insulin resistance compared to the NC group (all P < 0.05). The OD group exhibited higher levels of fasting blood glucose, glycated hemoglobin, total cholesterol, triglycerides, and low-density lipoprotein cholesterol than the other three groups, with a significant decrease in steady state beta cell function (HOMA-β%). Saturated fatty acids were found at higher levels in the diacylglycerol (DG), phosphatidylcholine (PC), lysophosphatidylcholine (LPC) and triacylglycerol (TG) classes in both IGT and OD groups. Significant increases in disrupted TG remodeling were observed from IGT to diabetes. Receiver operating characteristic analysis indicated that the lipid species LPC (16:0), ceramide (t33:7), and lysophosphatidylethanolamine (O-19:0) have strong diagnostic capabilities for T2DM.
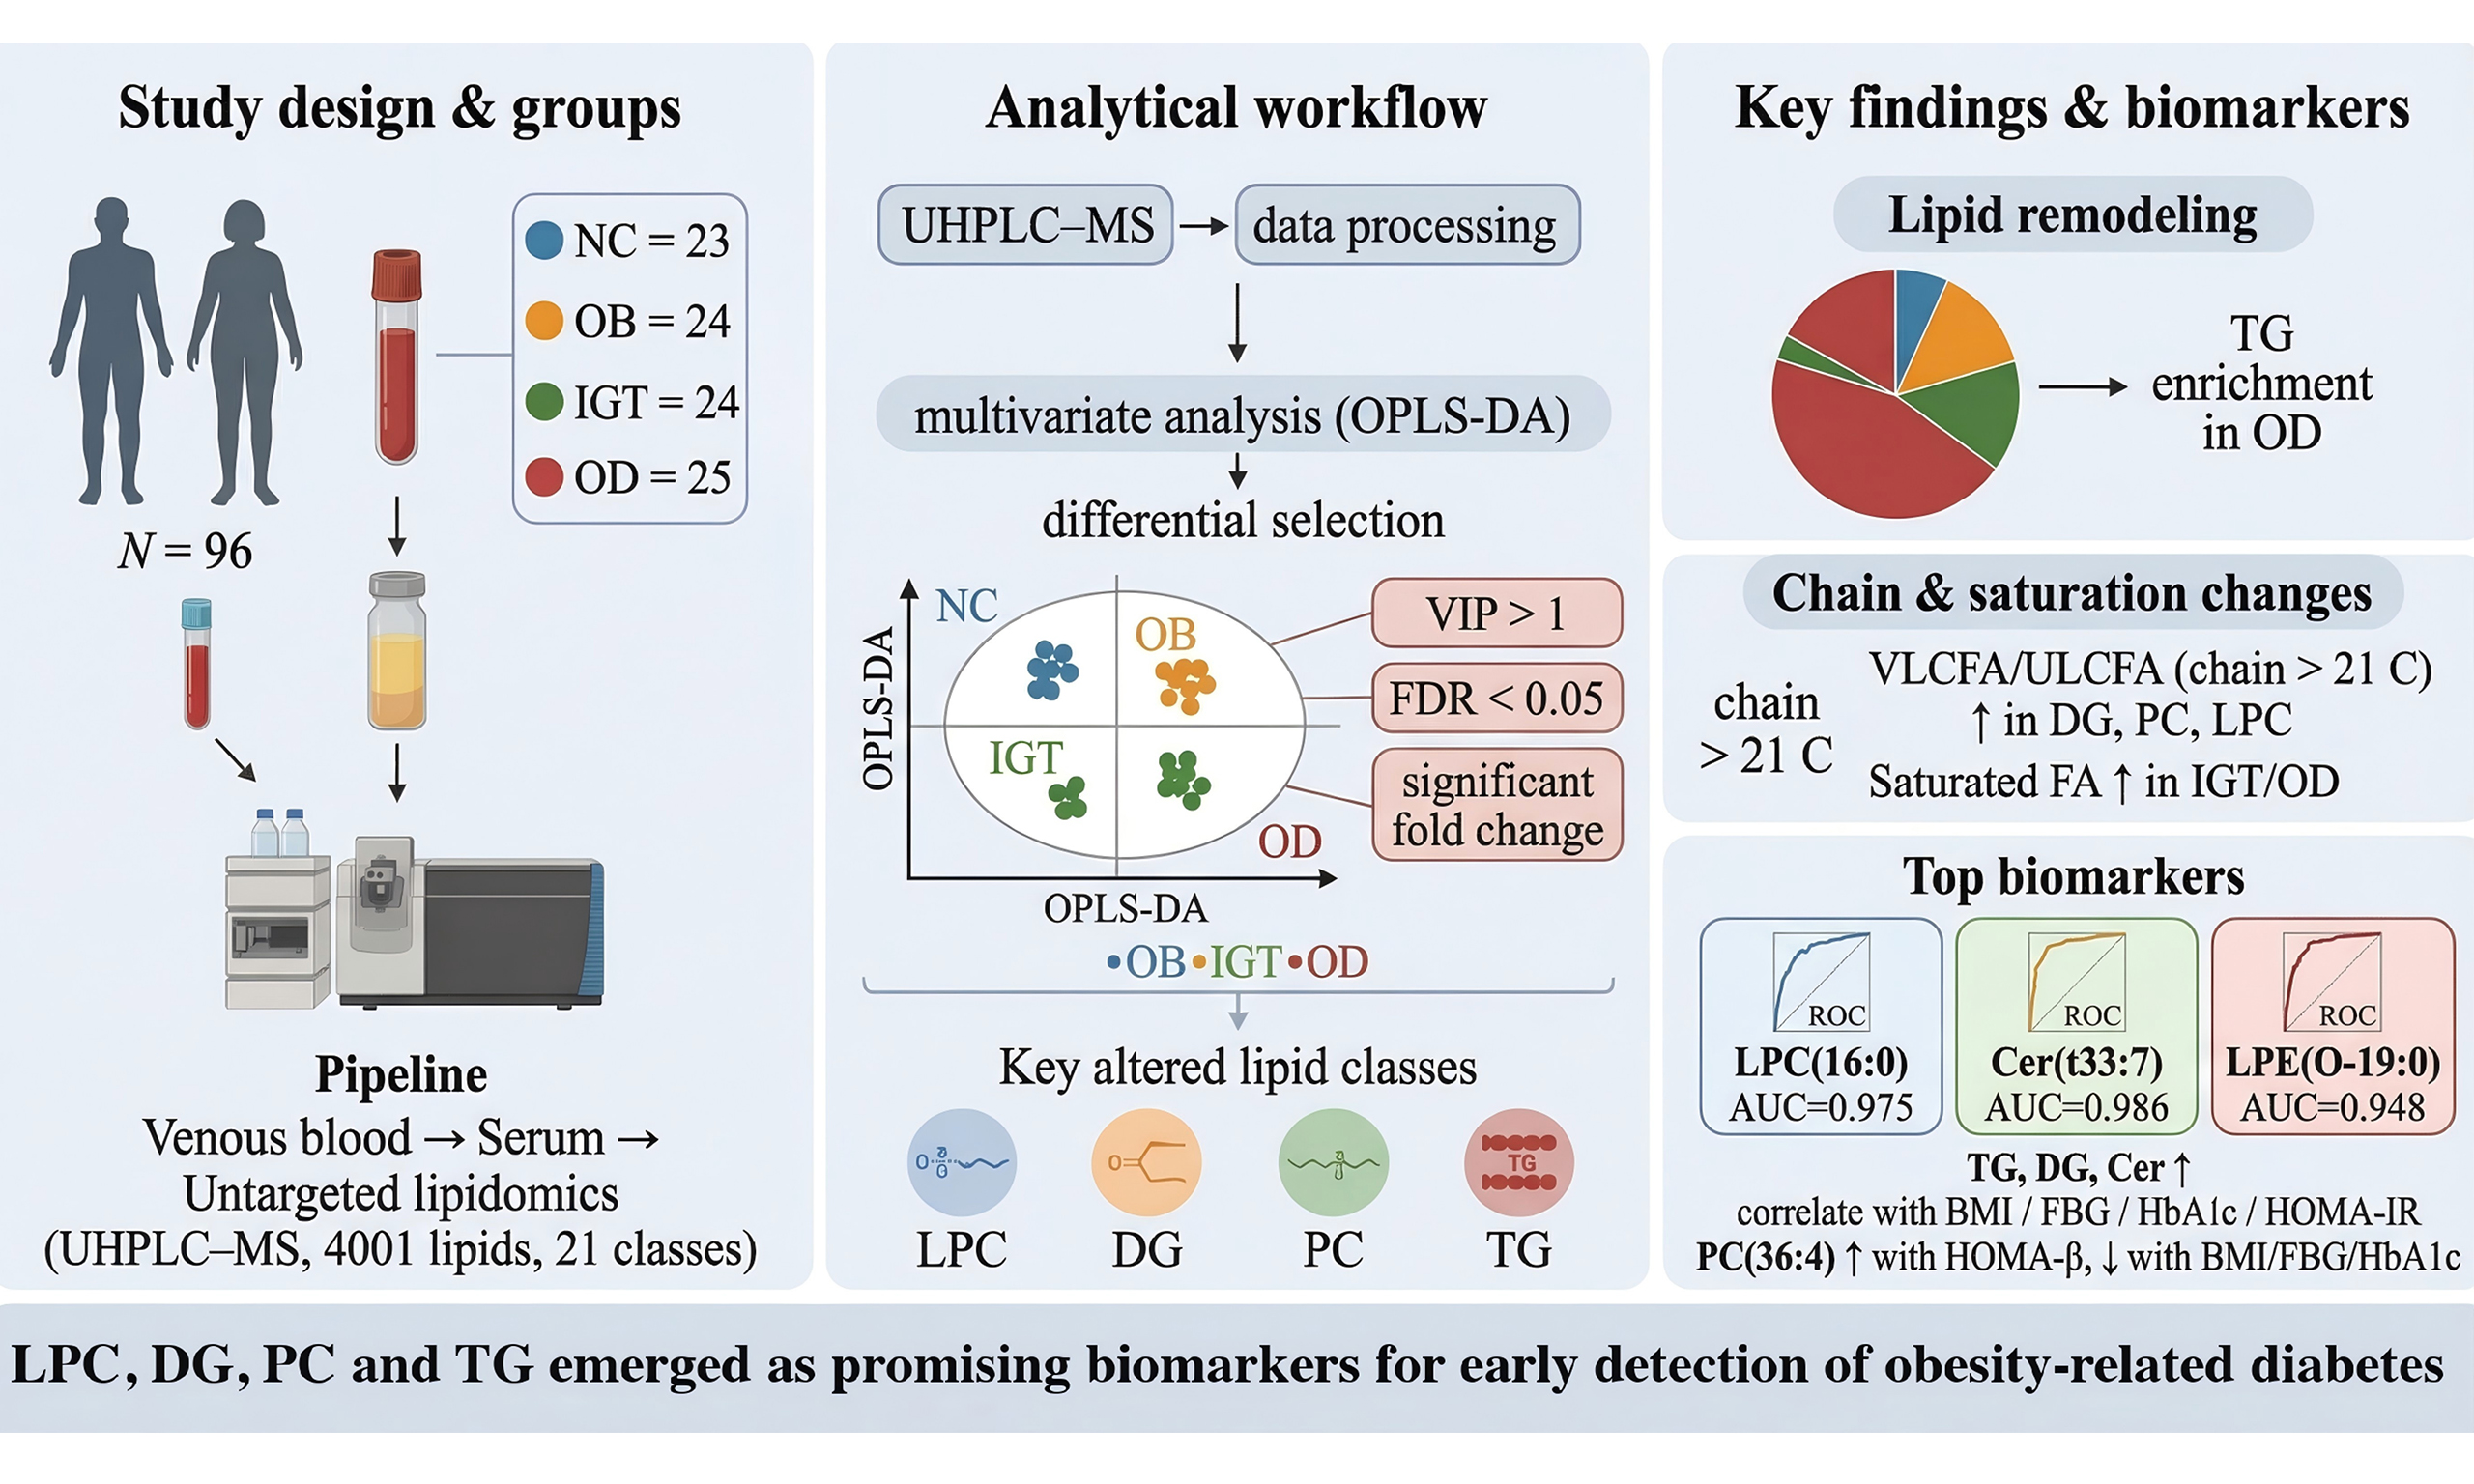
Conclusion: This lipidomic analysis in a Chinese cohort reveals distinct serum lipid alterations associated with insulin resistance and T2DM in obesity. Several lipid species, particularly LPC, DG, PC and TG, emerged as promising biomarkers for early detection of OD.
Keywords
INTRODUCTION
The global rise in obesity has become a critical public health challenge, largely because of its increasing prevalence and its strong association with comorbidities that diminish both quality of life and life expectancy[1]. Defined as “abnormal or excessive fat accumulation posing health risks”, obesity has reached epidemic proportions worldwide. One of its most significant complications is the disruption of glucose metabolism, which contributes to the frequent coexistence of obesity and type 2 diabetes mellitus (T2DM), a condition commonly referred to as “diabesity” or “obesity-dependent diabetes”[2].
Substantial evidence indicates that impaired lipid homeostasis is a key factor linking obesity to disturbances in glucose regulation. Dysregulated lipid metabolism can trigger β-cell dysfunction, insulin resistance, and chronic low-grade inflammation, all of which contribute to metabolic impairment[3-5]. In obesity, aberrant lipid remodeling disrupts the balance of fatty acids that circulate primarily within lipoprotein complexes composed of phospholipids, triglycerides (TG), and cholesterol. Elevated plasma concentrations of free fatty acids (FFAs) and TG are consistently associated with reduced insulin sensitivity in humans[6-8]. In addition, specific lysophosphatidylcholine (LPC) species are known to activate inflammatory signaling cascades that promote cytokine production, thereby further exacerbating insulin resistance[9-11].
Advances in lipidomics have enabled quantitative and qualitative profiling of diverse lipid species within biological samples, providing detailed insights into lipid metabolism across physiological and pathological states. Obesity-associated lipid biomarkers have been identified primarily within the glycerophospholipid, glycerolipid, and sphingolipid classes[12-15]. Current evidence indicates that the accumulation of bioactive lipids in adipose tissue plays a pivotal role in the development of insulin resistance. In particular, obese individuals exhibit elevated levels of ceramides (Cer), diacylglycerols (DG), and long-chain acyl-CoAs (acyl coenzyme A) in subcutaneous adipose tissue compared with lean individuals[16]. These bioactive lipid intermediates modulate key enzymes involved in insulin signaling, thereby influencing metabolic homeostasis[17-19].
Plasma lipid metabolites have been associated with the future onset of T2DM in both normoglycemic and dysglycemic individuals, including those with impaired fasting glucose and/or impaired glucose tolerance (IGT)[13,20]. However, the specific lipid alterations that drive obesity-associated glucose intolerance remain insufficiently characterized. Elucidating these lipid signatures in obese individuals with IGT is therefore crucial for clarifying the mechanistic link between lipid dysregulation and progression toward T2DM.
To address this gap, we conducted a comprehensive lipidomic analysis of blood samples collected from normal-weight individuals, metabolically healthy obese subjects, and obese individuals with either IGT or T2DM. Using an untargeted lipidomic approach based on ultra-high-performance liquid chromatography-mass spectrometry (UHPLC-MS), we identified major shifts in serum lipid profiles across the three populations. These findings offer mechanistic insight into how alterations in the circulating lipidome contribute to obesity-related glycometabolic dysregulation and may inform the development of more effective clinical strategies for preventing and managing obesity and T2DM.
METHODS
Ethics statement
This study was reviewed and approved by the Institutional Review and Ethics Board at Tongren Hospital, associated with Shanghai Jiao Tong University, with the approval number 2022-049-01, dated 22 June 2023. All participants provided written informed consent to participate in the study and for their data to be published. The research was carried out following the ethical principles of the Declaration of Helsinki and national regulatory standards.
Study design and participants
Participants of both sexes, aged 30-55 years, were recruited in a descriptive cross-sectional study design [Figure 1]. Obesity was defined as having a body mass index (BMI) of 28 kg/m2 or higher. Participants were stratified into three groups: metabolically healthy obesity (OB, age 38.00 ± 6.26 years), obesity with IGT (age 41.46 ± 13.06 years), and obesity-associated diabetes (OD, age 40.40 ± 6.74 years).
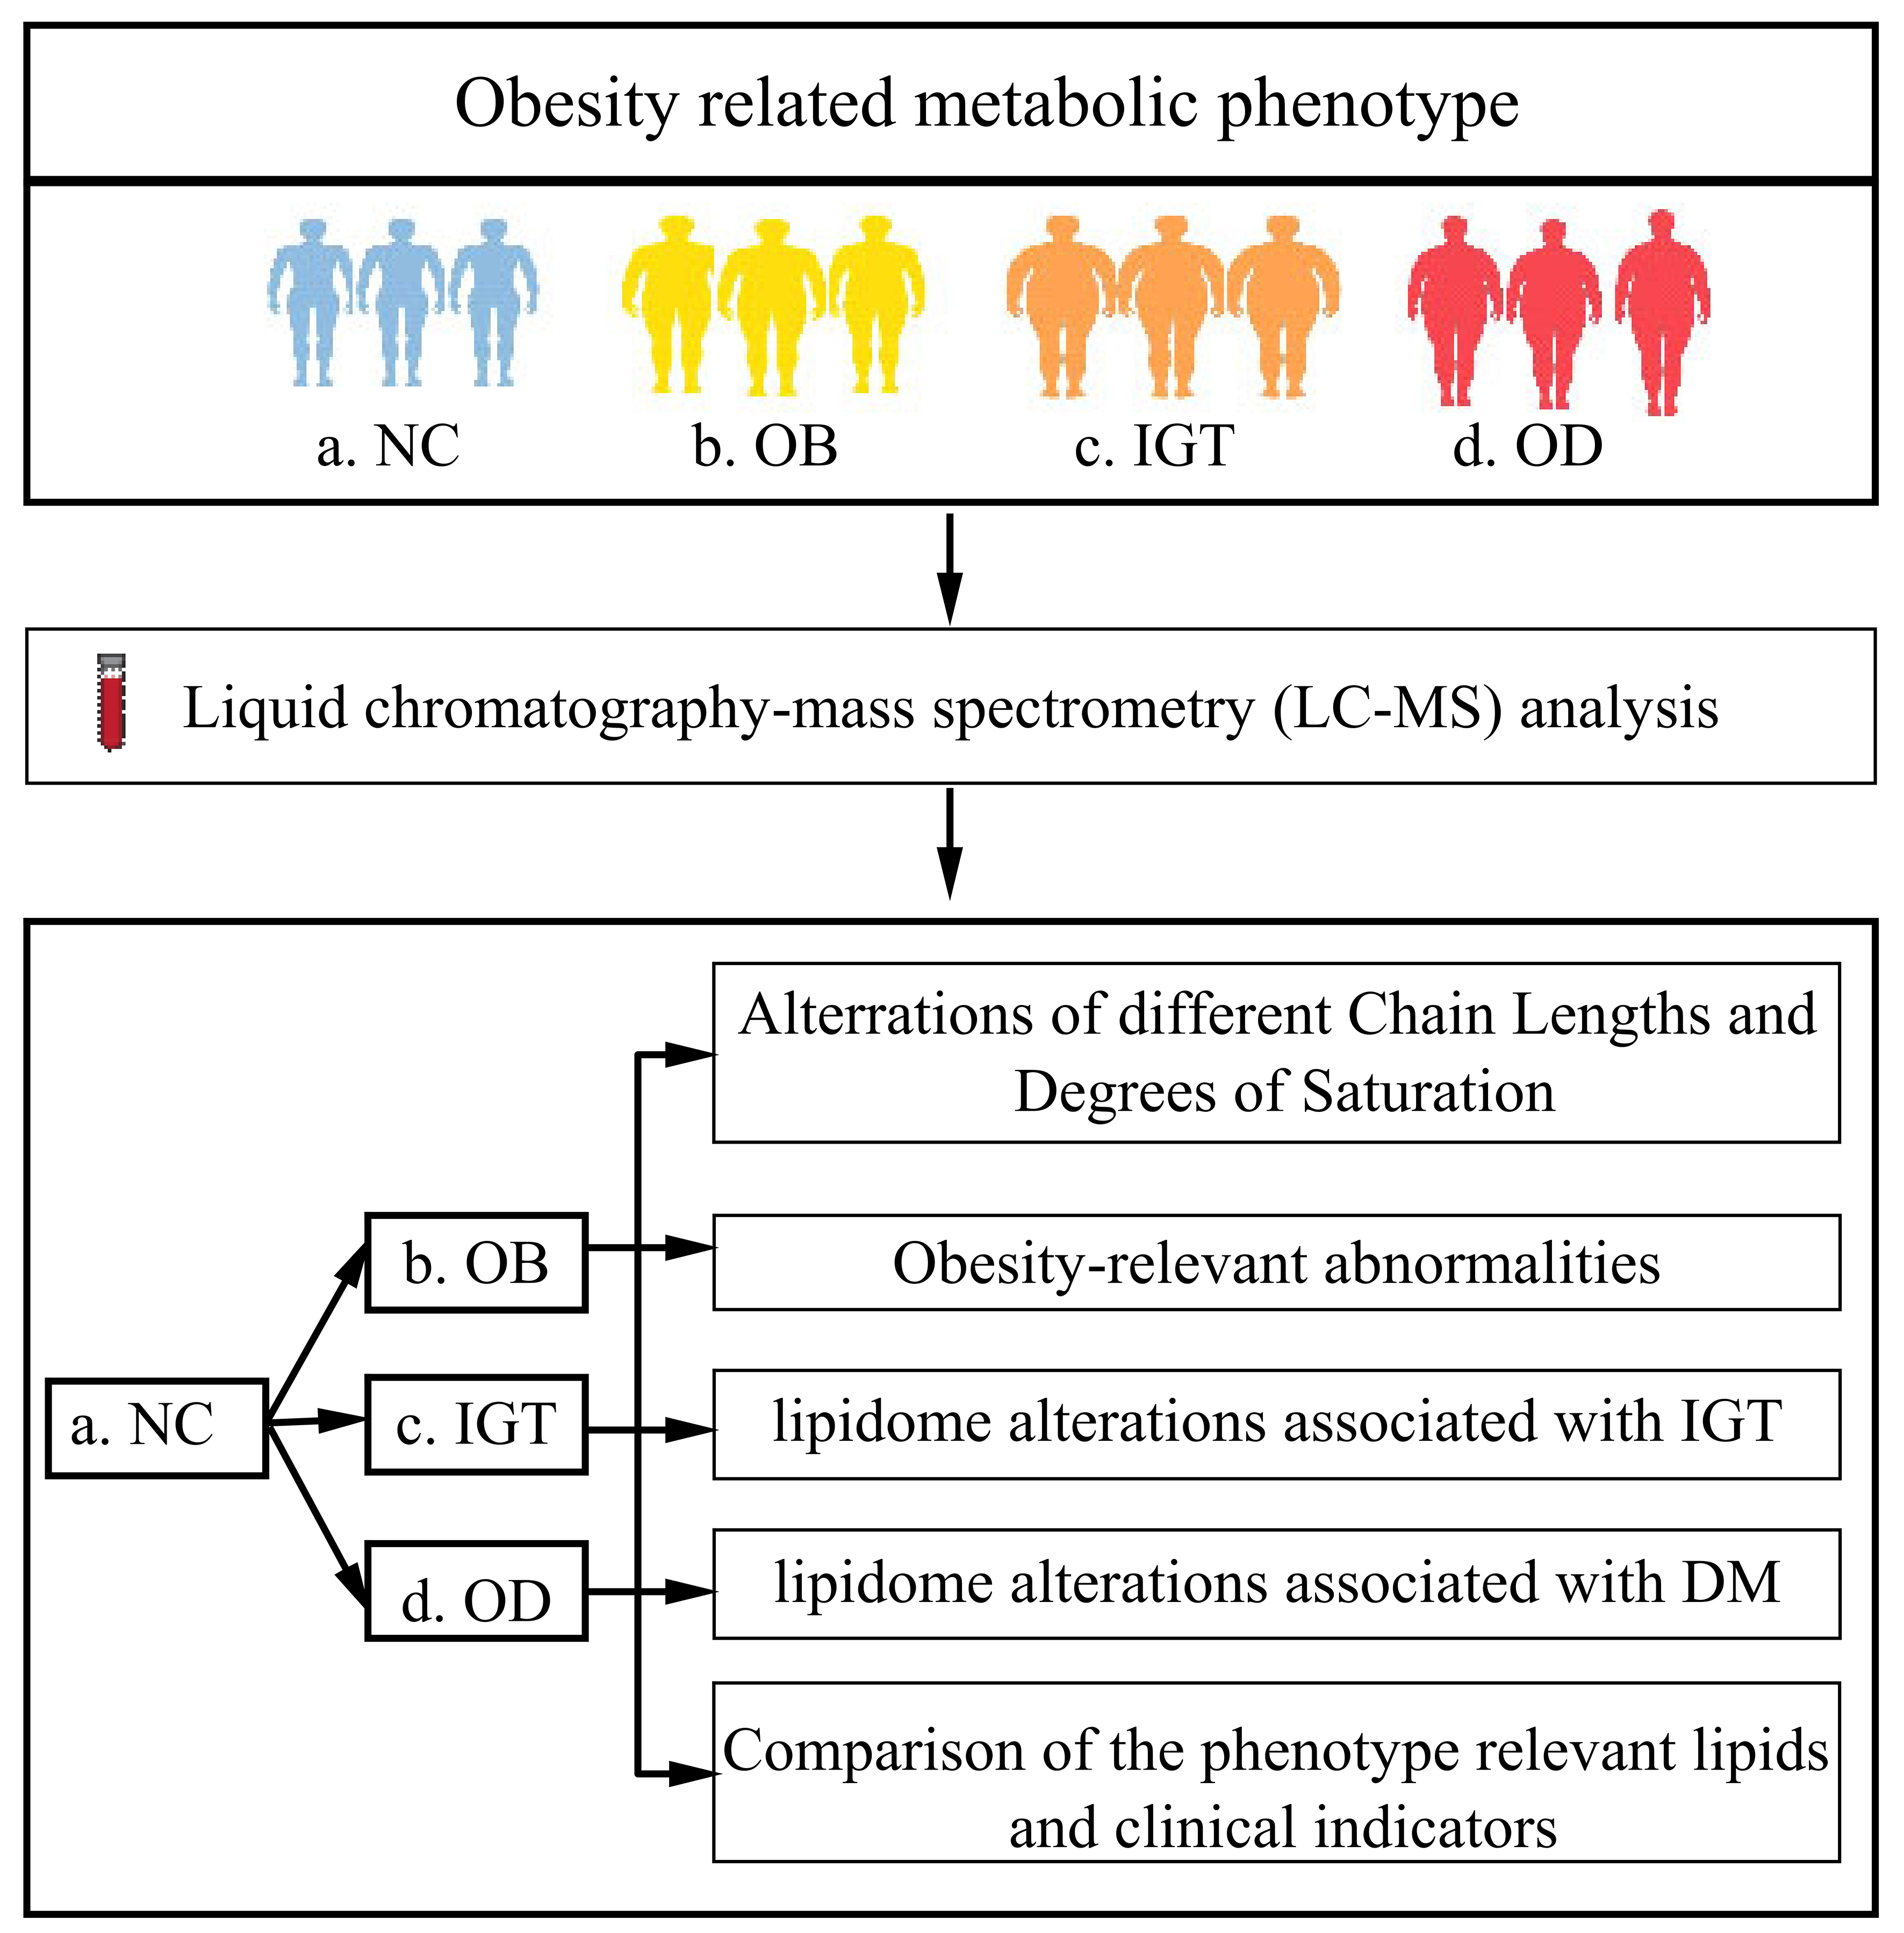
Figure 1. Study design and lipidomic analysis among groups. NC: Normal control; OB: obesity; IGT: impaired glucose tolerance; OD: obesity-related diabetes; LC-MS: liquid chromatography-mass spectrometry.
IGT was defined as a 2-h plasma glucose level ranging from 140 to 200 mg/dL (7.8 to 11.0 mmol/L) after consuming 75 g of glucose, while fasting glucose levels remain normal. The diagnostic criteria for T2DM were as follows: (1) diagnosis established within the past month; (2) glucose tolerance results consistent with World Health Organization (WHO) diagnostic criteria; and (3) no previous history of diabetes. Specifically, T2DM diagnosis required fasting blood glucose (FBG) ≥ 126 mg/dL, and/or a 2-h post glucose load oral glucose tolerance test (OGTT) ≥ 200 mg/dL, and/or glycated hemoglobin (HbA1c) ≥ 6.5%. Individuals with any of the following conditions were excluded: familial hypercholesterolemia; serum creatinine ≥ 132.6 μM (males) or ≥ 123.8 μM (females); estimated glomerular filtration rate (eGFR) < 60 mL/min; a history of malignancy or severe systemic disease; recent cardiovascular events.
The study included a normal control (NC) group of 23 lean, metabolically healthy participants, comprising 12 males and 11 females, with a mean age of 41.13 years and a BMI of 22.26 kg/m2. Individuals were considered “metabolically healthy” if they had: (1) no prior history of diabetes and FBG < 6.1 mmol/L, 2-h post OGTT < 7.8 mmol/L; (2) no prior history of hypertension with systolic blood pressure (SBP)/diastolic blood pressure (DBP) < 140/90 mmHg; (3) no prior record of elevated cholesterol levels [total cholesterol (TC) < 5.18 mmol/L] and fasting plasma TG < 1.7 mmol/L, with fasting serum high-density lipoprotein cholesterol (HDL-c) at least 0.9 mmol/L for men or at least 1.0 mmol/L for women; and (4) no prior history of heart or endocrine diseases.
Clinical measurements
Records were taken for BMI, SBP, and DBP. The levels of TC, TG, HDL-c, low-density lipoprotein cholesterol (LDL-c), FBG, HbA1c, alanine aminotransferase (ALT), aspartate aminotransferase (AST), and eGFR were assessed with an automatic biochemical analyzer (AU5800 clinical chemistry analyzer; Beckman Coulter Inc., Brea, CA, USA). Radioimmunoassay was used to measure fasting insulin (FIns) and fasting c-peptide (FCP). The HOMA2 Calculator (https://www.dtu.ox.ac.uk/homacalculator/) was used for homeostasis model assessment (HOMA) of steady-state beta-cell function (HOMA-%β) and insulin resistance (HOMA-IR).
Serum lipidomic profiling
For lipidomic analysis, serum samples were obtained by centrifuging blood at 1,300 × g for 15 min at room temperature and promptly frozen at -80 °C. A Thermofisher Vanquish UHPLC (ultra-high-performance liquid chromatography) system, which includes a binary pump, an autosampler, a vacuum degasser, a column oven, and a Q Exactive Plus mass spectrometer, was used for the lipid analysis. The lipid extracts were introduced into a reversed-phase ACQUITY UPLC BEH C18 column (100 mm × 2.1 mm, 1.7 μm, Waters), which was kept at 55 °C.
The mobile phase consisted of component A, a mixture of acetonitrile and water (60:40, v/v) containing
Data was processed using Xcalibur 4.3 for acquisition and LipidSearch 5.0 for peak detection, alignment, and normalization. Lipid identification was based on accurate mass and MS/MS fragment analysis, annotated by total acyl carbon number and degree of unsaturation. Adducts included: positive ionization (M+H, M+NH4, M+NH4-H2O, M+Na, M+K, M+2K-H) and negative ionization (M-H, M-H2O-H, M+C2H3O2, M+HCO2). In total, 4,001 lipids spanning 45 classes or subclasses were detected. Missing values below detection limits were replaced with half of the minimum observed value. Detailed lipid class information is presented in Supplementary Table 1.
Statistical analysis
IBM SPSS version 25 was used for statistical analyses, and variables with skewed distributions were either log-transformed or had their square roots taken to achieve normality[21]. For quantitative variables, either the Student’s t-test or the Mann-Whitney U test was used for analyses between two groups, and either one-way analysis of variance (ANOVA) or the nonparametric Kruskal-Wallis test for analyses across four groups. For qualitative variables, either the chi-square or Fisher’s exact test was used. Quantitative variables are shown as means ± standard deviation (SD) or medians (25th and 75th percentiles), while qualitative variables are displayed as percentages (frequency). A P value of 0.05 or less was considered significant.
Data processing of MS information included initial peak detection, alignment, and normalization using the Progenesis QI software supplied with the instrument (Waters). The lipid profiles of NC, OB, IGT, and OD groups were compared using orthogonal partial least squares discriminant analysis (OPLS-DA). Univariate and multivariate analyses, including variable importance projection (VIP) of peak intensity, fold change (FC) analysis, and false discovery rate (FDR), were used to screen for differential and abundant lipids. A two-tailed Student’s t-test was utilized for comparing FC, with a P value threshold of less than 0.05. The Benjamini-Hochberg method was used to adjust P values to determine the FDR. Lipids with a VIP > 1, an FDR < 0.05, and an FC ≥ 0.5 or ≤ -0.5 were identified as differentially abundant. The relationship between these lipids and clinical categorical outcomes (OB and OD) was evaluated using Spearman’s correlation.
RESULTS
Clinical characteristics of study participants
A total of 96 participants were enrolled, 73 obese individuals and 23 NC. Obese individuals were distributed into three diagnostic groups: obesity (OB, n = 24), obesity with IGT (n = 24), and OD (n = 25). No significant differences in age or sex were observed among the four groups [Table 1]. Compared with the NC group, both the OB and IGT groups exhibited significantly higher HOMA-β% and HOMA-IR values (all P < 0.05), but similar levels of HOMA-β%, lipid metabolism indices (TG, TC, LDL-c, HDL-c), and liver and kidney function parameters (ALT, AST, eGFR). In the IGT group, HbA1c, HOMA-β%, and HOMA-IR were markedly elevated. The OD group displayed significantly increased levels of FBG, HbA1c, HOMA-IR, TC, TG, LDL-c, and ALT compared with the other three groups, while HOMA-β% was substantially lower [Table 1].
General characteristics of participant groups at baseline
| Index | NC (N = 23) | OB (N = 24) | IGT (N = 24) | OD (N = 25) | P value |
| Age | 41.13 ± 10.34 | 38.00 ± 6.26 | 41.46 ± 13.06 | 40.40 ± 6.74 | 0.427 |
| Sex (male/female) | 12/11 | 10/14 | 14/10 | 15/10 | 0.570 |
| BMI, kg/m2 | 22.26 ± 1.21 | 29.95 ± 2.83** | 31.53 ± 2.19** | 30.28 ± 3.37** | < 0.001 |
| FBG, mmol/L | 5.07 ± 0.43 | 4.82 ± 0.46 | 5.15 ± 0.73 | 7.92 ± 1.80** | < 0.001 |
| FIns, pmol/L | 56.33 ± 18.11 | 102.17 ± 33.07** | 127.45 ± 79.52** | 125.08 ± 56.92** | < 0.001 |
| FCP, nmol/L | 0.49 ± 0.12 | 0.79 ± 0.19** | 0.74 ± 0.31** | 0.64 ± 0.31** | < 0.001 |
| HOMA-β% | 125.0 ± 51.07 | 283.3 ± 124.4** | 320.0 ± 261.0** | 109.5 ± 71.42* | < 0.001 |
| HOMA-IR | 2.14 ± 0.78 | 3.68 ± 1.29** | 4.79 ± 2.97** | 7.33 ± 3.58** | < 0.001 |
| HbA1c, % | 5.53 ± 0.28 | 5.51 ± 0.29 | 6.15 ± 0.37** | 8.60 ± 2.14** | < 0.001 |
| TC, mmol/L | 4.04 ± 0.73 | 4.47 ± 0.74 | 4.01 ± 1.33 | 5.13 ± 1.33** | < 0.001 |
| HDL-c mmol/L | 1.04 ± 0.27 | 1.25 ± 0.28 | 1.27 ± 0.27** | 0.94 ± 0.76 | < 0.001 |
| TG, mmol/L | 1.09 ± 0.37 | 1.43 ± 0.57 | 2.05 ± 1.64 | 2.70 ± 1.98** | < 0.001 |
| LDL-c, mmol/L | 2.47 ± 0.76** | 1.27 ± 0.30 | 2.75 ± 0.85 | 3.47 ± 0.76** | < 0.001 |
| ALT, U/L | 21.91 ± 5.88 | 24.83 ± 15.24 | 28.33 ± 15.34 | 48.28 ± 33.31** | 0.002 |
| AST, U/L | 20.35 ± 5.65 | 20.79 ± 8.72 | 22.29 ± 6.48 | 37.76 ± 25.20* | 0.015 |
| eGFR, mL/min/1.73 m2 | 123.19 ± 19.54 | 106.14 ± 12.73** | 114.75 ± 20.65* | 125.05 ± 24.10 | < 0.001 |
OPLS-DA score plots revealed distinct clustering of all four groups, indicating clearly differentiated serum lipid profiles [Figure 2A and B]. A total of 4,001 lipid molecules across 21 lipid classes were identified, among which the top six differentially expressed lipid classes were Cer, phosphatidylethanolamine (PE), LPC, DG, phosphatidylcholine (PC), and TG [Figure 2C]. The distribution of these top six lipid classes across all groups is illustrated in Figure 2D.
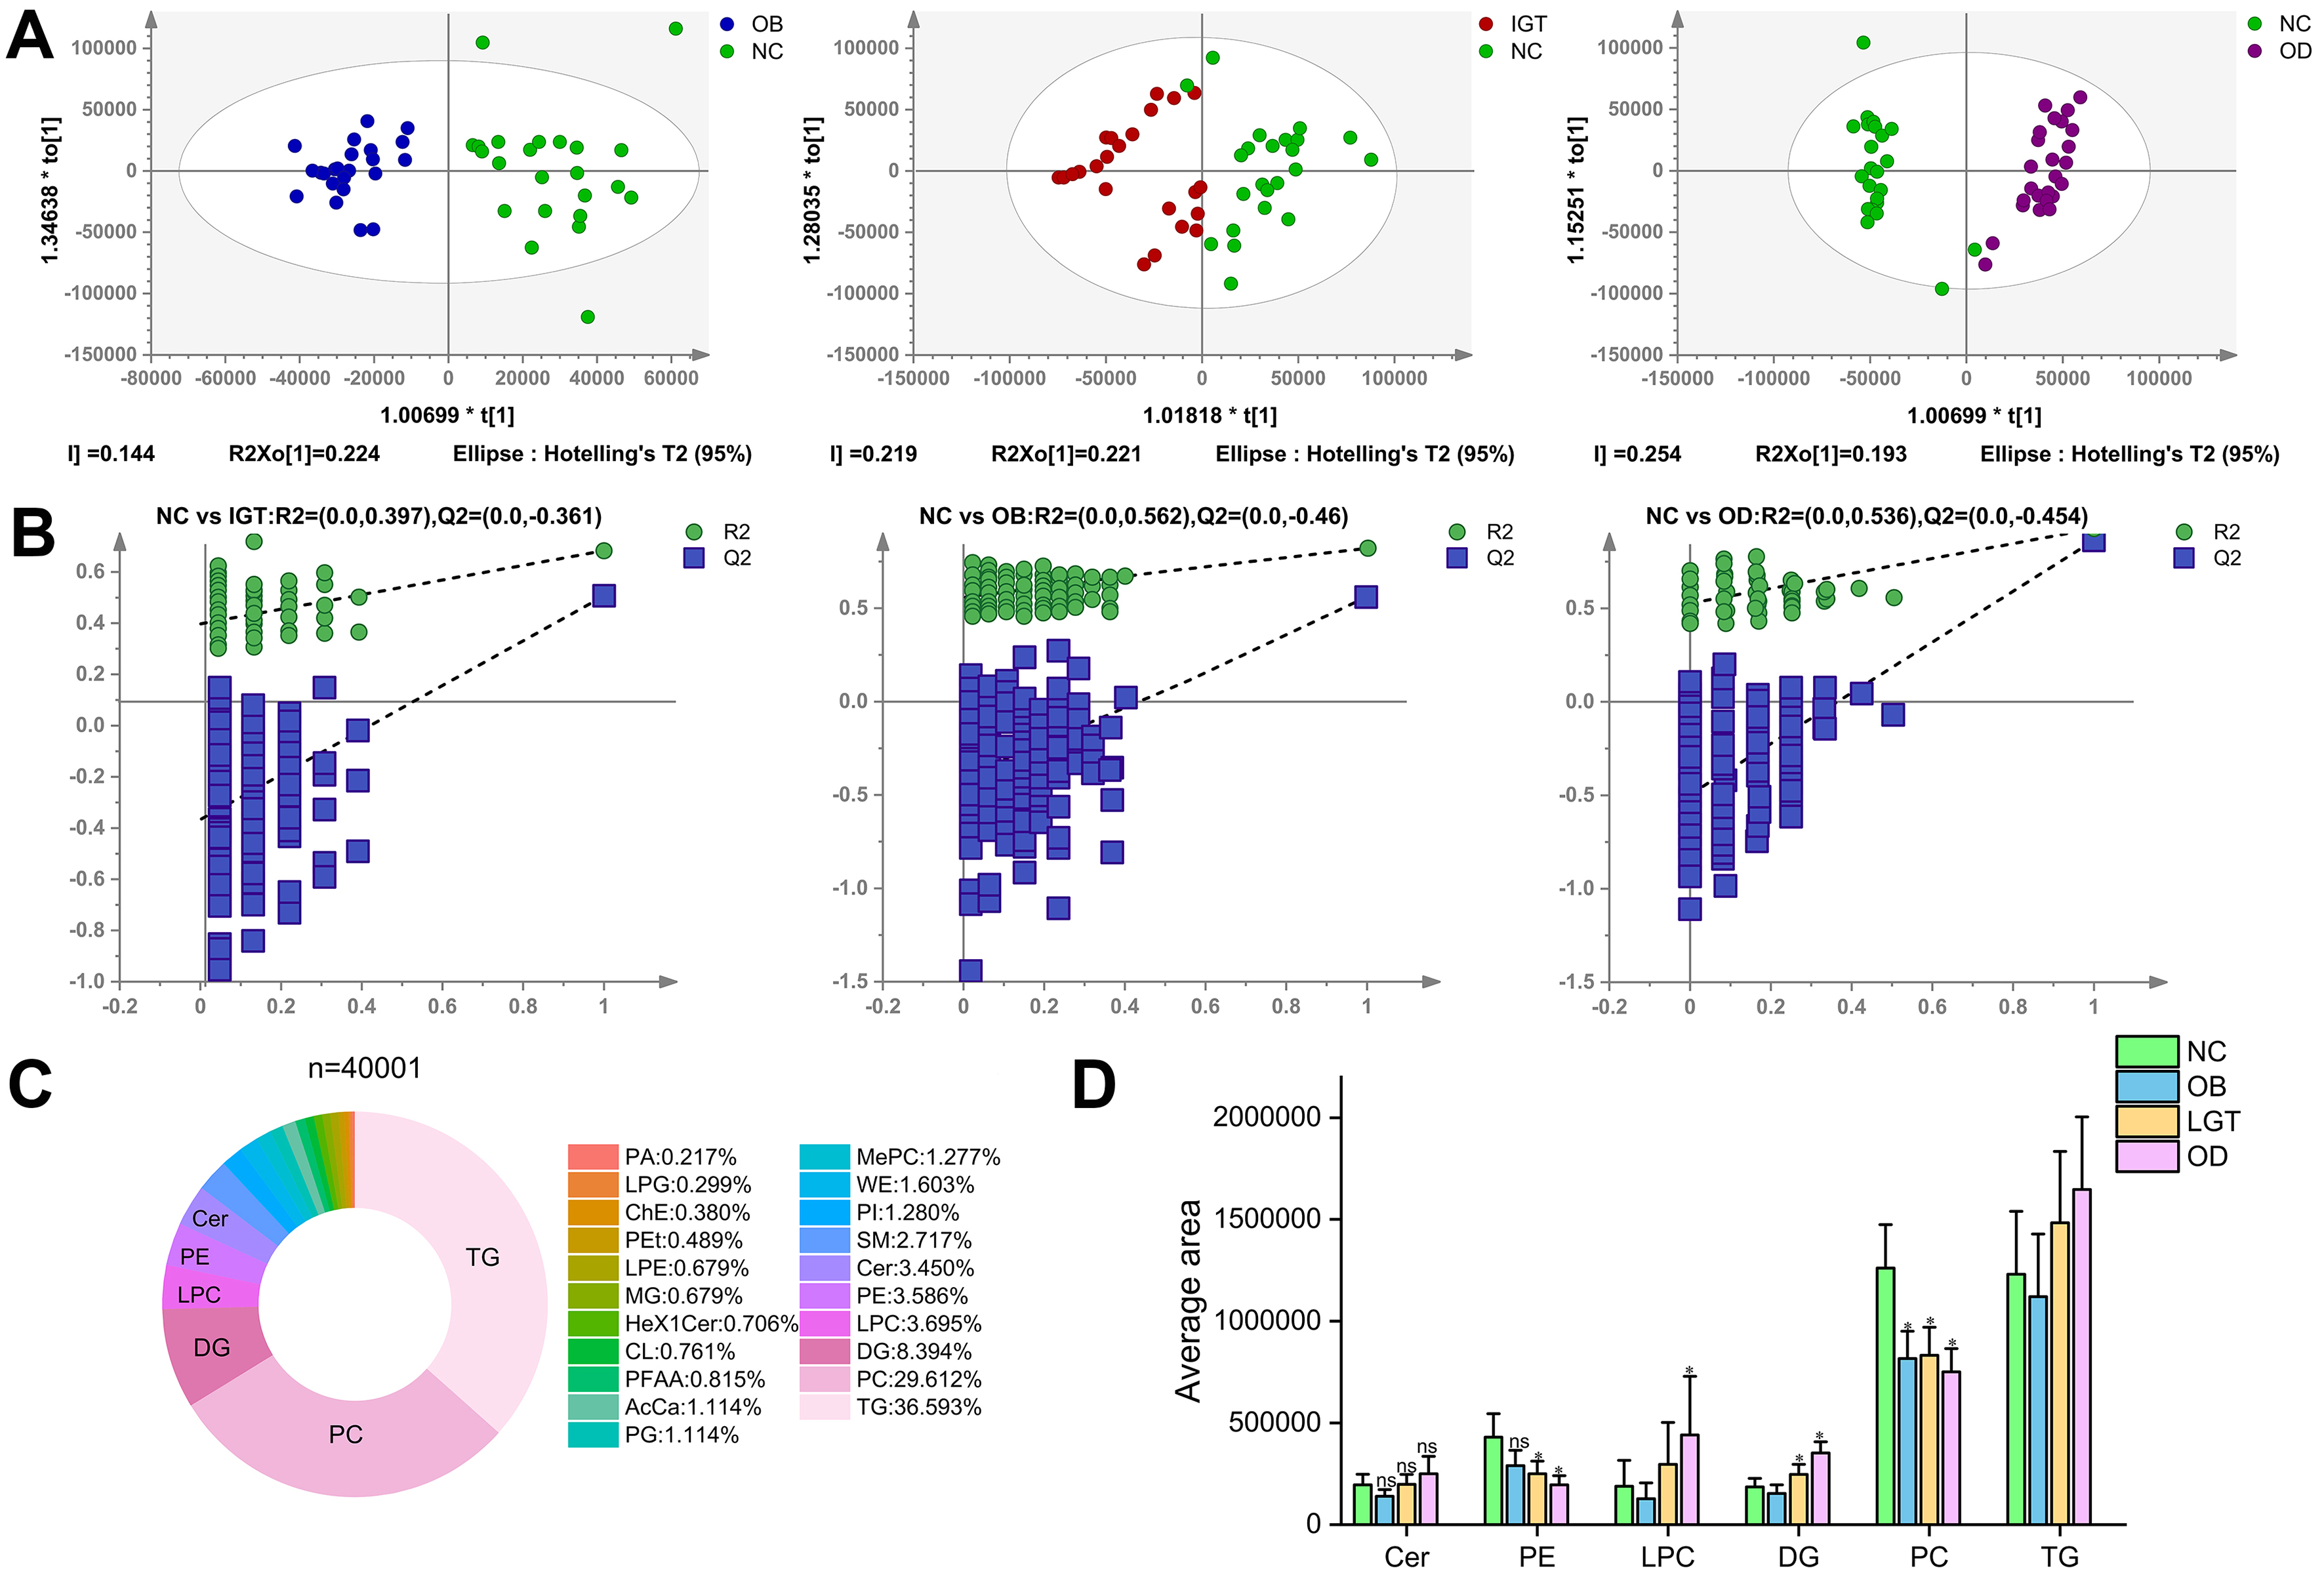
Figure 2. Score plot of the OPLS-DA model and comparative analysis of lipidomic profiles. (A) Score plot of the OPLS-DA model in the positive mode; (B) Permutation test of the OPLS-DA model in the positive mode; (C) Categories of the 21 lipid classes form a total of 4001 molecular lipids; (D) The top 6 lipid species in the serum from NC, OB, IGT and OD groups. All models were validated with Q2 ≥ 0.5 and permutation tests P ≤ 0.05. PA: Phosphatidic acid; LPG: lysophosphatidylglycerol; ChE: cholesterylester; LPC: lysophosphatidylcholine; PEt: phosphatidylethanol; SM: sphingomyelins; TG: triacylglycerol; PG: phosphatidylglycerol; PC: phosphatidylcholine; LPE: lysophosphatidylethanolamine; PFAA: plasma free amino acids; WE: wax ester; PE: phosphatidylethanolamine; DG: diacylglycerol; PI: phosphatidylinositol; Hex1Cer: hexose ceramide; AcCa: acyl carnitine; Cer: ceramide; MePC: methylated phosphatidylcholine; MG: monoacylglycerol; CL: cardiolipin.
Alterations in fatty acid chain length and unsaturation patterns
Fatty acids were categorized by carbon chain length into short-chain fatty acids (SCFA, 2-6 carbons), medium-chain fatty acids (MCFA, 7-10 carbons), long-chain fatty acids (LCFA, 11-20 carbons), very long-chain fatty acids (VLCFA, 21-25 carbons), and ultra-long-chain fatty acids (ULCFA, > 26 carbons). Heatmap analysis demonstrated significant differences among the four groups in the relative abundance of lipid species with varying chain lengths within DG, PC, LPC, and TG [Figure 3A-D]. In particular, the OD group showed markedly higher proportions of VLCFA and ULCFA species in DG, PC, and LPC compared with the OB and IGT groups. As shown in Figure 3D, TG species predominantly contained chain lengths of 35-65 carbons, corresponding mainly to ULCFA.
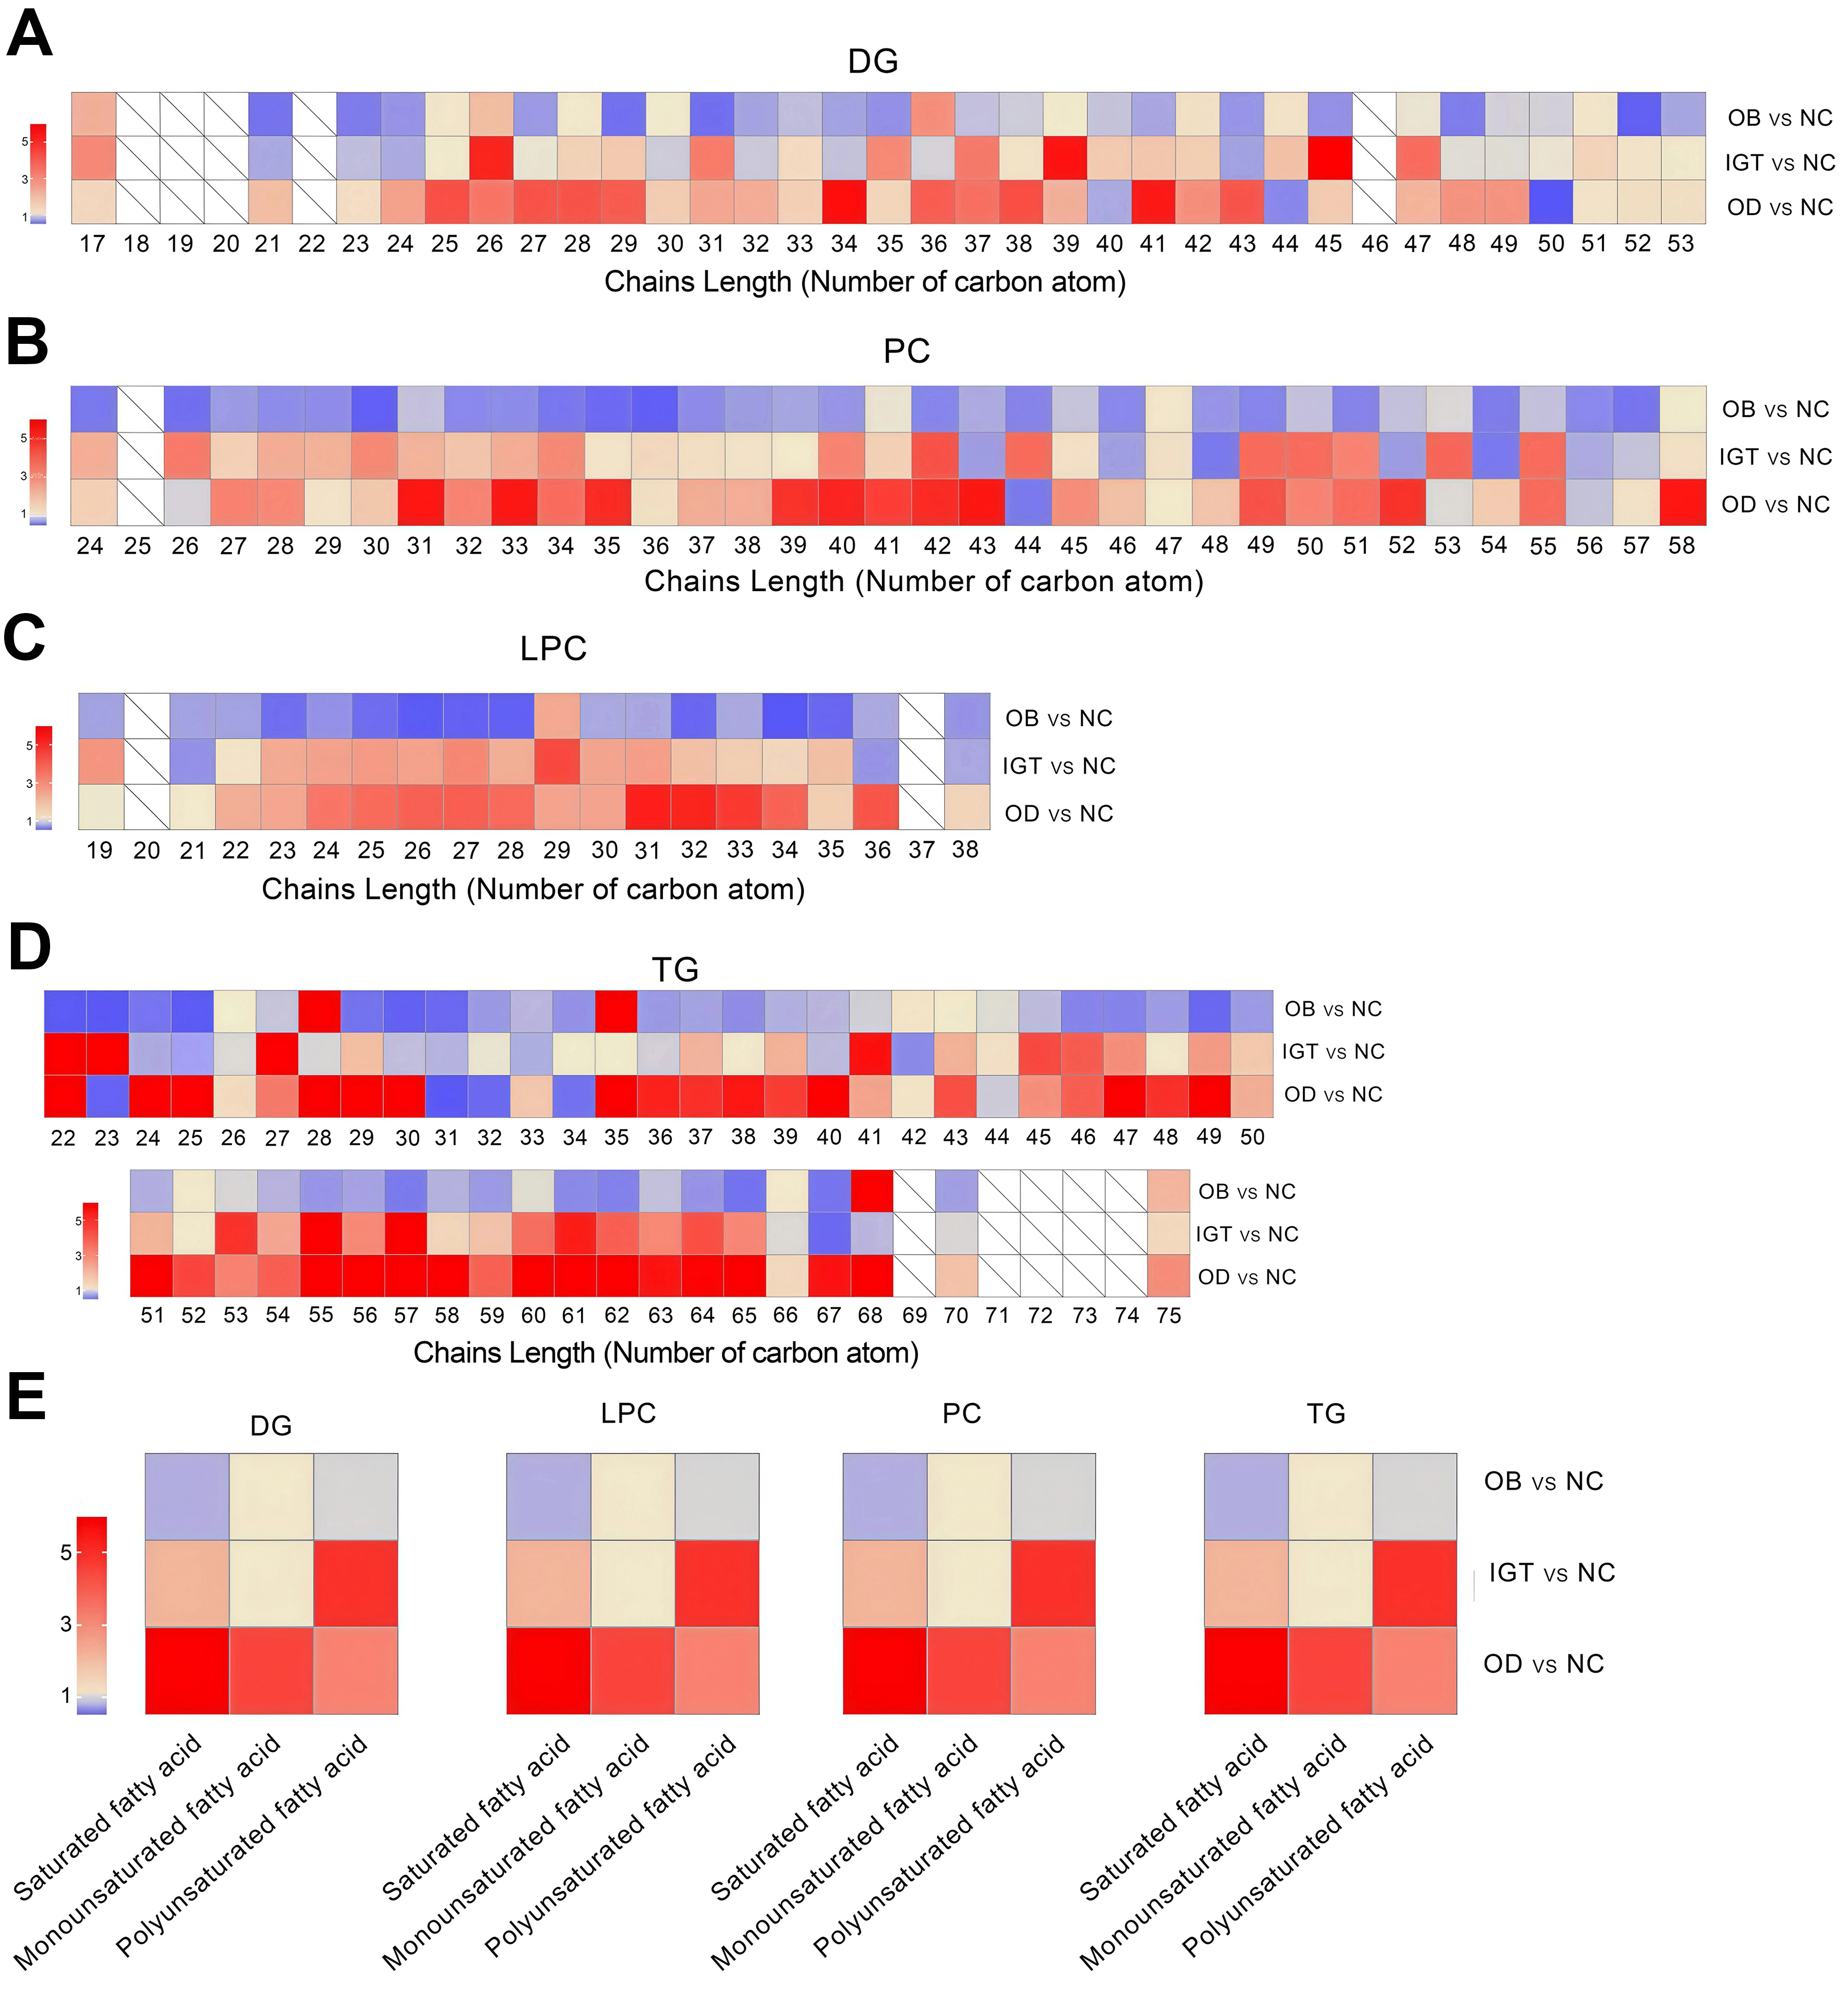
Figure 3. Relative abundance of chain length and grouped fatty acid saturation within DG, PC, LPC and TG. Analysis of double bond numbers across lipid chains within DG (A), PC (B), LPC (C), and TG (D) species. (E) Alterations in fatty acid chain length (number of carbon atoms) within DG, PC, LPC, and TG species in four groups. NC: Normal control; OB: obesity; IGT: impaired glucose tolerance; OD: obesity-related diabetes; DG: diacylglycerol; PC: phosphatidylcholine; LPC: lysophosphatidylcholine; TG: triacylglycerol.
Analysis of double bond numbers across lipid chains further revealed significant group-specific patterns. Lipids were classified as saturated (no double bonds), monounsaturated (one double bond), or polyunsaturated (two or more double bonds). In the DG, PC, LPC, and TG, the IGT and OD groups displayed increased levels of saturated fatty acids compared with the OB group, whereas polyunsaturated fatty acids were more abundant in the IGT group [Figure 3E].
Decreased PC and LPC levels correlate negatively with BMI and HOMA-IR in obese participants
Twenty-three lipids were differentially expressed between the OB and the NC groups, including 22 downregulated and one upregulated species [Figure 4A and B]. The OB group primarily exhibited reduced levels of PC and LPC species [Figure 4C]. Spearman correlation analysis demonstrated strong correlations between different lipids and metabolic indices [Figure 4D]. Eight significantly downregulated PC species showed positive correlations with LDL-c and negative correlations with BMI and HDL-c. Similarly, six LPC species were positively correlated with LDL-c and FBG, but negatively correlated with BMI, HOMA-IR, HDL-c, and FCP, indicating that decreased PC and LPC levels may reflect lipid metabolic disturbances associated with obesity [Figure 4D].
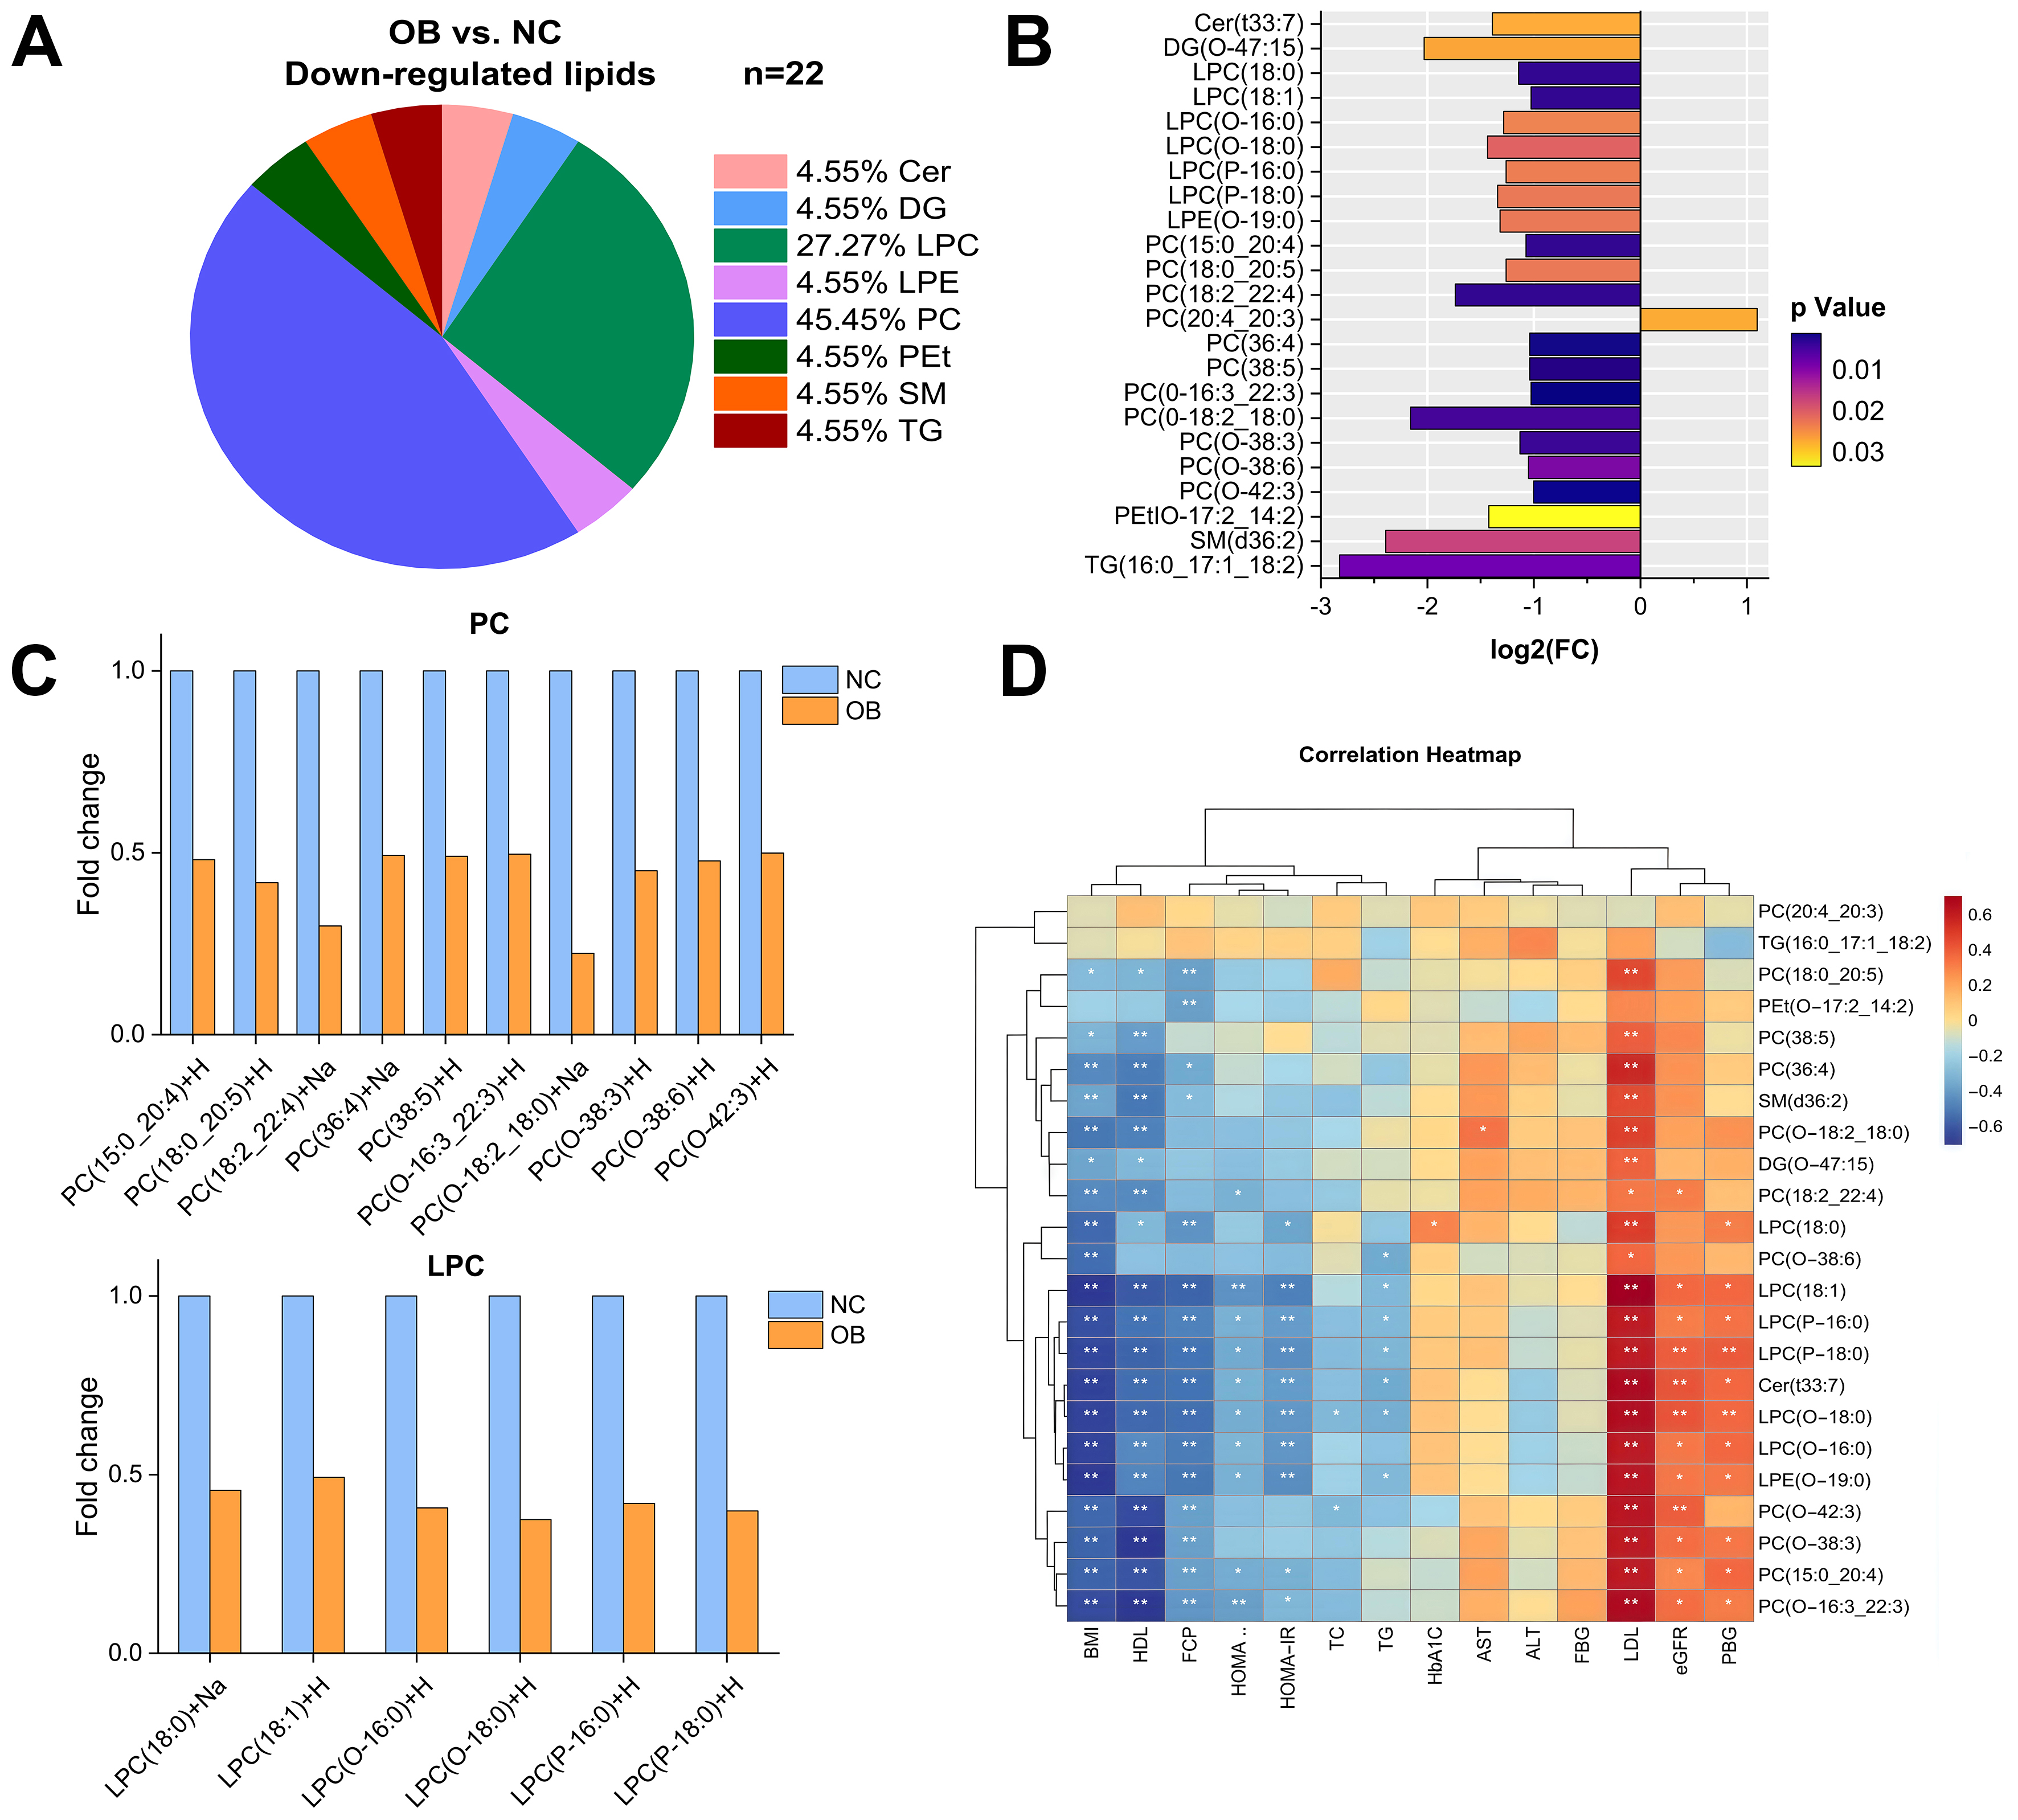
Figure 4. Change in lipidomic signatures and differences in lipid classes in obese individuals relative to the control group. (A) Pie charts depicting the proportion of significantly differential lipids in OB group versus NC group; (B) 23 differentially regulated lipids were associated with obesity group (adjusted VIP > 1, FC ≥ 0.5 or ≤ -0.5); (C) Comparison of PC and LPC lipid species between the OB group and the NC group; (D) Correlations between differential lipids and metabolic indexes in the total study sample in the OB group versus the NC group. NC: Normal control; OB: obesity; VIP: variable influence on projection; FC: fold change; Cer: ceramide; DG: diacylglycerol; PC: phosphatidylcholine; LPC: lysophosphatidylcholine; LPE: lysophosphatidylethanolamine; PEt: phosphatidylethanol; SM: sphingomyelins; TG: triacylglycerol.
Enhanced triacylglycerol remodeling from IGT to diabetes
In obese individuals with IGT, 208 lipids were differentially expressed compared with control individuals, including 165 significantly upregulated species [Figure 5A]. The heatmap plots highlighted distinct lipidomic shifts [Figure 5B], with TG showing the most pronounced upregulation [Figure 5C].

Figure 5. Change in lipidomic signatures and differences in lipid classes in obese individuals with IGT relative to the control group. (A) Pie charts depicting the proportion of significantly differential lipids in the IGT group versus the NC group; (B) Hierarchical clustering heatmap showing the 208 lipids in which a significant difference existed between the IGT group and the NC group (adjusted VIP > 1, P < 0.05, FC ≥ 2 or ≤ -0.5). Data are presented as Z-score by row, with each individual row representing 1 of the 208 significantly different lipids); (C) Comparison of up-regulated TG, DG, PC and LPC species between the IGT group and the NC group. NC: Normal control; IGT: impaired glucose tolerance; VIP: variable influence on projection; FC: fold change; Cer: ceramide; Ch: cholesterol; Che: cholesteryl ester; DG: diacylglycerol; LPC: lysophosphatidylcholine; LPE: lysophosphatidylethanolamine; PC: phosphatidylcholine; PE: phosphatidylethanolamine; TG: triacylglycerol; Hex1Cer: hexose ceramide; PEt: phosphatidylethanol; SM: sphingomyelins.
To further elucidate lipidomic changes associated with diabetes progression, we compared the OD and the NC groups and identified 305 differentially expressed lipids, of which 220 were significantly upregulated [Figure 6A]. The heatmap analysis [Figure 6B] showed that TG constituted the dominant lipid class in the OD group, accounting for 49.5% of total serum lipids [Figure 6C]. Notably, TG species were the most strongly increased lipids during the transition from IGT to diabetes, suggesting that enhanced TG accumulation and remodeling play a central role in lipotoxicity and glucose metabolism dysfunction.
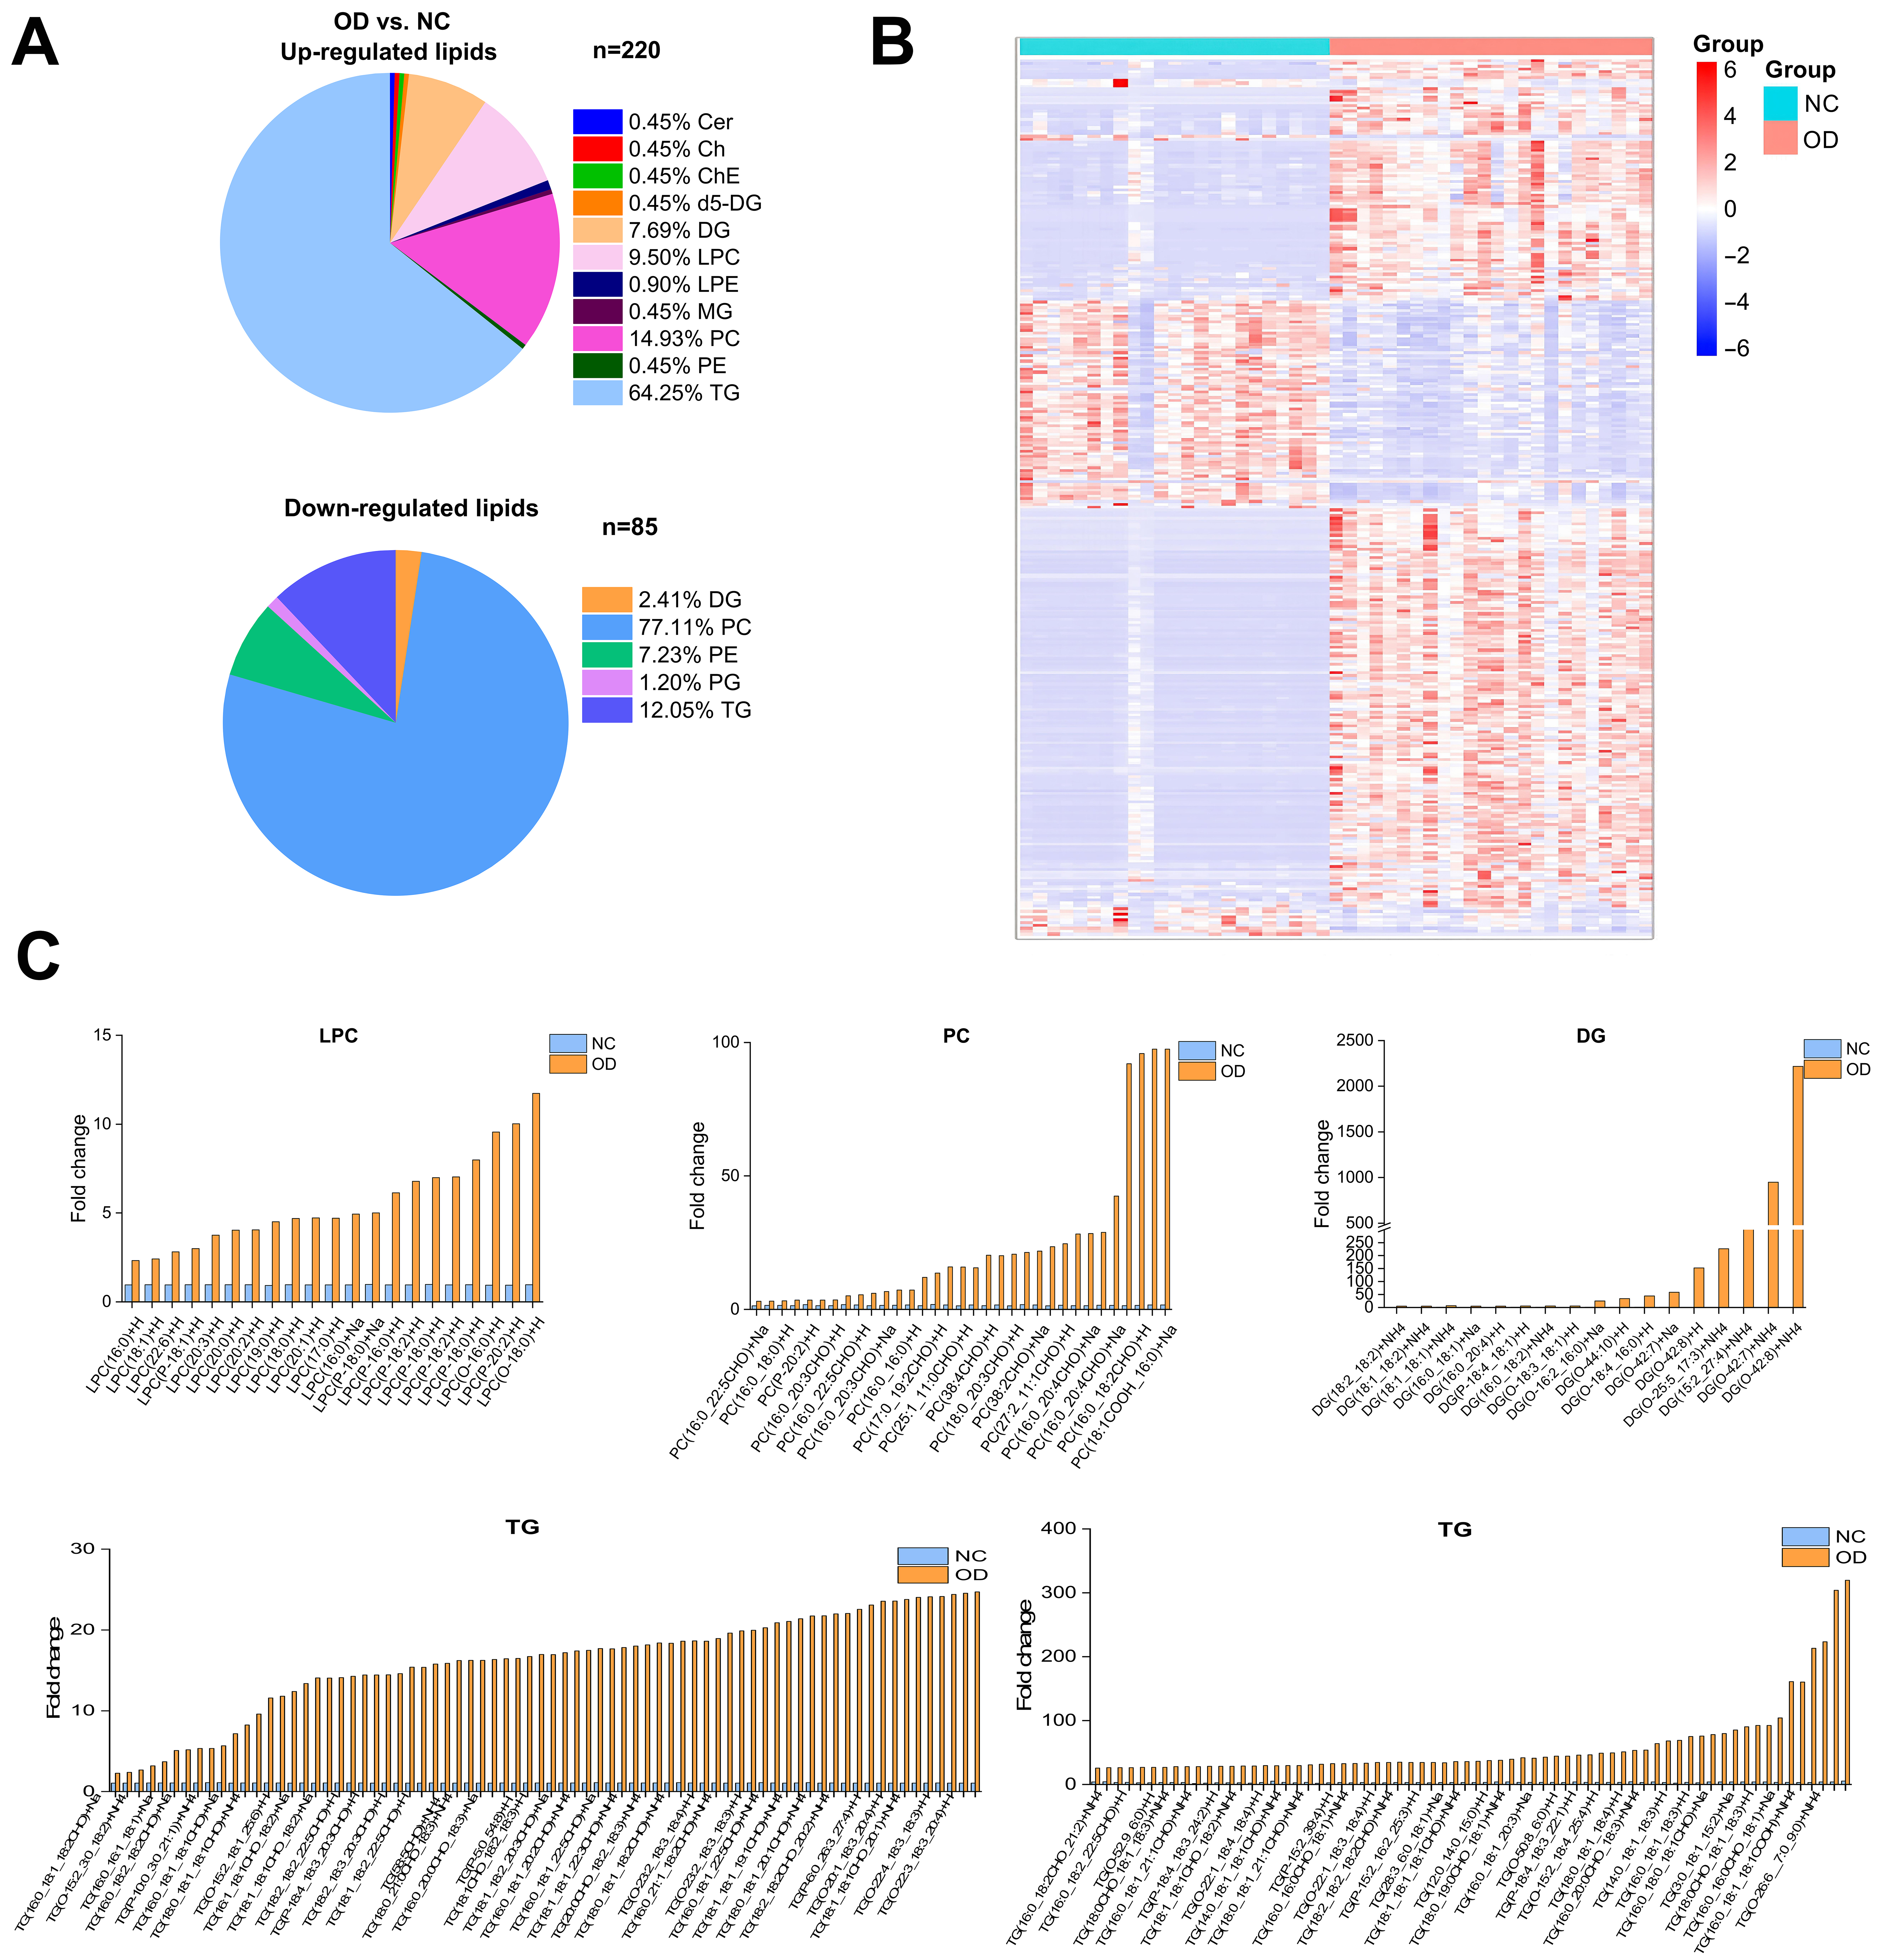
Figure 6. Significantly different lipids and lipidomic changes related to T2DM in the OD group relative to the control group. (A) Pie charts depicting the proportion of significantly differential lipids in the OD group versus the NC group; (B) Hierarchical clustering heatmap showing the 305 lipids in which a significant difference existed between the OD group and the NC group (adjusted VIP > 1, P < 0.05, FC ≥ 2 or ≤ -0.5). Data are presented as Z-score by row, with each individual row representing 1 of the 208 significantly different lipids; (C) Comparison of TG, DG, PC and LPC species between the OD group and the NC group. NC: Normal control; OD: obesity-related diabetes; Cer: ceramide; Ch: cholesterol; ChE: cholesteryl ester; DG: diacylglycerol; LPC: lysophosphatidylcholine; LPE: lysophosphatidylethanolamine; PC: phosphatidylcholine; PE: phosphatidylethanolamine; TG: triacylglycerol; MG: monoglyceride.
Predictive lipid biomarkers for T2DM
A Venn diagram illustrates 12 overlapping differential lipids shared by the OB, IGT, and OD groups [Figure 7A]. Receiver operating characteristic (ROC) curve analysis identified LPC (16:0), Cer (t33:7), and lysophosphatidylethanolamine (LPE) (O-19:0) as strong diagnostic markers for T2DM, with area under the curve (AUC) values of 0.975, 0.986, and 0.948, respectively [Figure 7B].
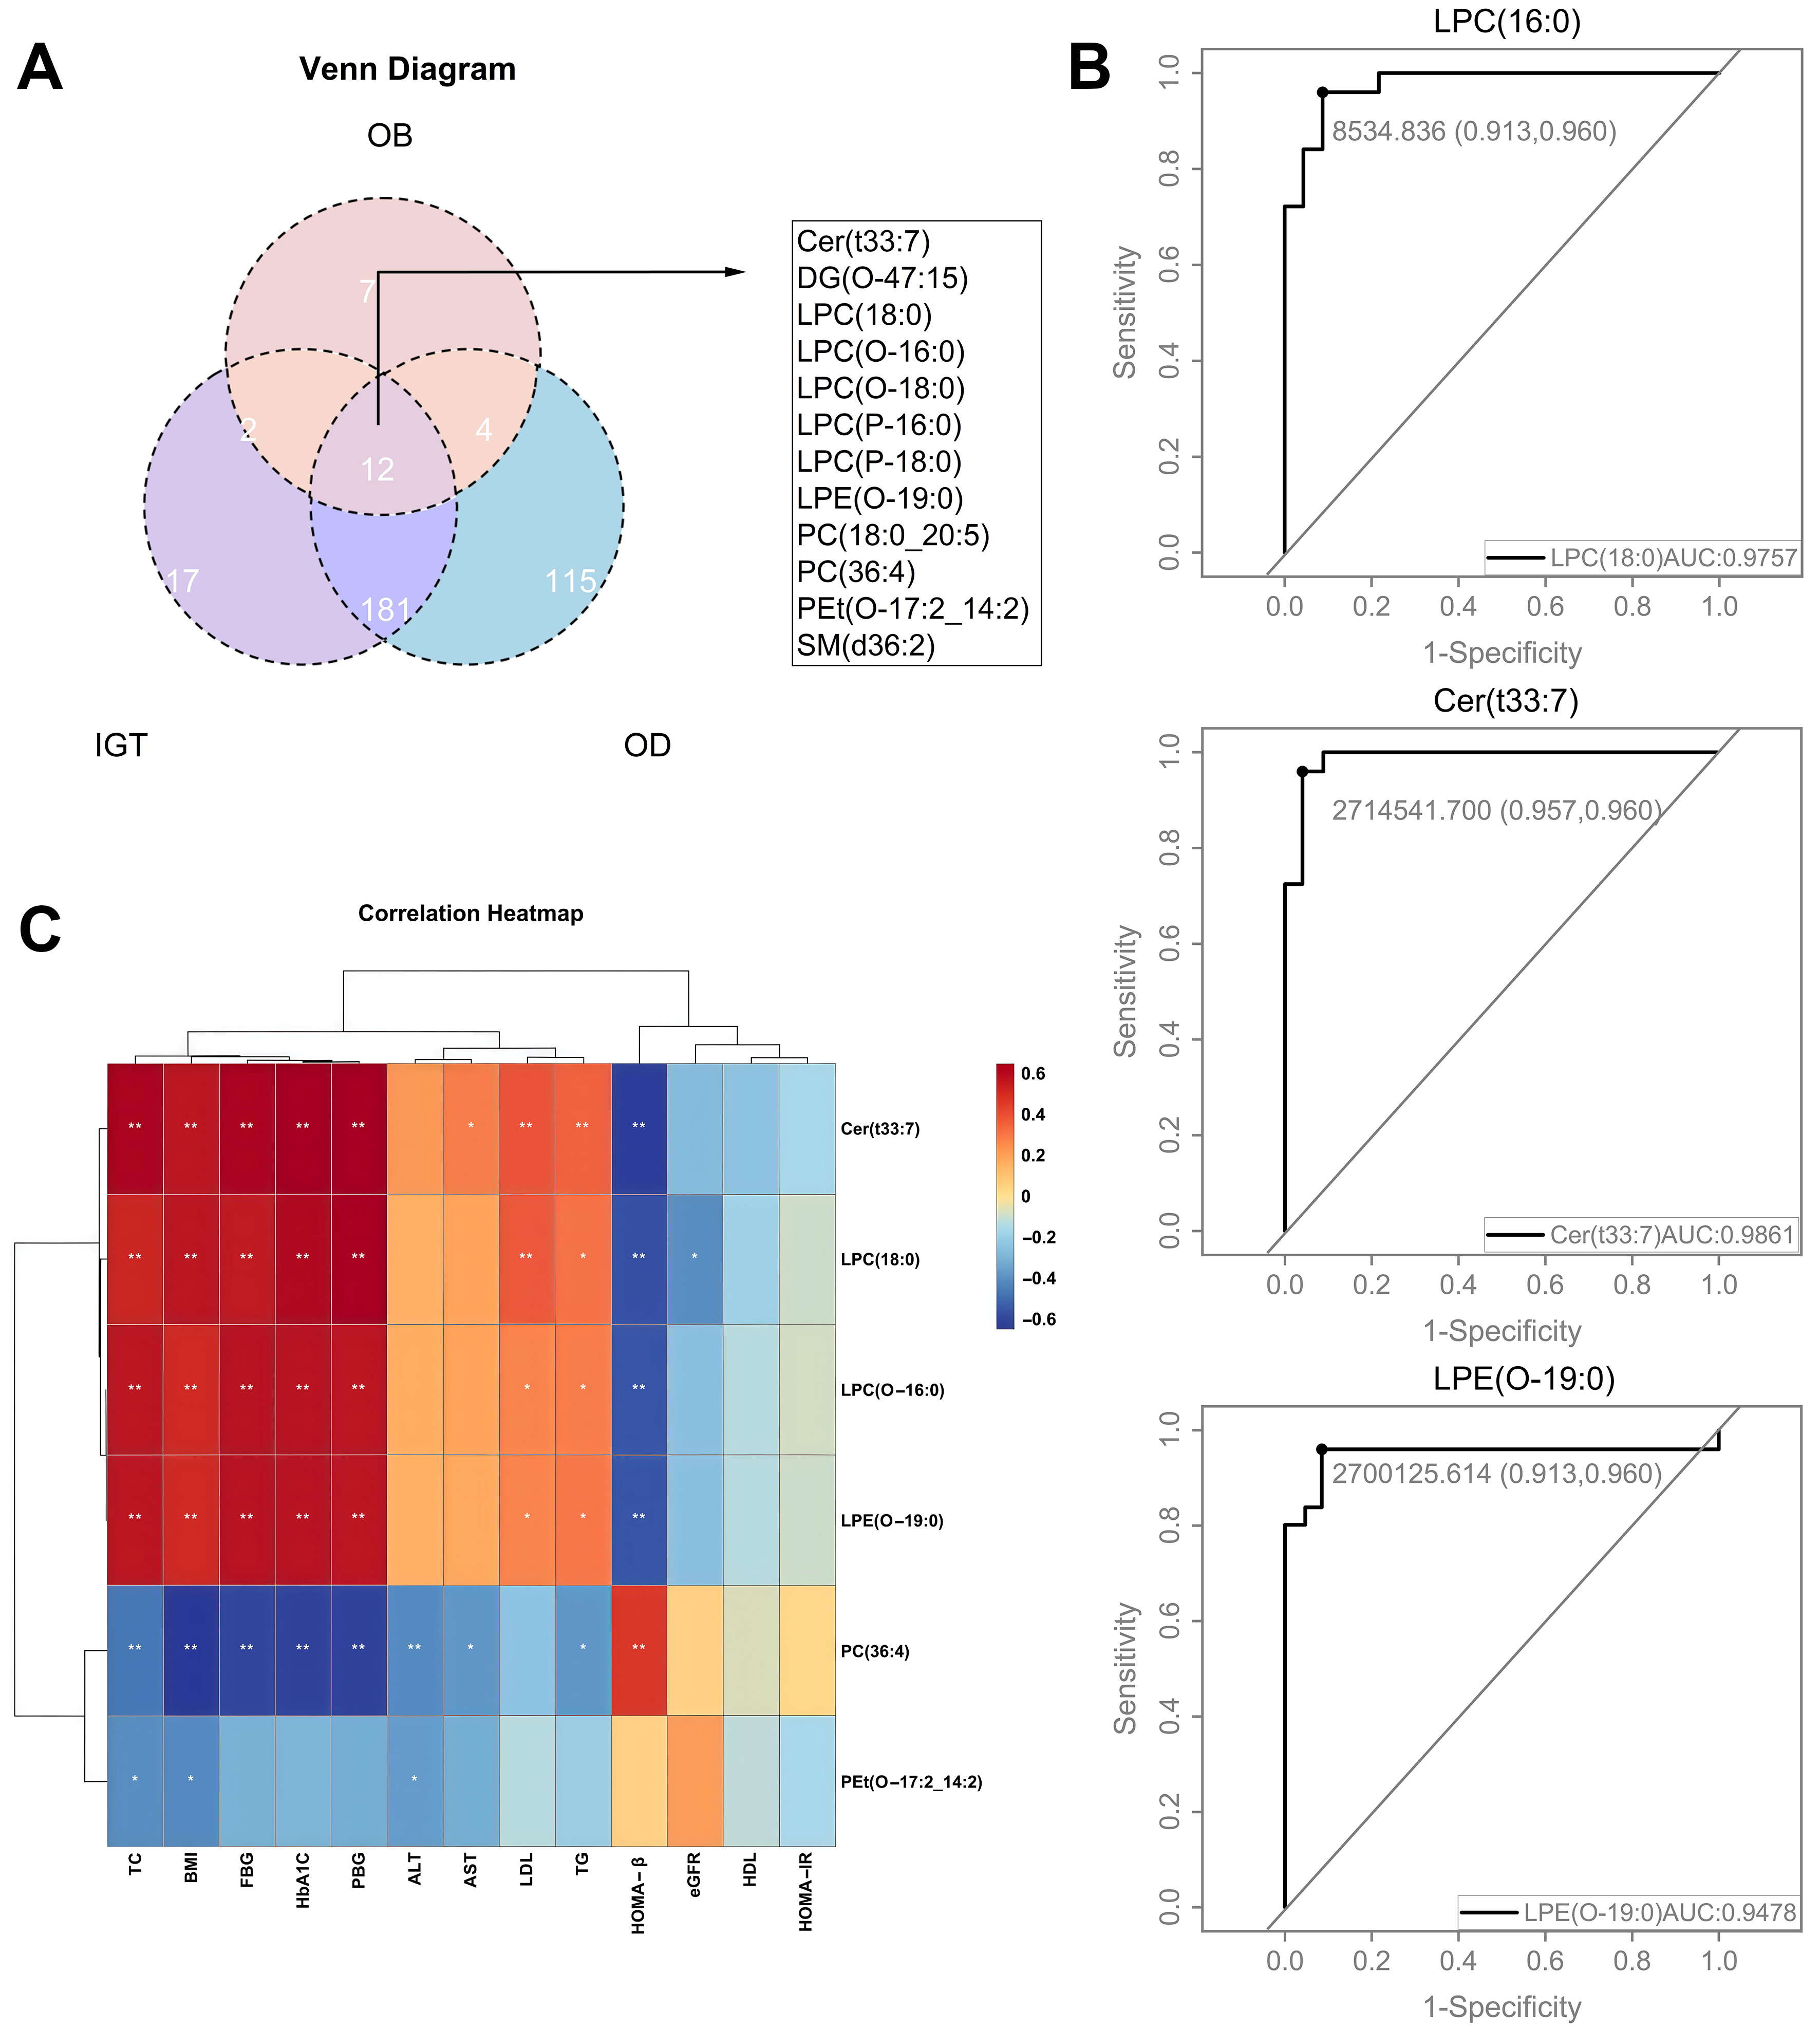
Figure 7. Shared differential lipids in the OB, IGT, and OD groups and ROC curves for models forecasting the onset of T2DM using specific lipids. (A) Venn diagram depicting differential lipids in the OB, IGT and OD groups; (B) ROC curves depicting the diagnostic efficacy of specific lipids for obesity-related diabetes, including LPC (16:0), LPC (O-16:0), Cer (t33:7), LPE (O-19:0), PC (36:4) and Pet (O-17:2_14:2); (C) Correlations between six specific lipids and metabolic indexes in the OD group versus the NC group (C). NC: Normal control; OB: obesity; IGT: impaired glucose tolerance; OD: obesity-related diabetes; ROC: receiver operating characteristic; Cer: ceramide; DG: diacylglycerol; LPC: lysophosphatidylcholine; LPE: lysophosphatidylethanolamine; PC: phosphatidylcholine; PE: phosphatidylethanolamine; SM: sphingomyelins; TC: total cholesterol; BMI: body mass index; FBG: fasting blood glucose; PBG: Postprandial Blood Glucose; HbA1c: glycated hemoglobin; ALT: alanine transaminase; AST: aspartate aminotransferase; LDL: low-density lipoproteincholesterol; TG: triglycerides; HOMA-β%: homeostasis model assessment of beta cell function index; eGFR: estimated glomerular filtration rate; HDL: high density lipoprotein cholesterol; HOMA-IR: homeostatic model assessment of insulin resistance.
Correlation analysis revealed strong positive correlations between the lipids Cer (t33:7), LPC (18:0), LPC (O-16:0), and LPE (O-19:0) and the clinical parameters TC, BMI, FBG, and HbA1c, while the correlation with HOMA-β% was inverse [Figure 7C]. Conversely, PC (36:4) exhibited a positive correlation with HOMA-β% but a negative correlation with TC, BMI, FBG, HbA1c, and liver function indicators, suggesting its potential protective role in maintaining glucose homeostasis [Figure 7C].
DISCUSSION
Obesity is a major contributor to IGT and an independent risk factor for T2DM. In this study, individuals in the IGT group exhibited significantly higher FBG, FIns and HOMA-IR values than those in the OB group, suggesting that individuals with IGT display both obesity-related traits and insulin resistance. Participants with T2DM showed not only elevated glucose levels but also increased markers of hepatic dysfunction and dyslipidemia. The pathological overlap between obesity and diabetes is driven by shared mechanisms, including insulin resistance, oxidative stress, inflammation, and pro-thrombotic states[22,23]. Overnutrition in an obesogenic environment disrupts metabolic homeostasis and promotes lipid accumulation in non-adipose tissues - such as the liver, skeletal muscle, and vascular endothelium - resulting in ectopic fat deposition and contributing to insulin resistance, IGT, T2DM, and associated cardiovascular and hepatic diseases[24].
Unlike most previous studies that broadly examined metabolic profiling in T2DM, this work represents, to our knowledge, the first untargeted lipidomic investigation characterizing alterations across the continuum from metabolically healthy obesity to overt T2DM. Importantly, our findings suggest that early metabolic perturbations may already be present even among individuals with normal glycemia. Six major lipid classes (Cer, PE, LPC, DG, PC, and TG) were identified as key discriminative lipid species among the NC, OB, IGT, and OD groups. Notably, TG containing long-chain fatty acids was substantially elevated in the IGT group and dramatically increased in the OD group. Consistent with our results, previous studies reported altered TG and PC profiles in individuals with type 1 diabetes mellitus compared with non-diabetic controls, underscoring the involvement of specific lipid species in glucose dysregulation[25]. Excess TG accumulation can impair insulin signaling and contribute to glucose intolerance in both obesity and T2DM[26].
In pancreatic islets exposed to elevated FFA concentrations, TG accumulation and β-cell apoptosis become evident[27]. The excessive influx of FFAs, together with TG deposition, imposes metabolic stress that progressively impairs β-cell function. In severe obesity, sustained FFA oversupply exerts continuous secretory demand on β-cells, ultimately driving structural and functional deterioration that culminates in apoptosis. Enhanced TG lipolysis further increases intracellular FFA levels, diminishing β-cell responsiveness to glucose stimulation and thereby compromising insulin secretion[28,29]. Experimental models consistently support these observations. In Zucker diabetic rats maintained on high-fat diets[30] and in sand rats (Psammomys obesus) fed energy-dense diets, advanced obesity is characterized by hypoinsulinemia, elevated plasma FFA, and TG accumulation, which coincide with β-cell failure and apoptosis[31,32]. Similarly, isolated islets exposed to high FFA concentration show pronounced TG elevation and apoptotic changes[27]. Despite accumulating evidence implicating lipid-induced β-cell stress in the pathogenesis of diabetes, the contribution of lipid metabolism dysregulation, particularly FFA overload and lipid-mediated attenuation of insulin signaling[28,29], has not received adequate attention as a mechanistic driver of β-cell dysfunction.
Another key outcome of this study was the identification of six lipid species - two LPCs, one PC, one Cer, one PE, and one LPE - that were significantly associated with future T2DM risk. These results suggest that subclinical metabolic disturbances may already be present in individuals classified as normoglycemic, underscoring the potential of these lipid markers as early predictors of diabetes onset. Supporting this concept, a recent longitudinal study in a normoglycemic Chinese cohort identified distinct lipid co-regulatory networks that preceded the development of T2DM, expanding the range of known serum lipid predictors[33]. Similarly, findings from the Framingham Offspring Study demonstrated that a metabolite-based panel markedly improved diabetes risk prediction beyond conventional clinical variables among individuals with normal fasting glucose[34].
Mechanistic studies further support the biological relevance of the findings of this study. LPC, particularly LPC (16:0), has been shown to enhance insulin secretion through activation of G protein-coupled receptors GPR40, GPR55, and GPR119, thereby engaging Ca2+ signaling pathways[35]. In addition, LPC promotes glucose uptake by adipocytes, potentially lowering plasma glucose levels via upregulation of glucose transporter type 4 (GLUT4) expression[36]. Prior research has also linked elevated serum PE concentrations to insulin resistance, reinforcing the critical role of phospholipid remodeling as a key contributor to metabolic dysfunction[37].
The strengths of this investigation include a well-defined study population and a rigorous lipidomic approach that enabled high-resolution quantification of diverse lipid species. By using UHPLC-MS with lipid class-specific internal standards, we achieved precise identification and quantitation of serum lipids, allowing detection of subtle metabolic alterations across different stages of glucose dysregulation. This study represents the first comprehensive characterization of lipid profiles in obese Chinese individuals with varying degrees of metabolic impairment, highlighting specific lipid molecules that may drive the progression to T2DM.
Several limitations should nevertheless be acknowledged in this study. First, because this was a matched nested case-control study originally designed for lipidomic profiling in obese individuals, the possibility of collider bias cannot be excluded. Second, the relatively small sample size may have limited statistical power, emphasizing the need for validation in larger cohorts. Although the lipid markers identified in this study are not yet ready for clinical use, they serve as a valuable reference for future investigations into related lipid metabolites. Third, lipidomic measurements were derived from a single time point, which may not capture temporal changes in lipid metabolism; future longitudinal studies incorporating repeated sampling are therefore warranted. Finally, as all participants were of Chinese ethnicity, further research is needed to determine whether these findings generalize to other populations.
In summary, this lipidomic analysis of a Chinese cohort reveals distinct serum lipid alterations associated with insulin resistance and T2DM in the context of obesity. Several lipid species, particularly LPC, DG, PC and TG, emerge as promising biomarkers for early detection of OD. These findings deepen our understanding of lipid-mediated mechanisms driving metabolic disease progression and may inform more precise strategies for diabetes prevention and management.
DECLARATIONS
Acknowledgments
We especially acknowledge all the study participants for their invaluable contribution.
Authors’ contributions
Studies were designed by: Gao J, Peng Z, Huang S
Wrote the manuscript: Du J, Tang Y
Conducted the lipidomics study: Peng Z, Feng L
Performed sample collection and data acquisition: Xi L, Peng W, Jiang X
Conducted data interpretation: Du J, Ge X, Li W
Did project administration and manuscript review: Guo X, Xia L
Performed funding acquisition: Guo X, Peng Z, Huang S
All authors contributed to the writing and revision of this manuscript.
Availability of data and materials
The datasets supporting the results of this study are not publicly available due to confidentiality and ethical restrictions. Raw data is available from the authors upon request under appropriate confidentiality agreements.
AI and AI-assisted tools statement
During the preparation of this manuscript, the AI-assisted tool Nano Banana Pro (version 3.0, released 2026-03-26) was used solely for generating the Graphical Abstract. The Graphical Abstract was generated using Nano Banana Pro. The tool did not influence the study design, data collection, analysis, interpretation, or the scientific content of the work. All authors take full responsibility for the accuracy, integrity, and final content of the manuscript.
Financial support and sponsorship
This study was funded by the National Key Research and Development Program of China (grant numbers 2021YFC2701900 and 2021YFC2701903), the National Natural Science Foundation of China (grant numbers 82170869 and 82200951), the Shanghai Municipal Health Commission Clinical Research Project (grant number 202340014), the Research Fund of Shanghai Tongren Hospital, Shanghai Jiaotong University School of Medicine (grant number TRYJ2022LC05), and the Rising Star Programme in Tongren Hospital (grant number TRKYRC-xx202209).
Conflicts of interest
All authors declared that there are no conflicts of interest.
Ethical approval and consent to participate
This study was reviewed and approved by the Institutional Review and Ethics Board at Tongren Hospital, associated with Shanghai Jiao Tong University, with the approval number: 2022-049-01, dated 22 June 2023. All participants provided written informed consent to participate in the study.
Consent for publication
Informed consent for data publication was obtained from all individual participants included in the study.
Copyright
© The Author(s) 2026.
Supplementary Materials
REFERENCES
1. Xiao N, Ding Y, Cui B, et al. Navigating obesity: a comprehensive review of epidemiology, pathophysiology, complications and management strategies. TIME. 2024;2:100090.
2. Boutari C, DeMarsilis A, Mantzoros CS. Obesity and diabetes. Diabetes Res Clin Pract. 2023;202:110773.
3. Ali-Berrada S, Guitton J, Tan-Chen S, Gyulkhandanyan A, Hajduch E, Le Stunff H. Circulating sphingolipids and glucose homeostasis: an update. Int J Mol Sci. 2023;24:12720.
4. Chen L, Chen XW, Huang X, Song BL, Wang Y, Wang Y. Regulation of glucose and lipid metabolism in health and disease. Sci China Life Sci. 2019;62:1420-58.
5. He J, Zhang P, Shen L, et al. Short-chain fatty acids and their association with signalling pathways in inflammation, glucose and lipid metabolism. Int J Mol Sci. 2020;21:6356.
6. Ye R, Holland WL, Gordillo R, et al. Adiponectin is essential for lipid homeostasis and survival under insulin deficiency and promotes β-cell regeneration. Elife. 2014;3:e03851.
7. Johnston LW, Harris SB, Retnakaran R, et al. Association of NEFA composition with insulin sensitivity and beta cell function in the Prospective Metabolism and Islet Cell Evaluation (PROMISE) cohort. Diabetologia. 2018;61:821-30.
8. Hung SC, Chan TF, Chan HC, et al. Lysophosphatidylcholine impairs the mitochondria homeostasis leading to trophoblast dysfunction in gestational diabetes mellitus. Antioxidants. 2024;13:1007.
9. Huang YH, Schäfer-Elinder L, Wu R, Claesson HE, Frostegård J. Lysophosphatidylcholine (LPC) induces proinflammatory cytokines by a platelet-activating factor (PAF) receptor-dependent mechanism. Clin Exp Immunol. 1999;116:326-31.
10. Treede I, Braun A, Sparla R, et al. Anti-inflammatory effects of phosphatidylcholine. J Biol Chem. 2007;282:27155-64.
11. Chen M, Pan H, Dai Y, et al. Phosphatidylcholine regulates NF-κB activation in attenuation of LPS-induced inflammation: evidence from in vitro study. Anim Cells Syst. 2018;22:7-14.
12. Xu K, Shi L, Zhang B, et al. Distinct metabolite profiles of adiposity indices and their relationships with habitual diet in young adults. Nutr Metab Cardiovasc Dis. 2021;31:2122-30.
13. Stevens VL, Carter BD, McCullough ML, Campbell PT, Wang Y. Metabolomic profiles associated with BMI, waist circumference, and diabetes and inflammation biomarkers in women. Obesity. 2020;28:187-96.
14. Yin X, Willinger CM, Keefe J, et al. Lipidomic profiling identifies signatures of metabolic risk. EBioMedicine. 2020;51:102520.
15. Wahab RJ, Jaddoe VWV, Voerman E, et al. Maternal body mass index, early-pregnancy metabolite profile, and birthweight. J Clin Endocrinol Metab. 2022;107:e315-27.
16. Kojta I, Chacińska M, Błachnio-Zabielska A. Obesity, bioactive lipids, and adipose tissue inflammation in insulin resistance. Nutrients. 2020;12:1305.
17. Lair B, Laurens C, Van Den Bosch B, Moro C. Novel insights and mechanisms of lipotoxicity-driven insulin resistance. Int J Mol Sci. 2020;21:6358.
18. Imierska M, Kurianiuk A, Błachnio-Zabielska A. The influence of physical activity on the bioactive lipids metabolism in obesity-induced muscle insulin resistance. Biomolecules. 2020;10:1665.
19. Poynten AM, Gan SK, Kriketos AD, et al. Nicotinic acid-induced insulin resistance is related to increased circulating fatty acids and fat oxidation but not muscle lipid content. Metabolism. 2003;52:699-704.
20. Park S, Sadanala KC, Kim EK. A metabolomic approach to understanding the metabolic link between obesity and diabetes. Mol Cells. 2015;38:587-96.
21. Feng C, Wang H, Lu N, et al. Log-transformation and its implications for data analysis. Shanghai Arch Psychiatry. 2014;26:105-9.
22. Hermanides J, Cohn DM, Devries JH, et al. Venous thrombosis is associated with hyperglycemia at diagnosis: a case-control study. J Thromb Haemost. 2009;7:945-9.
23. La Sala L, Prattichizzo F, Ceriello A. The link between diabetes and atherosclerosis. Eur J Prev Cardiol. 2019;26:15-24.
24. La Sala L, Pontiroli AE. Prevention of diabetes and cardiovascular disease in obesity. Int J Mol Sci. 2020;21:8178.
25. Suvitaival T. Lipidomic abnormalities during the pathogenesis of type 1 diabetes: a quantitative review. Curr Diab Rep. 2020;20:46.
26. Czech MP, Tencerova M, Pedersen DJ, Aouadi M. Insulin signalling mechanisms for triacylglycerol storage. Diabetologia. 2013;56:949-64.
27. Donath MY, Gross DJ, Cerasi E, Kaiser N. Hyperglycemia-induced beta-cell apoptosis in pancreatic islets of Psammomys obesus during development of diabetes. Diabetes. 1999;48:738-44.
28. Lee Y, Hirose H, Ohneda M, Johnson JH, McGarry JD, Unger RH. Beta-cell lipotoxicity in the pathogenesis of non-insulin-dependent diabetes mellitus of obese rats: impairment in adipocyte-beta-cell relationships. Proc Natl Acad Sci U S A. 1994;91:10878-82.
29. Lupi R, Dotta F, Marselli L, et al. Prolonged exposure to free fatty acids has cytostatic and pro-apoptotic effects on human pancreatic islets: evidence that beta-cell death is caspase mediated, partially dependent on ceramide pathway, and Bcl-2 regulated. Diabetes. 2002;51:1437-42.
30. Pick A, Clark J, Kubstrup C, et al. Role of apoptosis in failure of beta-cell mass compensation for insulin resistance and beta-cell defects in the male Zucker diabetic fatty rat. Diabetes. 1998;47:358-64.
31. Sesti G. Apoptosis in the beta cells: cause or consequence of insulin secretion defect in diabetes? Ann Med. 2002;34:444-50.
32. Jörns A, Tiedge M, Ziv E, Shafrir E, Lenzen S. Gradual loss of pancreatic beta-cell insulin, glucokinase and GLUT2 glucose transporter immunoreactivities during the time course of nutritionally induced type-2 diabetes in Psammomys obesus (sand rat). Virchows Arch. 2002;440:63-9.
33. Lu J, Lam SM, Wan Q, et al. High-coverage targeted lipidomics reveals novel serum lipid predictors and lipid pathway dysregulation antecedent to type 2 diabetes onset in normoglycemic chinese adults. Diabetes Care. 2019;42:2117-26.
34. Merino J, Leong A, Liu CT, et al. Metabolomics insights into early type 2 diabetes pathogenesis and detection in individuals with normal fasting glucose. Diabetologia. 2018;61:1315-24.
35. Drzazga A, Kristinsson H, Sałaga M, et al. Lysophosphatidylcholine and its phosphorothioate analogues potentiate insulin secretion via GPR40 (FFAR1), GPR55 and GPR119 receptors in a different manner. Mol Cell Endocrinol. 2018;472:117-25.
36. Yea K, Kim J, Yoon JH, et al. Lysophosphatidylcholine activates adipocyte glucose uptake and lowers blood glucose levels in murine models of diabetes. J Biol Chem. 2009;284:33833-40.
Cite This Article
 Open Access
How to Cite
Download Citation
Export Citation File:
Type of Import
Tips on Downloading Citation
Citation Manager File Format
Type of Import
Direct Import: When the Direct Import option is selected (the default state), a dialogue box will give you the option to Save or Open the downloaded citation data. Choosing Open will either launch your citation manager or give you a choice of applications with which to use the metadata. The Save option saves the file locally for later use.
Indirect Import: When the Indirect Import option is selected, the metadata is displayed and may be copied and pasted as needed.
About This Article
Copyright

Data & Comments
Data
0










Comments
Comments must be written in English. Spam, offensive content, impersonation, and private information will not be permitted. If any comment is reported and identified as inappropriate content by OAE staff, the comment will be removed without notice. If you have any queries or need any help, please contact us at [email protected].