

fig7
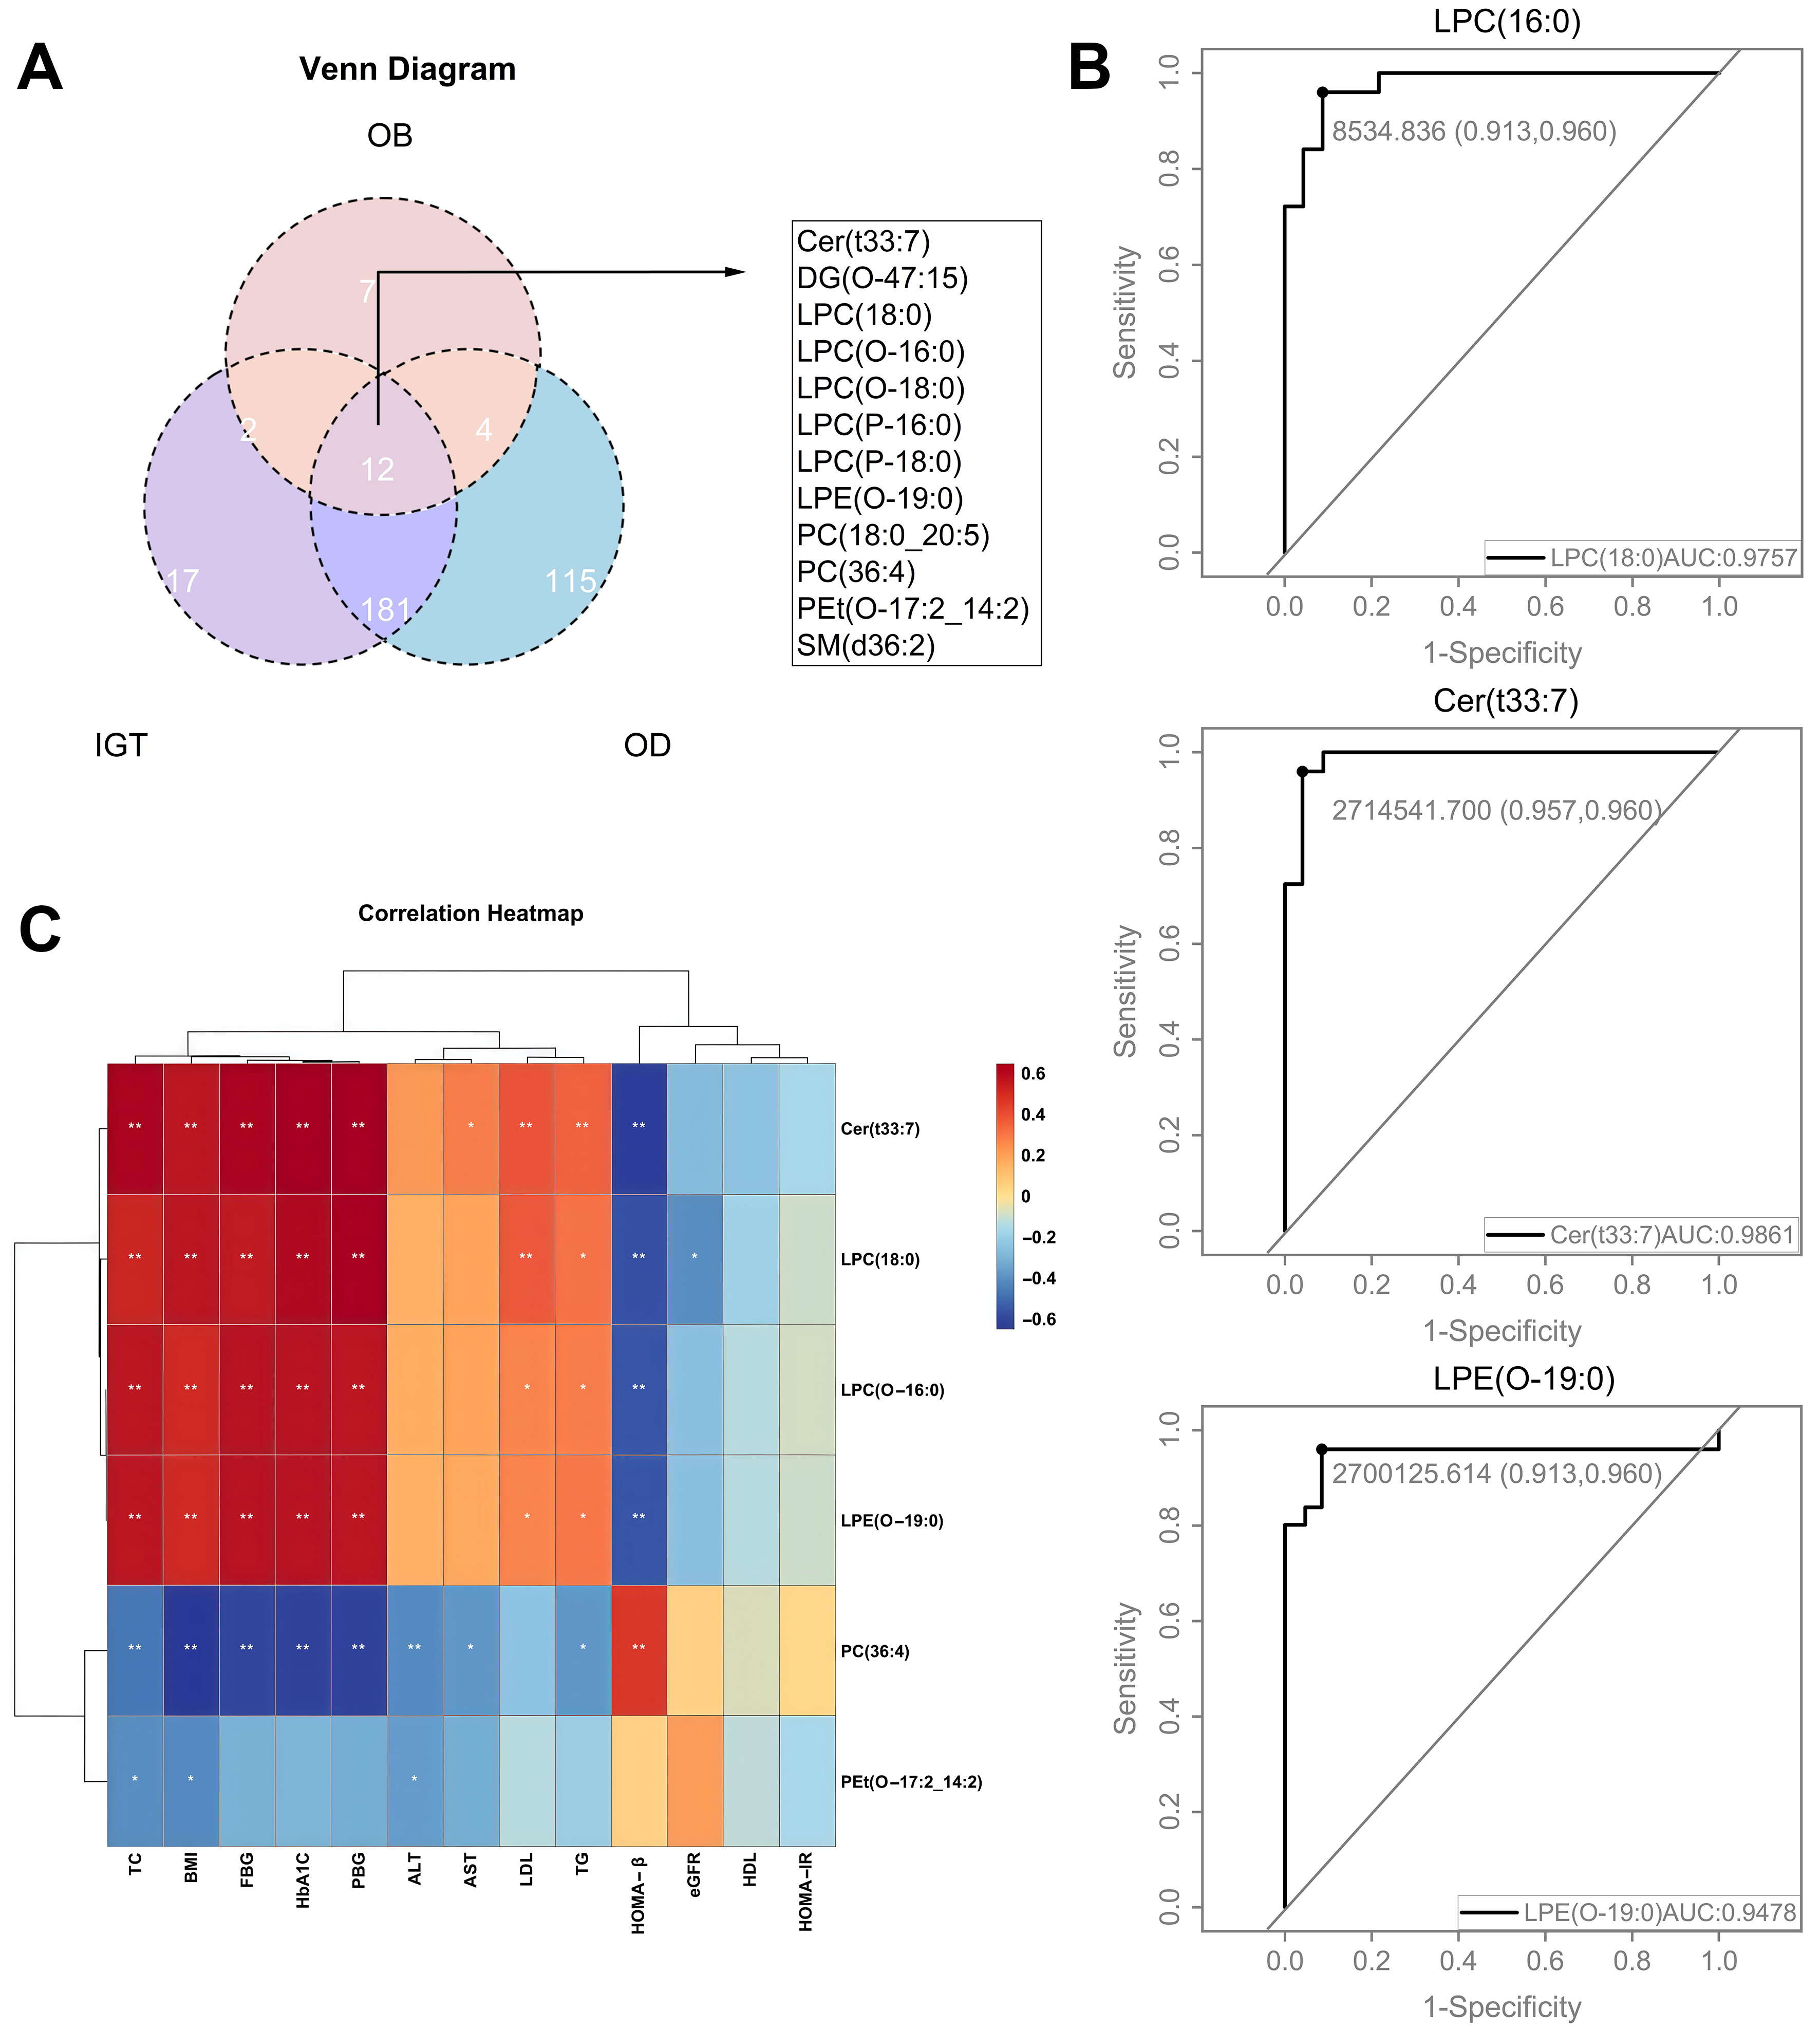
Figure 7. Shared differential lipids in the OB, IGT, and OD groups and ROC curves for models forecasting the onset of T2DM using specific lipids. (A) Venn diagram depicting differential lipids in the OB, IGT and OD groups; (B) ROC curves depicting the diagnostic efficacy of specific lipids for obesity-related diabetes, including LPC (16:0), LPC (O-16:0), Cer (t33:7), LPE (O-19:0), PC (36:4) and Pet (O-17:2_14:2); (C) Correlations between six specific lipids and metabolic indexes in the OD group versus the NC group (C). NC: Normal control; OB: obesity; IGT: impaired glucose tolerance; OD: obesity-related diabetes; ROC: receiver operating characteristic; Cer: ceramide; DG: diacylglycerol; LPC: lysophosphatidylcholine; LPE: lysophosphatidylethanolamine; PC: phosphatidylcholine; PE: phosphatidylethanolamine; SM: sphingomyelins; TC: total cholesterol; BMI: body mass index; FBG: fasting blood glucose; PBG: Postprandial Blood Glucose; HbA1c: glycated hemoglobin; ALT: alanine transaminase; AST: aspartate aminotransferase; LDL: low-density lipoproteincholesterol; TG: triglycerides; HOMA-β%: homeostasis model assessment of beta cell function index; eGFR: estimated glomerular filtration rate; HDL: high density lipoprotein cholesterol; HOMA-IR: homeostatic model assessment of insulin resistance.





