

fig6
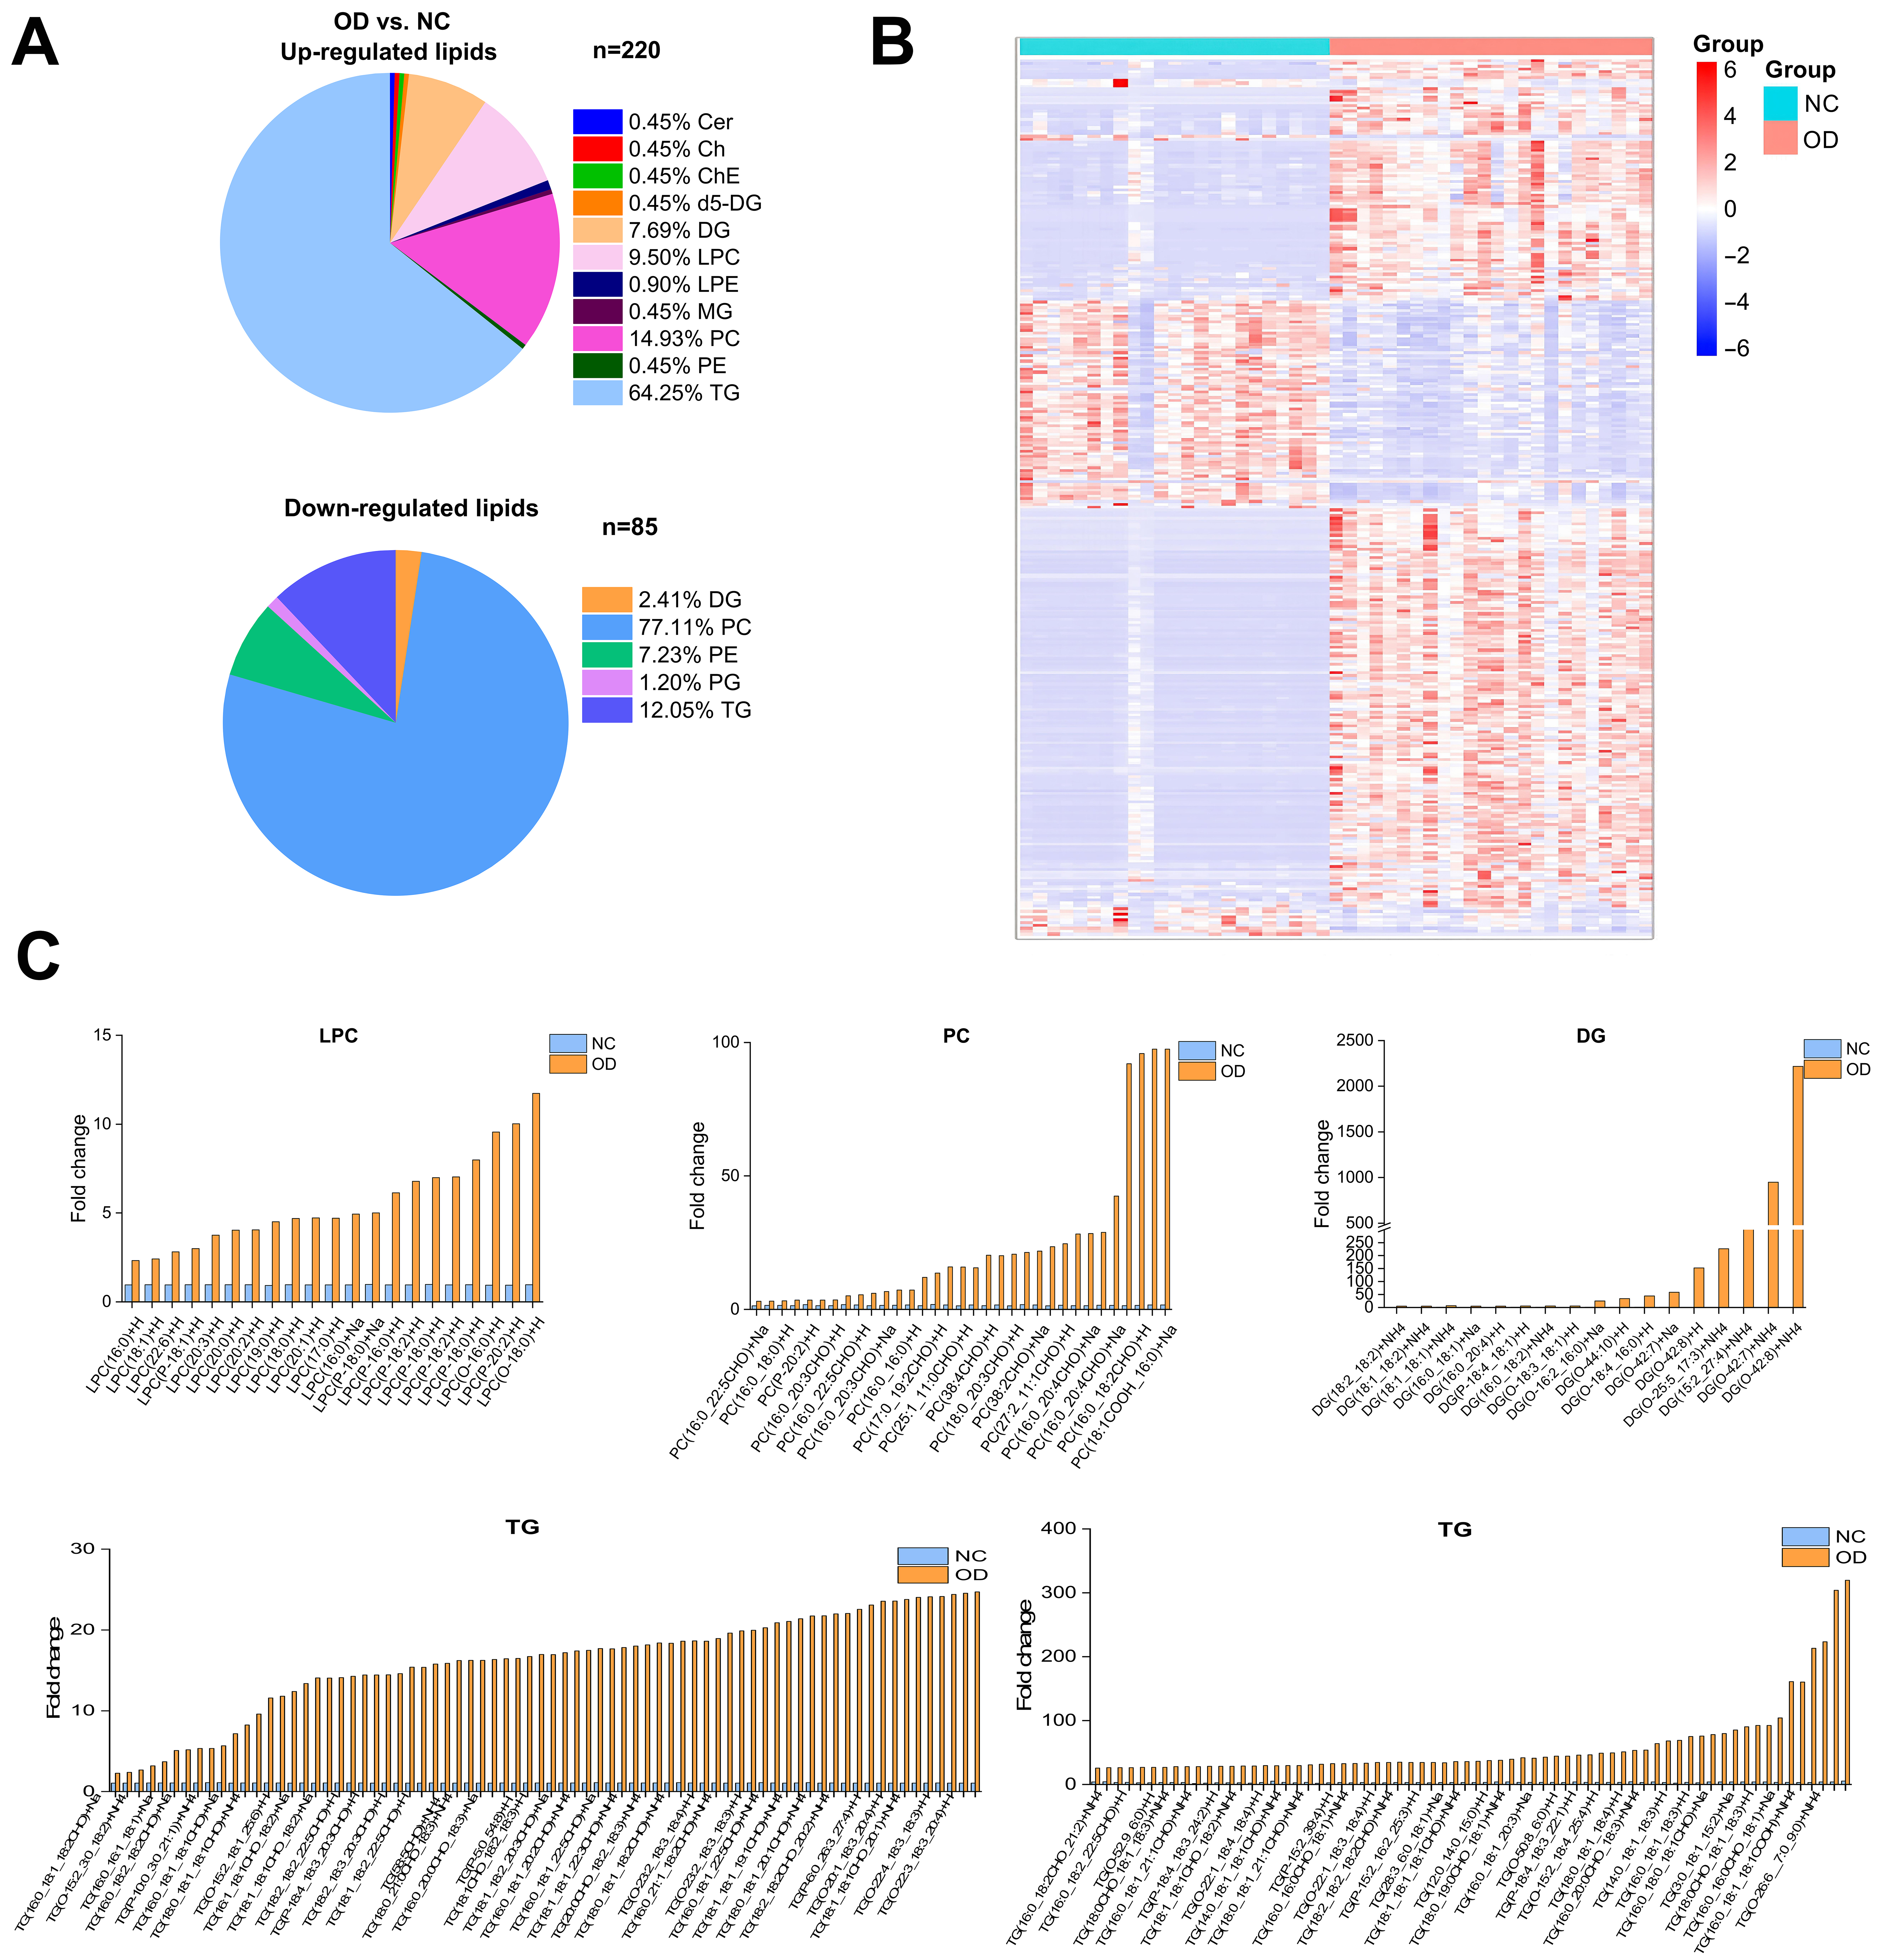
Figure 6. Significantly different lipids and lipidomic changes related to T2DM in the OD group relative to the control group. (A) Pie charts depicting the proportion of significantly differential lipids in the OD group versus the NC group; (B) Hierarchical clustering heatmap showing the 305 lipids in which a significant difference existed between the OD group and the NC group (adjusted VIP > 1, P < 0.05, FC ≥ 2 or ≤ -0.5). Data are presented as Z-score by row, with each individual row representing 1 of the 208 significantly different lipids; (C) Comparison of TG, DG, PC and LPC species between the OD group and the NC group. NC: Normal control; OD: obesity-related diabetes; Cer: ceramide; Ch: cholesterol; ChE: cholesteryl ester; DG: diacylglycerol; LPC: lysophosphatidylcholine; LPE: lysophosphatidylethanolamine; PC: phosphatidylcholine; PE: phosphatidylethanolamine; TG: triacylglycerol; MG: monoglyceride.





