

fig4
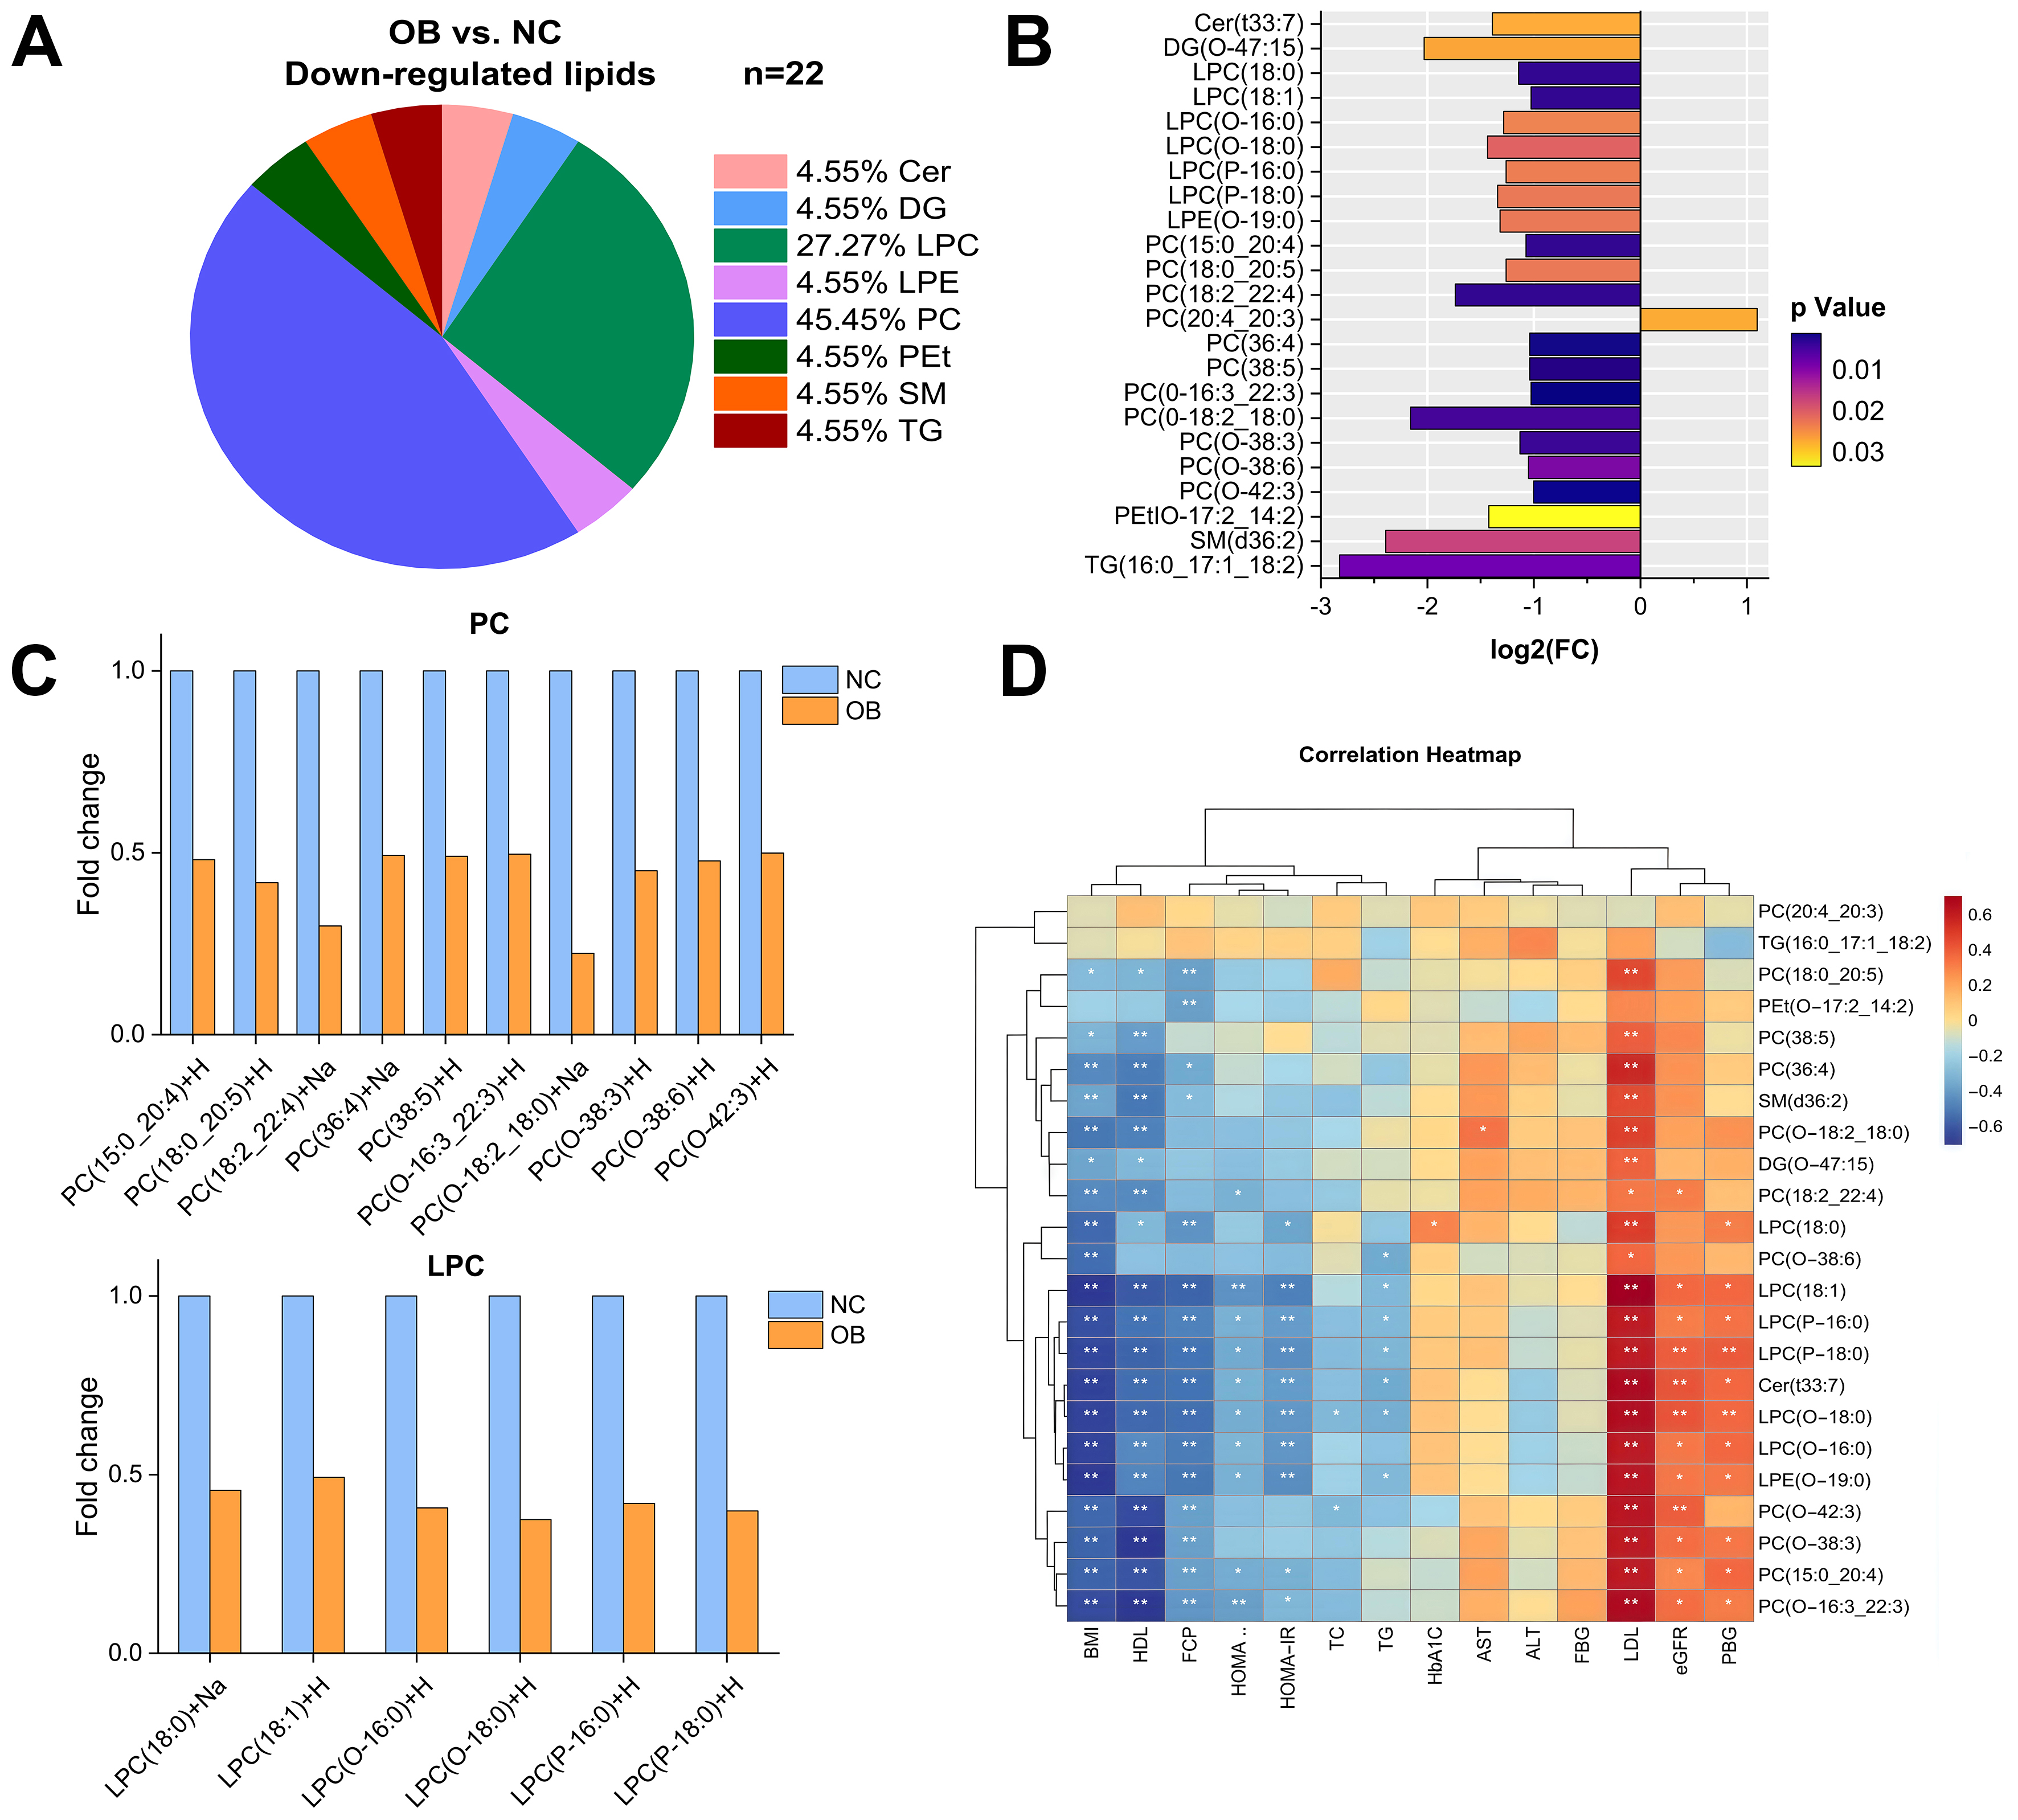
Figure 4. Change in lipidomic signatures and differences in lipid classes in obese individuals relative to the control group. (A) Pie charts depicting the proportion of significantly differential lipids in OB group versus NC group; (B) 23 differentially regulated lipids were associated with obesity group (adjusted VIP > 1, FC ≥ 0.5 or ≤ -0.5); (C) Comparison of PC and LPC lipid species between the OB group and the NC group; (D) Correlations between differential lipids and metabolic indexes in the total study sample in the OB group versus the NC group. NC: Normal control; OB: obesity; VIP: variable influence on projection; FC: fold change; Cer: ceramide; DG: diacylglycerol; PC: phosphatidylcholine; LPC: lysophosphatidylcholine; LPE: lysophosphatidylethanolamine; PEt: phosphatidylethanol; SM: sphingomyelins; TG: triacylglycerol.





