

fig3
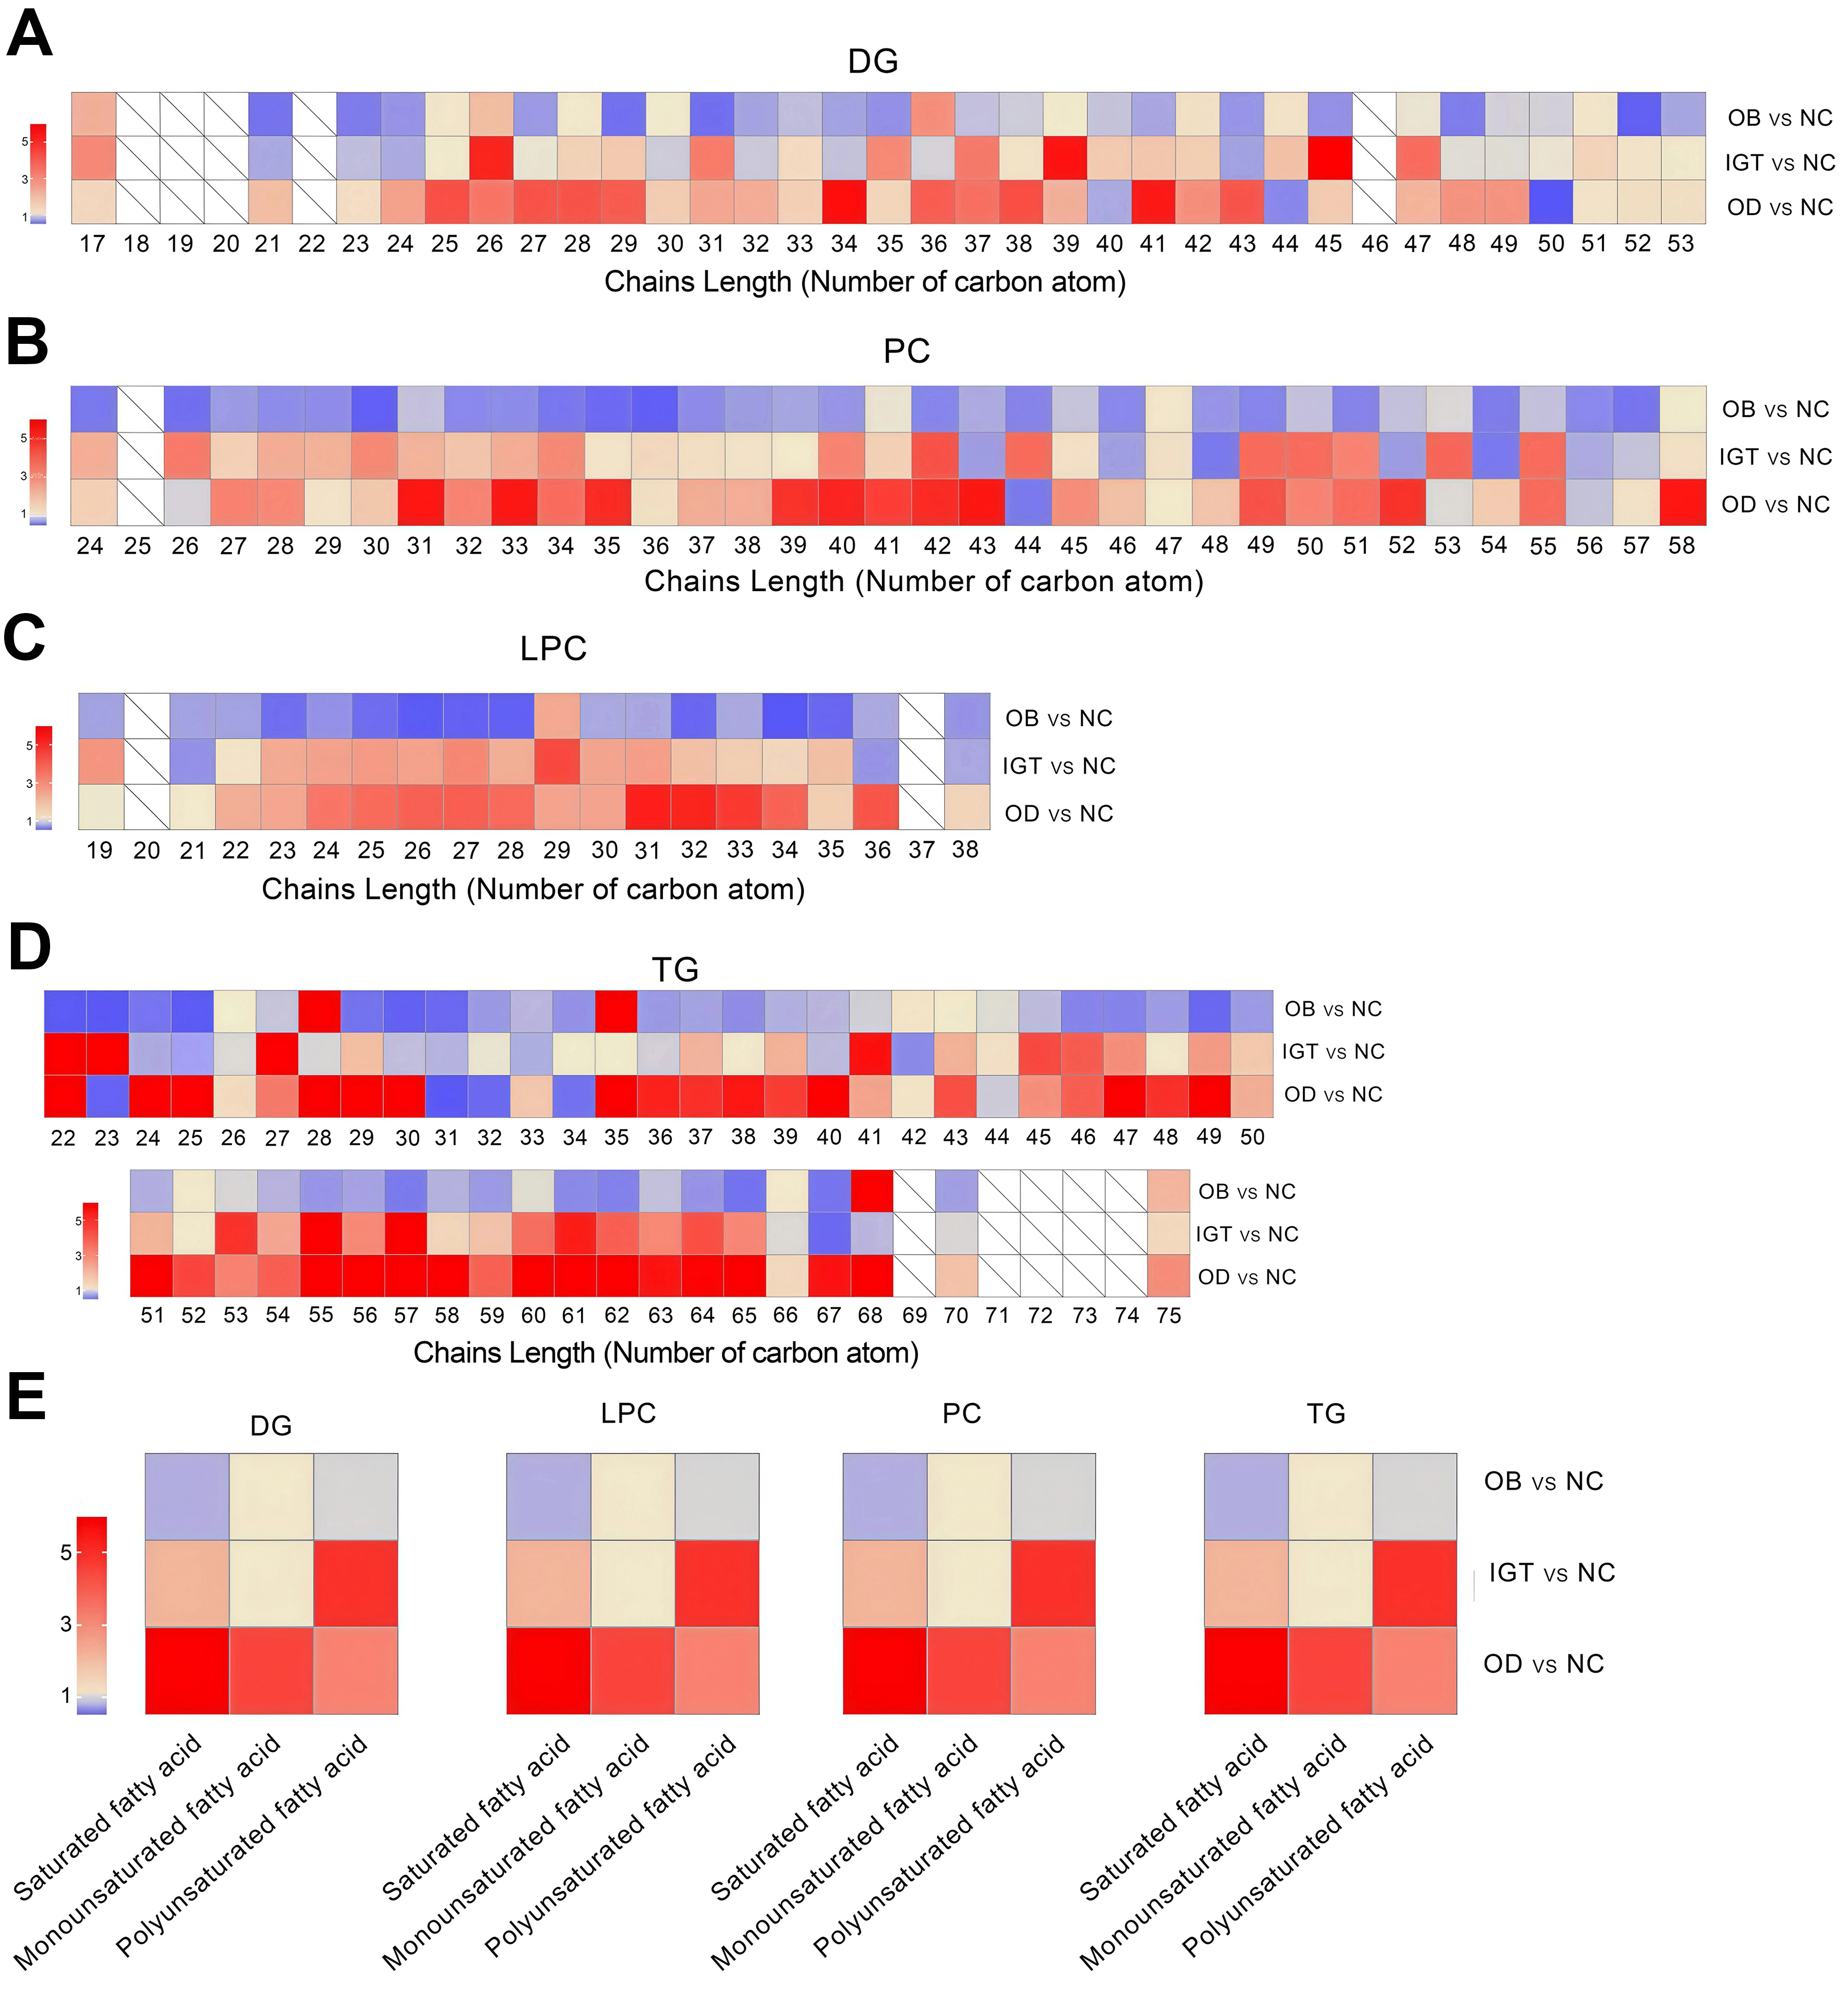
Figure 3. Relative abundance of chain length and grouped fatty acid saturation within DG, PC, LPC and TG. Analysis of double bond numbers across lipid chains within DG (A), PC (B), LPC (C), and TG (D) species. (E) Alterations in fatty acid chain length (number of carbon atoms) within DG, PC, LPC, and TG species in four groups. NC: Normal control; OB: obesity; IGT: impaired glucose tolerance; OD: obesity-related diabetes; DG: diacylglycerol; PC: phosphatidylcholine; LPC: lysophosphatidylcholine; TG: triacylglycerol.





