


Differential expression and prognostic significance of ANKRD6 in colon adenocarcinoma: a pan-cancer analysis and pathway-specific investigation
 0
0 Abstract
Aim: This study aims to investigate the expression of the Ankyrin Repeat Domain 6 (ANKRD6) gene in Colon Adenocarcinoma (COAD) and its regulatory role in key signaling pathways, evaluating its clinical value as a potential therapeutic target.
Methods: To investigate the functional role of ANKRD6 in colon adenocarcinoma (COAD), we systematically analyzed its prognostic relevance, epigenetic regulation, and association with tumor stemness using publicly available TCGA (The Cancer Genome Atlas)-COAD data. Gene set variation analysis (GSVA) was applied to identify signaling pathways potentially modulated by ANKRD6. Least Absolute Shrinkage and Selection Operator (LASSO) regression was employed to identify key genes within the Wnt signaling pathway that are significantly associated with COAD patient survival. Immunohistochemical staining was performed to confirm ANKRD6 protein expression in COAD tissues. To investigate functional consequences, ANKRD6 was knocked down using small interfering RNAs, and subsequent quantitative real-time polymerase chain reaction and Western blot assays were applied to measure alterations in representative Wnt pathway-related genes and proteins.
Results: ANKRD6 expression was significantly associated with DNA methylation patterns, RNA modification regulators, and tumor stemness features in COAD. These findings suggest that epigenetic and post-transcriptional mechanisms may underlie the regulatory role of ANKRD6 in COAD pathogenesis. GSVA analysis revealed that ANKRD6 significantly influences and negatively regulates Wnt signaling pathway activity. LASSO regression analysis highlighted 25 Wnt pathway genes relevant to COAD patient survival, with ANKRD6 expression significantly correlated with multiple targets. Furthermore, immunohistochemical staining confirmed that ANKRD6 protein was markedly upregulated in COAD tissues. Upon ANKRD6 knockdown, the messenger RNA levels of WNT7A (Wnt Family Member 7A), JNK (Mitogen-Activated Protein Kinase 8), and RHOA (Ras Homolog Family Member A), as well as WNT7A protein levels, showed a significant decrease in the Wnt signaling pathway.
Conclusions: ANKRD6 plays a critical role in the development and progression of COAD by regulating the Wnt signaling pathway. It holds potential as a therapeutic target, warranting further investigation into its specific regulatory mechanisms and clinical applications.

Keywords
INTRODUCTION
Colorectal cancer (CRC) remains one of the most prevalent malignant tumors worldwide and continues to pose a major threat to public health due to its high incidence and mortality rates[1,2]. Recent epidemiological studies have identified a distinct favorable subset of cancers of unknown primary (CUP) with a colorectal profile - commonly referred to as “CRC-like CUP” - characterized by CK7-/CK20+/CDX2+ immunophenotype. This subset is now recognized in the 2023 European Society for Medical Oncology (ESMO) guidelines as a site-specific CUP category managed according to CRC treatment paradigms, and may partly contribute to the rising incidence trends reported for CRC in population registries[3].
While traditional treatment modalities, including surgery, radiotherapy, and chemotherapy, remain the mainstay of care for early-stage CRC, their effectiveness is limited in advanced or recurrent disease[4]. It is also important to note that patients aged ≥ 65 years are more prone to severe postoperative complications, yet there is no consensus that chronological age independently affects survival outcomes; prognosis is largely determined by stage at presentation, primary tumor site, comorbidities, and treatment type[5,6]. These factors highlight the urgent need for robust molecular biomarkers to refine risk stratification and guide individualized therapy, especially in vulnerable patient populations[7].
To address this unmet need, we first performed a pan-cancer analysis of Ankyrin Repeat Domain 6 (ANKRD6) to map its expression and prognostic landscape across malignancies, revealing both shared molecular patterns and tumor-specific features[8,9]. Among them, colon adenocarcinoma (COAD) emerged as the most clinically relevant subtype with a significant adverse prognostic association, prompting us to focus on its mechanistic investigation. ANKRD6, a protein-coding gene known to play crucial roles in diverse developmental and signaling processes[10], has therefore garnered increasing attention. Although ANKRD6 has been implicated in several cancer types, its biological function and regulatory mechanisms in COAD remain largely unexplored[11,12].
We comprehensively assessed ANKRD6 in COAD, highlighting its roles in prognosis, epigenetic regulation, stemness-related characteristics, and therapeutic potential. Furthermore, the Wnt signaling pathway, which is closely associated with the initiation and progression of COAD, has recently emerged as a critical therapeutic target[13-15]. To further elucidate the impact of ANKRD6 on Colon Adenocarcinoma-related signaling pathways, we introduced Gene Set Variation Analysis (GSVA), an innovative method that allows for the systematic screening of pathways potentially regulated by ANKRD6, thus uncovering its underlying mechanisms. GSVA, as an unsupervised analytical method, evaluates the enrichment of gene sets across different samples, revealing differences in complex biological processes with high sensitivity and broad applicability[16-18]. Through Least Absolute Shrinkage and Selection Operator (LASSO) regression, key Wnt pathway genes associated with ANKRD6 and COAD survival were uncovered, strengthening the mechanistic basis for ANKRD6 regulation in this cancer.
This work comprehensively delineates the role of ANKRD6 in COAD, incorporating pan-cancer analysis and GSVA to uncover its regulatory signaling mechanisms. These findings not only provide new insights into the function of ANKRD6 in COAD but also lay the groundwork for its potential application as a therapeutic target.
METHODS
Clinical data collection
Retrospective analysis of publicly available datasets was conducted with approval from the Ethics Committee of the First Affiliated Hospital of Wannan Medical College (Yijishan Hospital), Wuhu, China (Approval No. 2024232). All analyses complied with the principles of the Declaration of Helsinki. Pan-cancer RNA sequencing (RNA-seq) and clinical data were obtained from the UCSC Xena repository (https://xenabrowser.net/), encompassing 10,535 tumor and normal tissue samples and 11,123 paired samples across 29 cancer types. Expression data for ANKRD6 (ENSG00000135299) were extracted from the TCGA (The Cancer Genome Atlas) Pan-Cancer dataset.
For the TCGA-COAD cohort, a total of 521 RNA-seq samples and 41 adjacent normal tissues were collected. Following data integration and quality control, 461 samples with both transcriptomic and complete clinical information were included in the final analysis. To enhance the robustness and generalizability of the findings, an independent external validation cohort (GSE39582) containing 585 CRC samples and 19 adjacent normal tissues was obtained from the Gene Expression Omnibus (GEO) database
Cancer types represented by fewer than three samples were excluded to ensure statistical robustness. After filtering, all retained datasets met the inclusion criteria for data completeness, consistency, and quality control. A schematic overview of the analytical workflow is illustrated in Figure 1.
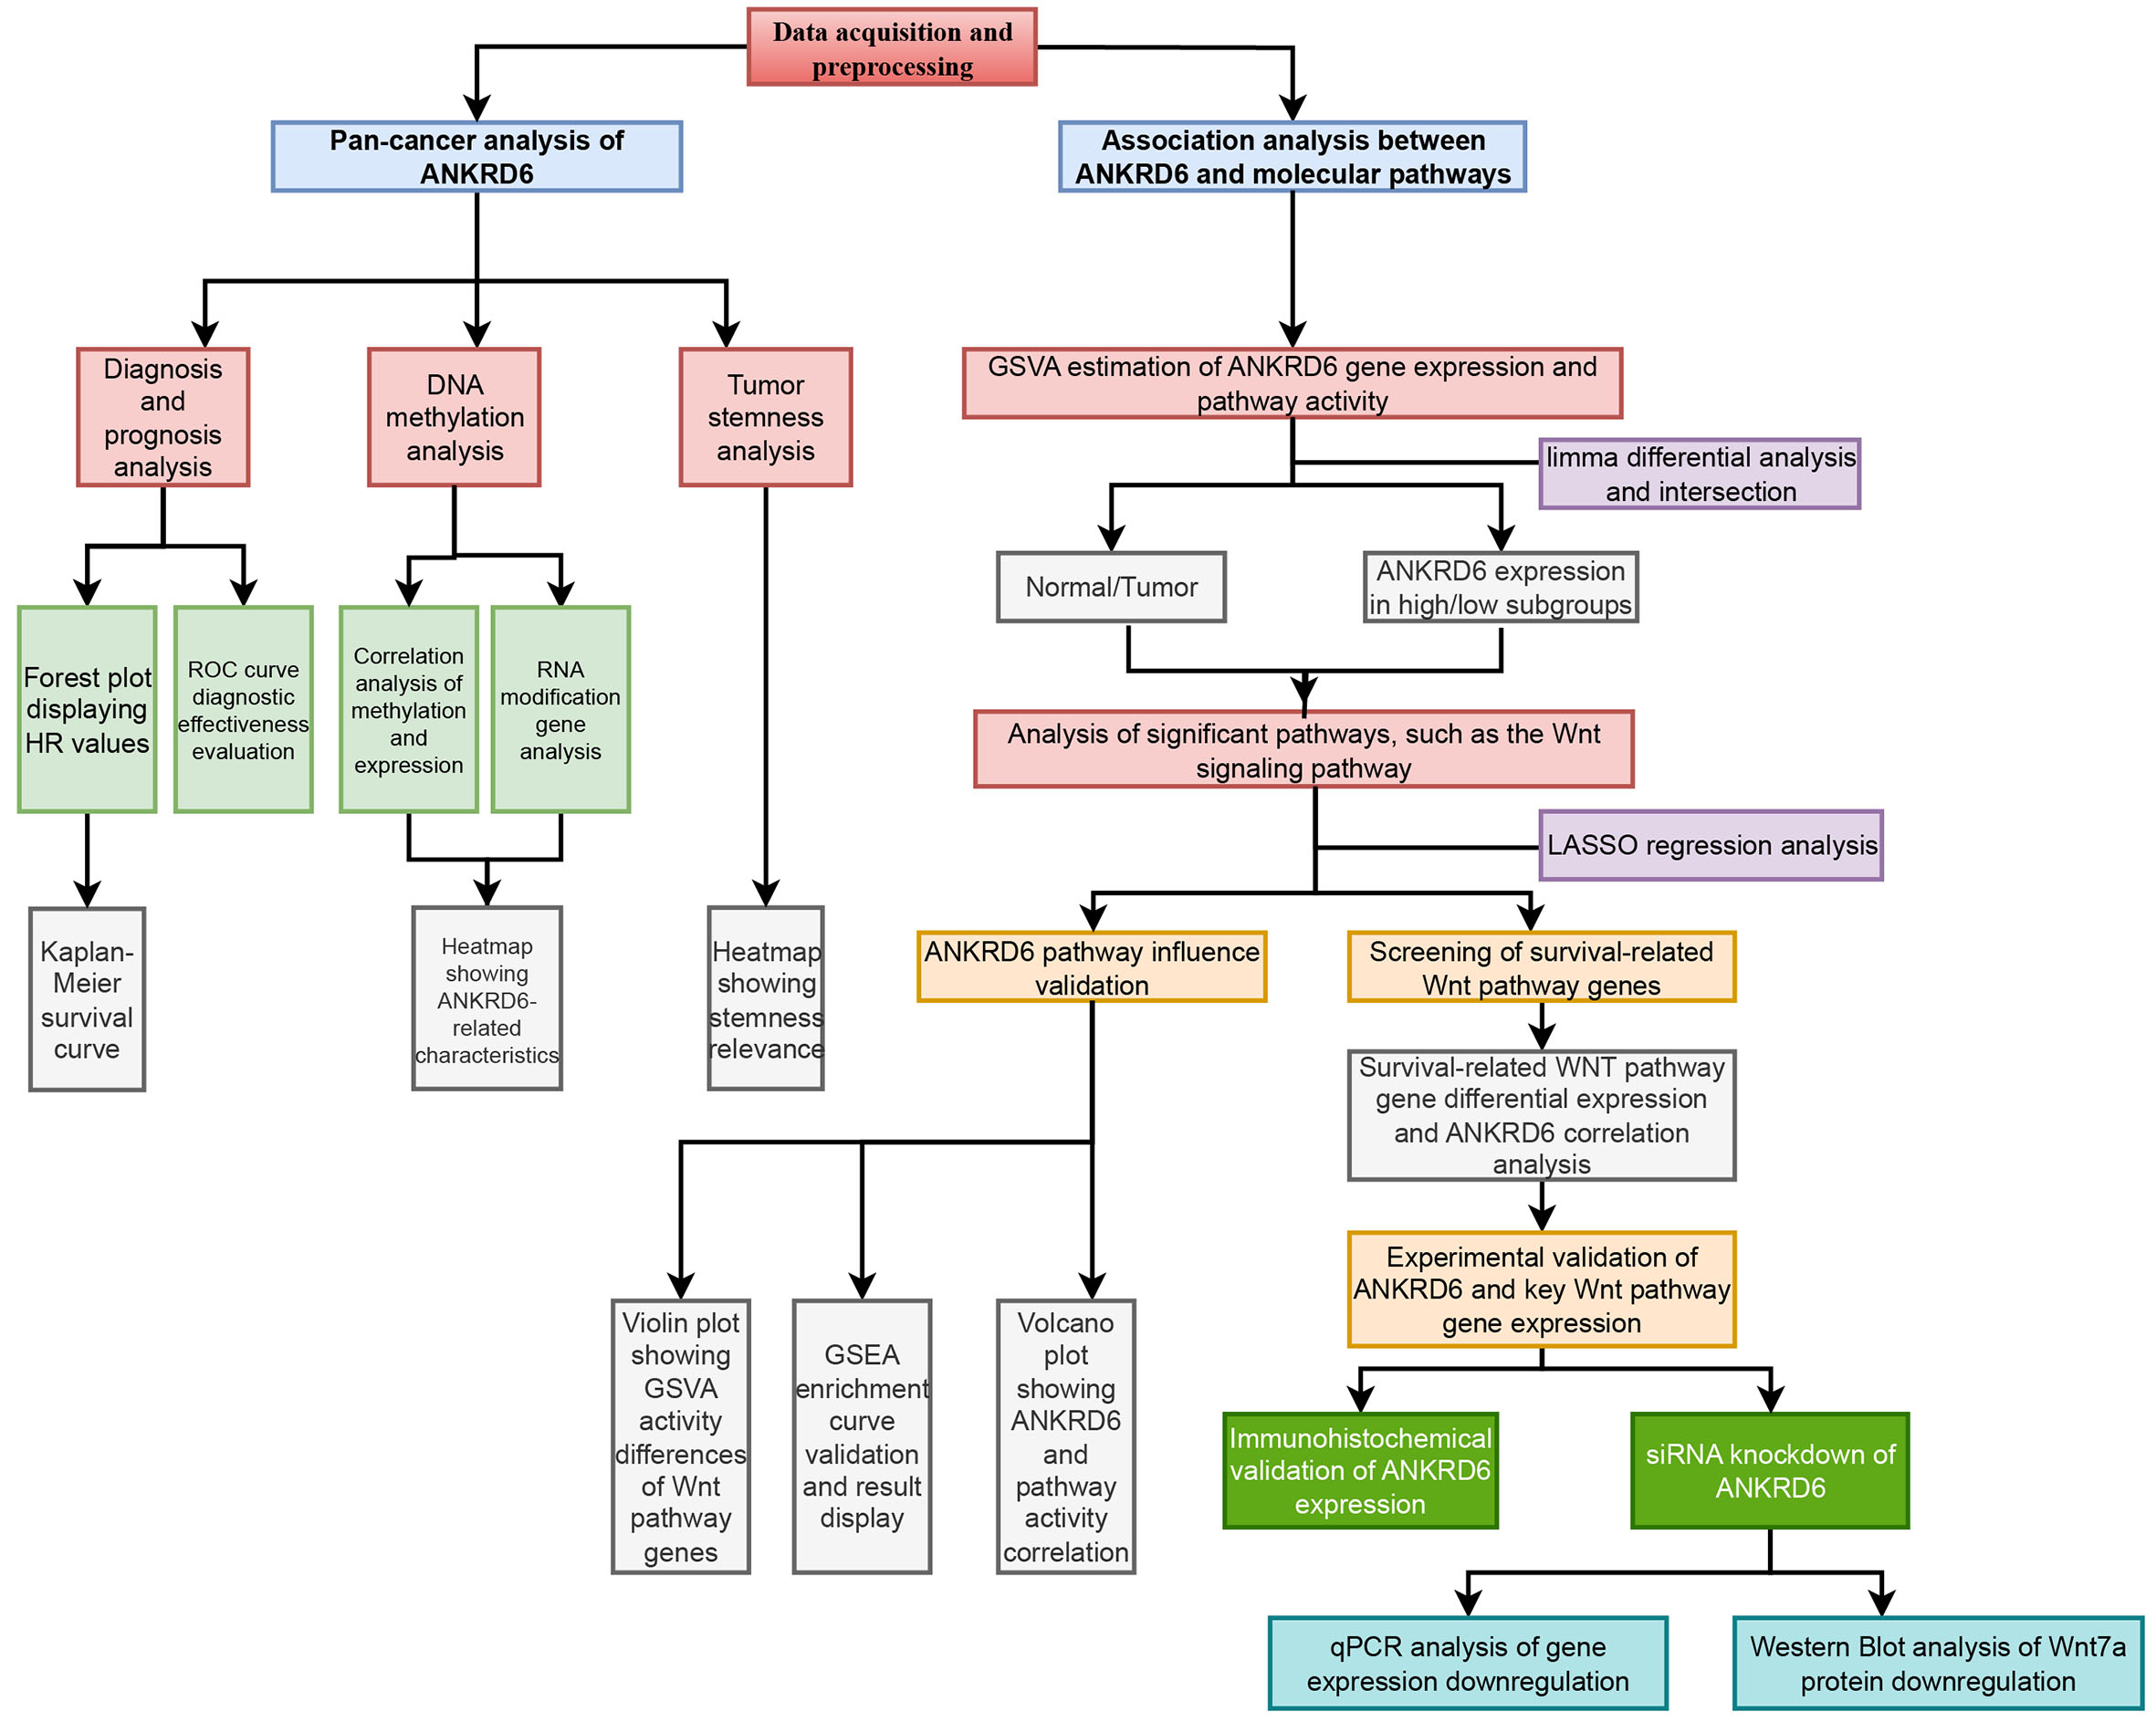
Figure 1. Workflow of ANKRD6 pan-cancer and pathway association analysis.
Prognostic and diagnostic value analysis
Based on the datasets described above, the prognostic and diagnostic significance of ANKRD6 was systematically evaluated. Patients with incomplete clinical follow-up information, missing survival data, or lacking RNA-seq expression profiles were excluded to ensure data integrity and minimize analytical bias. The prognostic impact of ANKRD6 expression was assessed across cancer types using Cox proportional hazards regression, and the Schoenfeld residuals test was applied to verify the proportional hazards assumption. Kaplan-Meier survival analyses were conducted with the “survminer” package (v0.4.9), and survival differences between high- and low-expression groups were compared using the log-rank test
Comprehensive analysis of methylation and RNA modifications
The DNA methylation landscape of ANKRD6 across multiple cancer types was analyzed using Illumina Human Methylation 450K array data obtained from the TCGA database. Data preprocessing, normalization, and probe annotation were performed using the “TCGAbiolinks” and “minfi” packages, following standard quality-control procedures. The methylation level of ANKRD6 was quantified as Beta values (β = M/[M + U + 100]), representing the ratio of methylated to total signal intensity. Comparisons of methylation levels between tumor and adjacent normal tissues were conducted using the “limma” package, with adjusted P < 0.05 considered statistically significant. To further explore potential post-transcriptional regulatory mechanisms, ANKRD6 expression was correlated with RNA modification-related genes, including N1-methyladenosine (m1A), 5-methylcytosine (m5C), and N6-methyladenosine (m6A) regulators. This analysis was performed through the SangerBox 3.0 platform, and the correlations were visualized as heatmaps, where red indicates positive and blue indicates negative associations.
Correlation between ANKRD6 expression and tumor stemness characteristics
To investigate the relationship between ANKRD6 expression and tumor stemness, gene expression and methylation-based stemness indices were retrieved from the TCGA Pan-cancer dataset via the UCSC Xena platform. Stemness scores were calculated according to the machine-learning framework proposed in “Machine Learning Identifies Stemness Features Associated with Oncogenic Dedifferentiation”[19]. This framework provides multiple quantitative indices, including RNA Expression-based Stemness Score (RNAss), Epigenetically Regulated Expression-based Stemness Score (EREG.EXPss), DNA Methylation-based Stemness Score (DNAss), Epigenetically Regulated Methylation-based Stemness Score (EREG.METHss), Differentially Methylated Position Stemness Score (DMPss), and Enhancer-based Stemness Score (ENHss). Spearman correlation analysis was performed to evaluate the associations between ANKRD6 expression and each stemness index across tumor types. Correlation coefficients and P-values were computed and visualized as heatmaps using the “pheatmap” package, where red indicates a positive correlation and blue indicates a negative correlation.
Differential pathway activity analysis of ANKRD6 in COAD
To explore the association between ANKRD6 expression and molecular pathway activity in COAD, RNA-seq profiles of 521 tumor and 41 adjacent normal samples from the TCGA-COAD cohort were analyzed. Low-abundance genes (mean expression < 1) were excluded, and expression values were normalized using log2(x + 1) transformation. GSVA was performed to quantify relative pathway activity across samples using Kyoto Encyclopedia of Genes and Genomes (KEGG), Gene Ontology-Biological Process (GO-BP), and Hallmark gene sets obtained from the Molecular Signatures Database (MSigDB) resource. Samples were stratified by tumor vs. normal status and by high vs. low ANKRD6 expression (based on the median value). Differential analysis of GSVA enrichment scores was conducted with the “limma” package, applying Benjamini-Hochberg false discovery rate (FDR) correction. Pathways with an absolute log2 fold change
Screening and functional analysis of Wnt signaling pathway genes associated with COAD survival
To investigate the association between ANKRD6 and Wnt signaling in COAD, a total of 151 Wnt pathway-related genes were obtained from the MSigDB database. The LASSO regression model was applied to identify genes significantly associated with overall survival (OS) in COAD. LASSO regression with L1 regularization was used to minimize multicollinearity and enhance model interpretability, a common issue in high-dimensional gene expression data. The analysis was performed using the “glmnet” R package, and 10-fold cross-validation was implemented to determine the optimal penalty parameter (λ) based on the minimum mean squared error (MSE) criterion. The resulting coefficient profiles and optimal λ value were visualized to illustrate variable selection and model shrinkage trends. For downstream validation, the differential expression of survival-associated Wnt genes was assessed using TCGA-COAD transcriptomic data. Two comparison strategies were adopted: (1) Tumor vs. adjacent normal tissues, to evaluate expression alterations during malignant transformation; and (2) High vs. low ANKRD6 expression groups (stratified by median value), to explore potential regulatory associations. Group comparisons were performed using the unpaired Wilcoxon rank-sum test, and statistical significance was defined as P < 0.05. Results were visualized through violin plots generated with the “ggpubr” package, depicting both expression distribution and intergroup variability. This analysis identified a subset of survival-associated Wnt pathway genes correlated with ANKRD6 expression, forming the basis for subsequent pathway-level and mechanistic investigations.
Single-cell and spatial transcriptomic analysis
Single-cell transcriptomic data for ANKRD6 were obtained from the TISCH database (http://tisch.comp-genomics.org) to evaluate its cellular localization across major lineages within CRC. Expression patterns were visualized on Uniform Manifold Approximation and Projection (UMAP ) embeddings to characterize distribution among epithelial, fibroblast, immune, and stromal populations. Spatial transcriptomic profiling was performed using the Sparkle database (https://www.grswsci.top), specifically the Parent_Visium_Human_Colorectal Cancer dataset generated on the 10x Genomics Visium platform[20,21]. The data comprised 3,138 tissue-covered spots with a median of 3,538 detected genes per spot, processed through the SpaceRanger (v1.2.0) pipeline using the Genome Reference Consortium Human Build 38(GRCh38) reference. Spatial expression and cell-type mapping were visualized via the Seurat SpatialPlot function. Spearman correlation analysis was applied to assess associations between ANKRD6 expression and cell-type proportions, and the results were displayed using the linkET package, where line color and thickness represent correlation direction and magnitude. Regions with malignant cell fractions > 0 were defined as malignant (Mal) and those with 0 as non-malignant (nMal). Differences in ANKRD6 expression between Mal and nMal regions were evaluated by the Wilcoxon rank-sum test, and results were visualized as bar plots to depict spatial heterogeneity.
Experimental validation
Clinical samples and cell lines
Human colon cancer cell line (HCT116) was preserved in our laboratory and cultured according to the standard protocol recommended by the American Type Culture Collection (ATCC). In addition, ten pairs of colon cancer tissues and matched adjacent noncancerous tissues were collected from patients who underwent surgical resection at the First Affiliated Hospital of Wannan Medical College (Yijishan Hospital). All samples were immediately snap-frozen in liquid nitrogen at -80 °C or fixed in 4% paraformaldehyde for subsequent analyses.
Immunohistochemistry
Paraffin-embedded colorectal adenocarcinoma (COAD) and paired adjacent normal tissues were sectioned at 4 μm and subjected to high-pressure heat-induced antigen retrieval. Non-specific binding was blocked with a universal blocking reagent, followed by incubation with a rabbit polyclonal anti-ANKRD6 primary antibody (1:200, Proteintech, Cat# 24333-1-AP). After chromogenic development, sections were decolorized, dehydrated, cleared, mounted, and imaged under identical exposure settings using an Olympus BX53 microscope (Tokyo, Japan). Quantification was performed in ImageJ (v1.54f, National Institutes of Health [NIH]) with the immunohistochemistry (IHC) Profiler plugin[22]. 3,3′-Diaminobenzidine (DAB) signals were color-deconvoluted and pixels were automatically classified into four intensity bins: negative (1), weak positive (2), positive (3), and strong positive (4). The immunoreactivity score for each field was calculated as[22]:
Per-sample scores (mean of ≥ 3 fields) were then mapped to qualitative categories: negative (-), low (+), moderate (++), and high (+++). Two board-certified pathologists, blinded to clinical data, independently verified all readings. For paired tumor vs. adjacent comparisons, dichotomized outcomes (positive vs. negative) were analyzed with McNemar’s test (two-tailed, P < 0.05).
Cell culture and siRNA transfection
HCT116 was cultured in Dulbecco’s Modified Eagle Medium (DMEM) supplemented with 10% fetal bovine serum (FBS) and maintained at 37 °C in a humidified atmosphere containing 5% CO2. When cells reached 60%-70% confluence, transfection was performed using Lipofectamine 2000 (Invitrogen, USA) according to the manufacturer’s instructions. Three specific small interfering RNAs (siRNAs) targeting ANKRD6 (siANKRD6-1, siANKRD6-2, siANKRD6-3) and a non-targeting negative control (NC) were used. The final siRNA concentration was 200 nM per well, and transfection was carried out in Opti-MEM I reduced-serum medium (Gibco, Thermo Fisher Scientific, USA) for 6 h, after which the medium was replaced with standard growth medium. Cells were incubated for an additional 48 h before subsequent analyses.
qPCR analysis
At 48 h post-transfection, total RNA was extracted using TRIzol reagent (Invitrogen, USA), and RNA concentration and purity were measured with a NanoDrop 2000 spectrophotometer (Thermo Fisher Scientific, USA). Complementary DNA (cDNA) was synthesized from total RNA using the PrimeScript RT Reagent Kit (Takara, Japan) following the manufacturer’s protocol. Quantitative real-time polymerase chain reaction (PCR) (qPCR) was performed on an ABI 7500 Fast Real-Time PCR System (Applied Biosystems, USA) using SYBR Green Master Mix (Takara, Japan) to determine the messenger RNA (mRNA) expression levels of ANKRD6, Mitogen-Activated Protein Kinase 8 (MAPK8/JNK), Ras Homolog Family Member A (RHOA), and Wnt Family Member 7A (WNT7A). Glyceraldehyde-3-phosphate dehydrogenase (GAPDH) served as the internal reference gene, and relative expression levels were calculated using the 2-ΔΔCt method.
Western blot analysis
At 48 h post-transfection, total cellular proteins were extracted using radioimmunoprecipitation assay (RIPA) lysis buffer (Beyotime, China) supplemented with protease and phosphatase inhibitors. Lysates were clarified by centrifugation at 12,000 × g for 15 min at 4 °C, and protein concentrations were determined using a bicinchoninic acid (BCA) Protein Assay Kit (Thermo Fisher Scientific, USA). Equal amounts of protein were separated by sodium dodecyl sulfate (SDS)-polyacrylamide gel electrophoresis (SDS-PAGE) and transferred onto polyvinylidene difluoride (PVDF) membranes (Millipore, USA). After blocking with 5% non-fat dry milk in Tris-buffered saline with Tween-20 (TBST) for 1 h at room temperature, the membranes were incubated overnight at 4 °C with primary antibodies against WNT7A, JNK, RHOA, and GAPDH. Following incubation with horseradish peroxidase (HRP)-conjugated secondary antibodies (Cell Signaling Technology, USA), protein bands were visualized using an enhanced chemiluminescence (ECL) detection system (Bio-Rad, USA). Band intensity was quantified by ImageJ software (NIH, USA) and normalized to GAPDH levels.
Statistical analysis
All statistical analyses were performed using R software (version 4.3.2, Austria). Group comparisons were conducted using the unpaired Wilcoxon rank-sum test, and LASSO regression was applied to identify survival-related genes. For paired categorical data, such as IHC positive/negative outcomes, McNemar’s test was used to evaluate tumor versus adjacent tissue differences. Correlations between gene expression levels were assessed by Pearson and Spearman correlation tests, depending on data distribution. For experimental validation, differences between groups were analyzed using independent-sample t-tests. A two-tailed
RESULTS
High expression of ANKRD6 is generally associated with poor prognosis
Cox regression analysis and forest plots [Figure 2A] demonstrated that ANKRD6 expression had a significant impact on OS across multiple malignancies. Elevated ANKRD6 levels predicted favorable outcomes (HR < 1) in several tumor types, including glioblastoma multiforme and lower grade glioma (GBMLGG) (P < 0.001, HR = 0.513, 95%CI: 0.428-0.614), lung adenocarcinoma (LUAD)(P = 0.002,
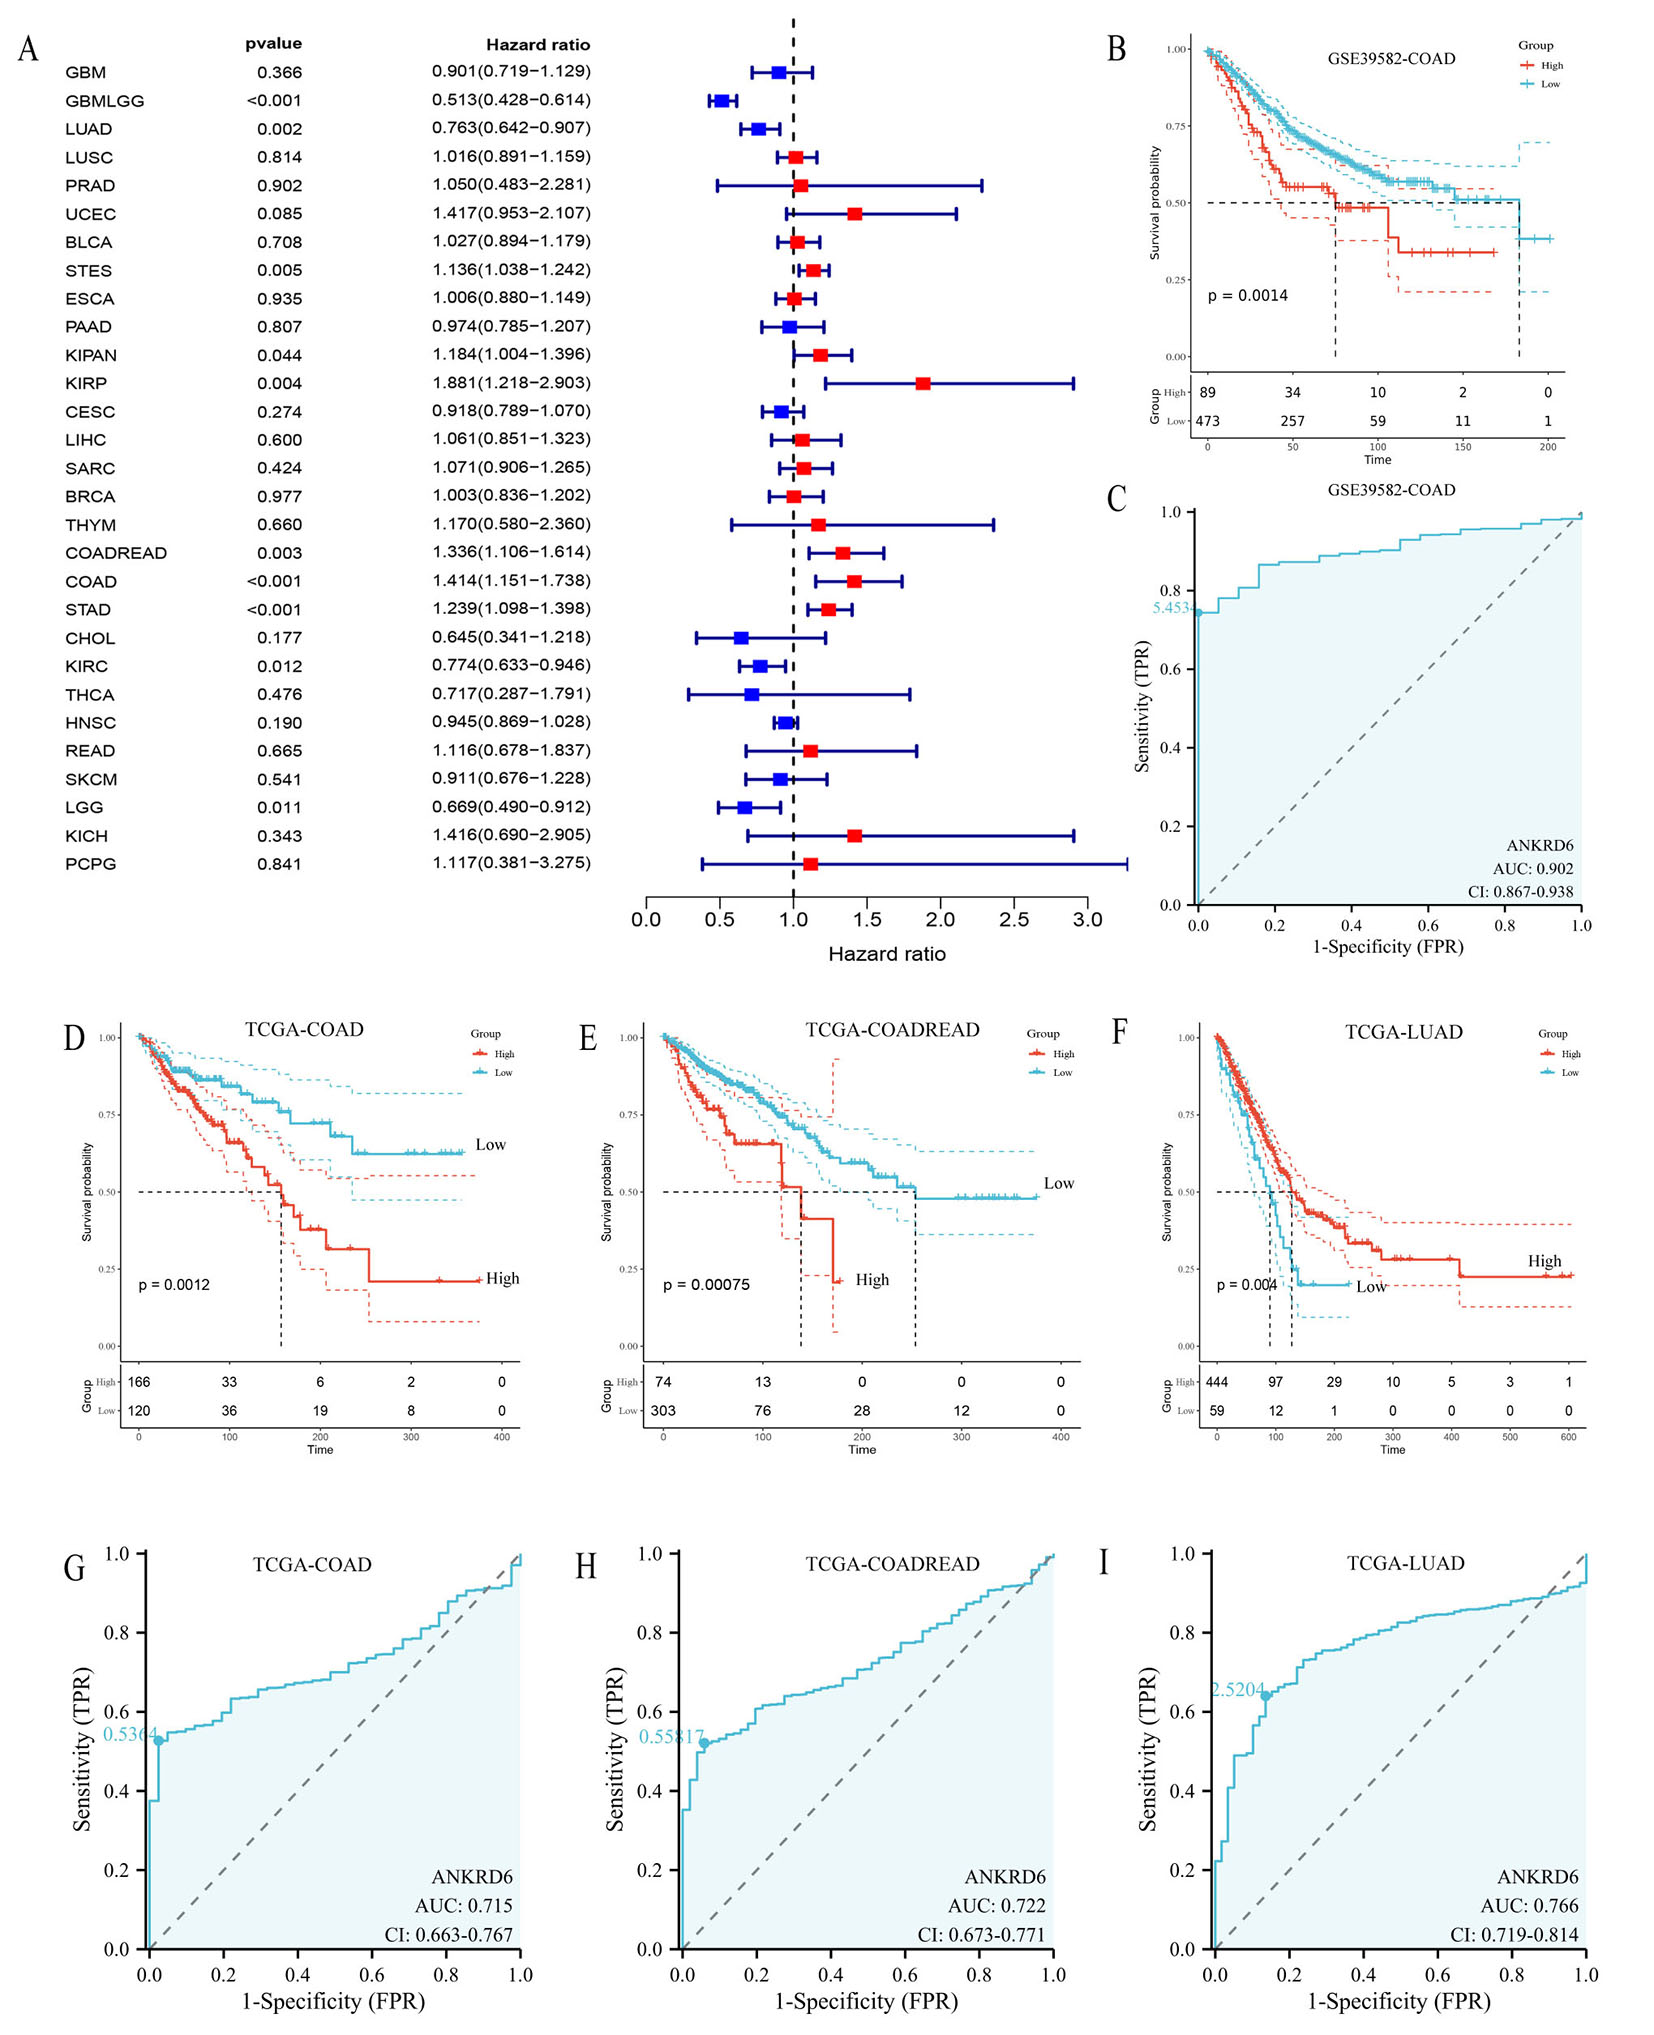
Figure 2. Association between ANKRD6 expression and cancer prognosis and diagnostic efficacy. (A) Forest plot illustrating the association between ANKRD6 expression and overall survival across multiple cancer types (TCGA), with statistical significance
To strengthen these findings, survival analyses using log-rank tests confirmed significant differences between high- and low-expression groups. In the external GSE39582 cohort, high ANKRD6 expression was significantly associated with unfavorable prognosis (P = 0.0014) [Figure 2B]. ROC analysis of the same dataset demonstrated strong diagnostic performance (AUC = 0.902, 95%CI: 0.867-0.938) [Figure 2C]. Similarly, in the TCGA cohort, consistent results were observed: high ANKRD6 was associated with worse outcomes in COAD and COADREAD [Figure 2D and E] but better prognosis in LUAD [Figure 2F].
We further assessed the diagnostic utility of ANKRD6 using ROC analysis. In COAD, COADREAD, and LUAD, ANKRD6 exhibited moderate diagnostic performance, with AUC values of 0.715, 0.722, and 0.766, respectively [Figure 2G-I]. Collectively, these results highlight the potential clinical value of ANKRD6 as both a prognostic and diagnostic biomarker in cancer.
ANKRD6 DNA methylation analysis and RNA modification gene analysis
In multiple cancer types, the DNA Methylation levels of ANKRD6 were significantly higher in tumor tissues than in normal tissues [Figure 3A]. For instance, in KIRP, skin cutaneous melanoma (SKCM), and thyroid carcinoma (THCA), the methylation levels in tumor tissues were significantly elevated compared to corresponding normal tissues, and these differences were statistically significant. In contrast, for several malignancies - including kidney renal clear cell carcinoma (KIRC), bladder urothelial carcinoma (BLCA), breast invasive carcinoma (BRCA), COAD, head and neck squamous cell carcinoma (HNSC), liver hepatocellular carcinoma (LIHC), lung squamous cell carcinoma (LUSC), pancreatic adenocarcinoma (PAAD), rectum adenocarcinoma (READ), sarcoma (SARC), stomach adenocarcinoma (STAD), and uterine corpus endometrial carcinoma (UCEC) - the methylation levels observed in adjacent normal tissues were markedly elevated compared with those in tumor samples.
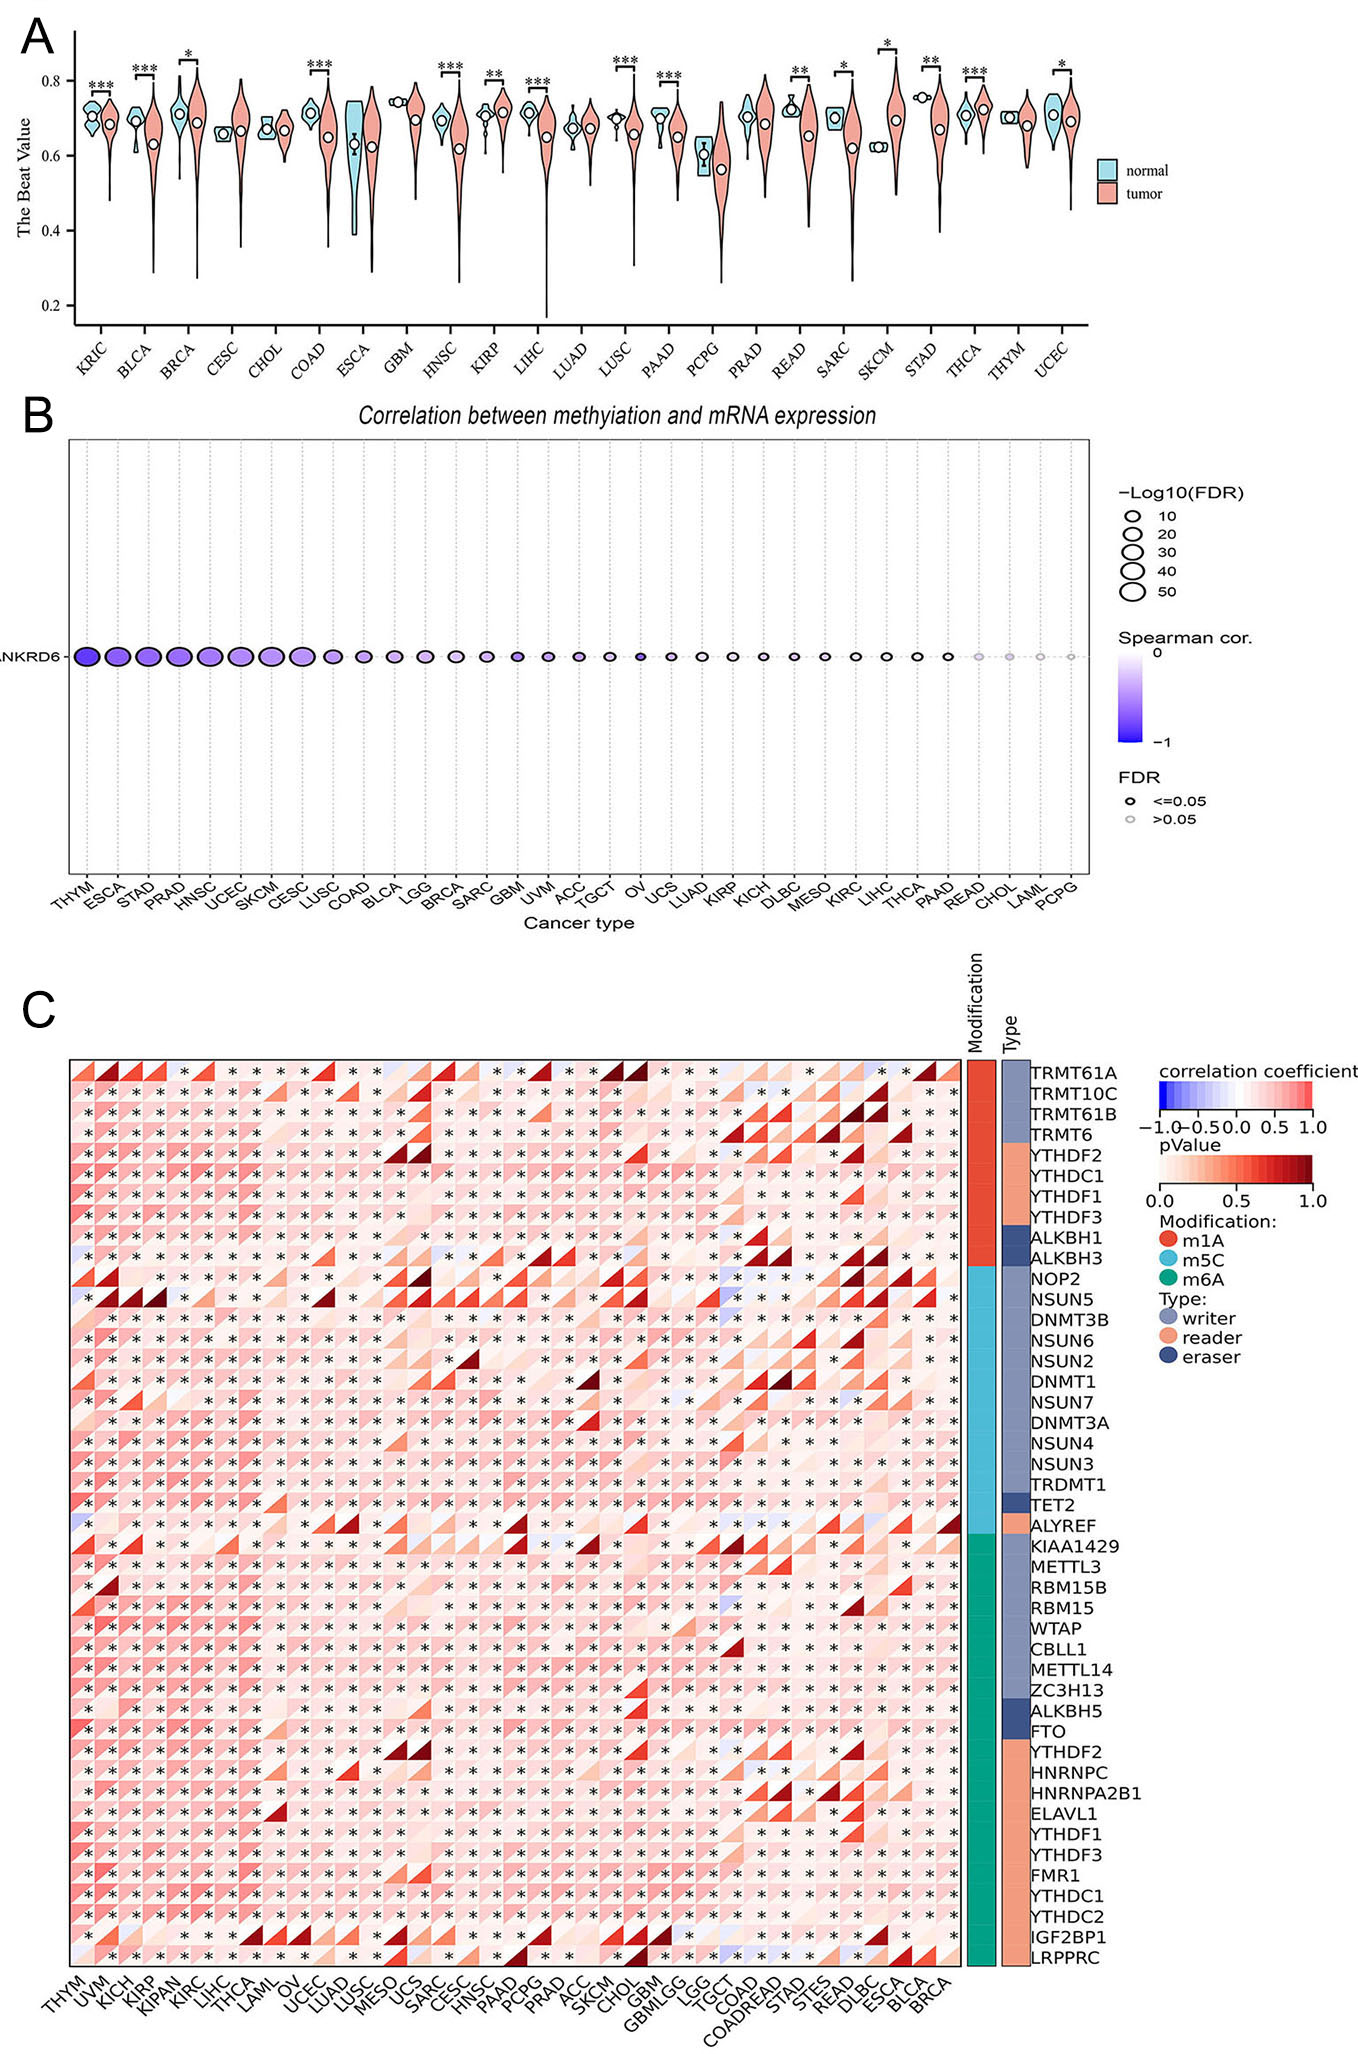
Figure 3. ANKRD6 DNA methylation and its correlation with RNA modification genes. (A) Analysis of differential ANKRD6 methylation patterns between malignant and adjacent normal tissues across diverse cancer cohorts. (B) Distribution plot showing the correlation between ANKRD6 methylation levels and mRNA expression across various cancer types. The x-axis represents cancer types, and the y-axis represents the gene symbol ANKRD6. The color scale indicates the Spearman Correlation coefficient (range: -1 to 1), with deeper colors representing stronger correlations. Bubble size is scaled by -log10(FDR). Significant correlations are highlighted by filled circles (FDR ≤ 0.05), whereas non-significant correlations are shown as hollow circles (FDR > 0.05). (C) Heatmap showing the correlation of ANKRD6 with RNA modification regulators (m1A, m5C, m6A). Red and blue colors denote positive and negative correlations, respectively, with color depth proportional to correlation strength. (ns: Not significant; *P < 0.05; **P < 0.01; ***P < 0.001).
Moreover, across multiple tumor types, ANKRD6 DNA methylation levels showed a pronounced inverse association with its mRNA expression [Figure 3B]. For example, in Esophageal Carcinoma (ESCA, r = -0.70, False Discovery Rate (FDR) < 0.05), HNSC (r = -0.58, FDR < 0.05), STAD (r = -0.67, FDR < 0.05), and thymoma (THYM) (r = -0.85, FDR < 0.05), there was a strong negative correlation between ANKRD6 methylation levels and mRNA expression. However, in cholangiocarcinoma (CHOL) and Pheochromocytoma (PCPG), this correlation was weaker and not statistically significant (FDR > 0.05).
We also examined the relationship between ANKRD6 and three common types of RNA modifications, including m1A, m5C, and m6A [Figure 3C]. In COAD, ANKRD6 expression was closely correlated with several RNA modification regulators. For instance, ANKRD6 expression showed a strong correlation with the m6A demethylase Fat Mass and Obesity-Associated Protein (FTO) (r = 0.547, P < 1.5e-22), the m5C methyltransferase DNA Methyltransferase 3 Alpha (DNMT3A) (r = 0.409, P < 7.41e-12), the m6A methyltransferase Zinc Finger CCCH-Type Containing 13 (ZC3H13) (r = 0.369, P < 1.08e-09), and the m5C demethylase Tet Methylcytosine Dioxygenase 2 (TET2) (r = 0.300, P < 1.83e-06).
These results indicate that alterations in DNA methylation and RNA modifications are closely associated with ANKRD6 expression across multiple cancer types, including COAD, underscoring its potential role in tumor initiation and progression.
Correlation analysis between ANKRD6 expression and tumor stemness indices
In this study, we systematically examined the relationship between ANKRD6 expression and multiple tumor stemness scores, including RNAss, EREG_METHss, EREG_EXPss, ENHss, DNAss, and DMPss. The analysis revealed that these associations differed markedly among cancer types.
Specifically, ANKRD6 expression exhibited strong negative correlations with RNAss in several cancers, most notably in THYM (R = -0.81, P < 0.001) and COADREAD (R = -0.62, P < 0.001), indicating its potential suppressive effect on stemness. By contrast, associations with EREG_METHss and EREG_EXPss were largely weak or insignificant across cancers, except in COAD, where ANKRD6 was inversely related to EREG_EXPss (R = -0.16, P < 0.01), suggesting a possible epigenetic mechanism in stemness regulation.
For ENHss, ANKRD6 exhibited weak or non-significant correlations in most cancer types. However, in COAD, ANKRD6 displayed a small but significant correlation with ENHss (R = -0.15, P < 0.05), which may reflect a potential role for ANKRD6 in regulating enhancer activity under specific biological contexts.
In COAD, ANKRD6 expression demonstrated significant inverse correlations with both RNAss (R = -0.61, P < 0.001) and DNAss (R = -0.17, P < 0.01), indicating that elevated ANKRD6 levels may suppress stemness traits [Figure 4].
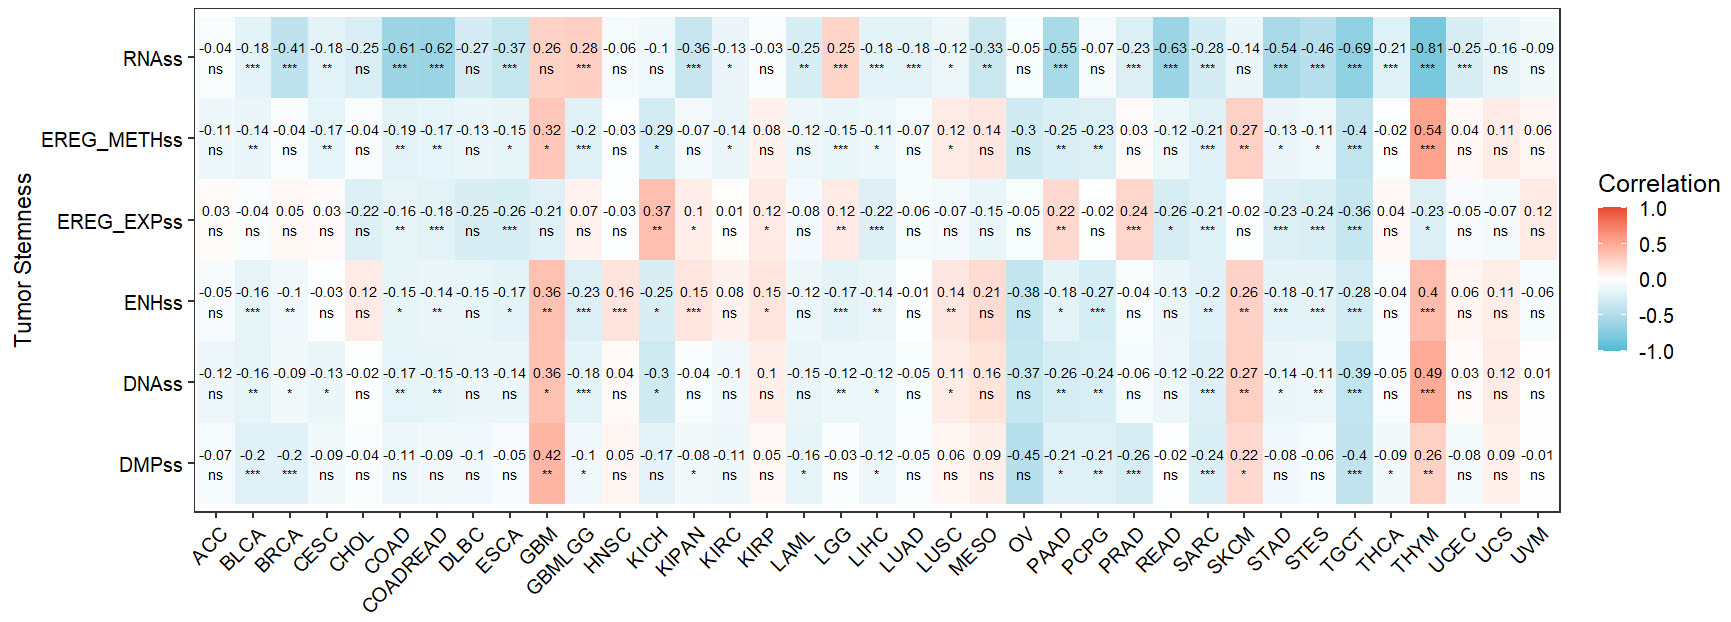
Figure 4. Correlation between ANKRD6 expression and tumor stemness indices across cancer types. Heatmap illustrating the Pearson correlation coefficients between ANKRD6 expression and various tumor stemness scores, including RNAss, EREG_METHss, EREG_EXPss, ENHss, DNAss, and DMPss, across different cancer types. The color scale represents correlation strength, with red indicating positive correlations and blue indicating negative correlations. Deeper colors correspond to stronger correlations. (ns: Not significant; *P < 0.05; **P < 0.01; ***P < 0.001).
Correlation between ANKRD6 expression and pathway activity in COAD and its regulatory mechanisms
To systematically evaluate the biological pathways associated with ANKRD6 in COAD, we first performed GSVA on TCGA-COAD transcriptome data using KEGG and GO-BP gene sets. Two grouping strategies were applied: (i) tumor versus normal samples; and (ii) high- versus low-ANKRD6 expression groups (median split). The intersection of significantly altered pathways identified by both grouping strategies included KEGG_WNT_SIGNALING_PATHWAY, KEGG_RENIN_ANGIOTENSIN_SYSTEM, KEGG_CALCIUM_SIGNALING_PATHWAY, KEGG_NEUROACTIVE_LIGAND_RECEPTOR_INTERACTION, KEGG_ALDOSTERONE_REGULATED_SODIUM_REABSORPTION, KEGG_ASTHMA, GOBP_REGULATION_OF_SHORT_TERM_NEURONAL_SYNAPTIC_PLASTICITY, GOBP_ENTERIC_NERVOUS_SYSTEM_DEVELOPMENT, GOBP_NEUROTRANSMITTER_GATED_ION_CHANNEL_CLUSTERING, and GOBP_REGULATION_OF_PRESYNAPTIC_CYTOSOLIC_CALCIUM_ION_CONCENTRATION
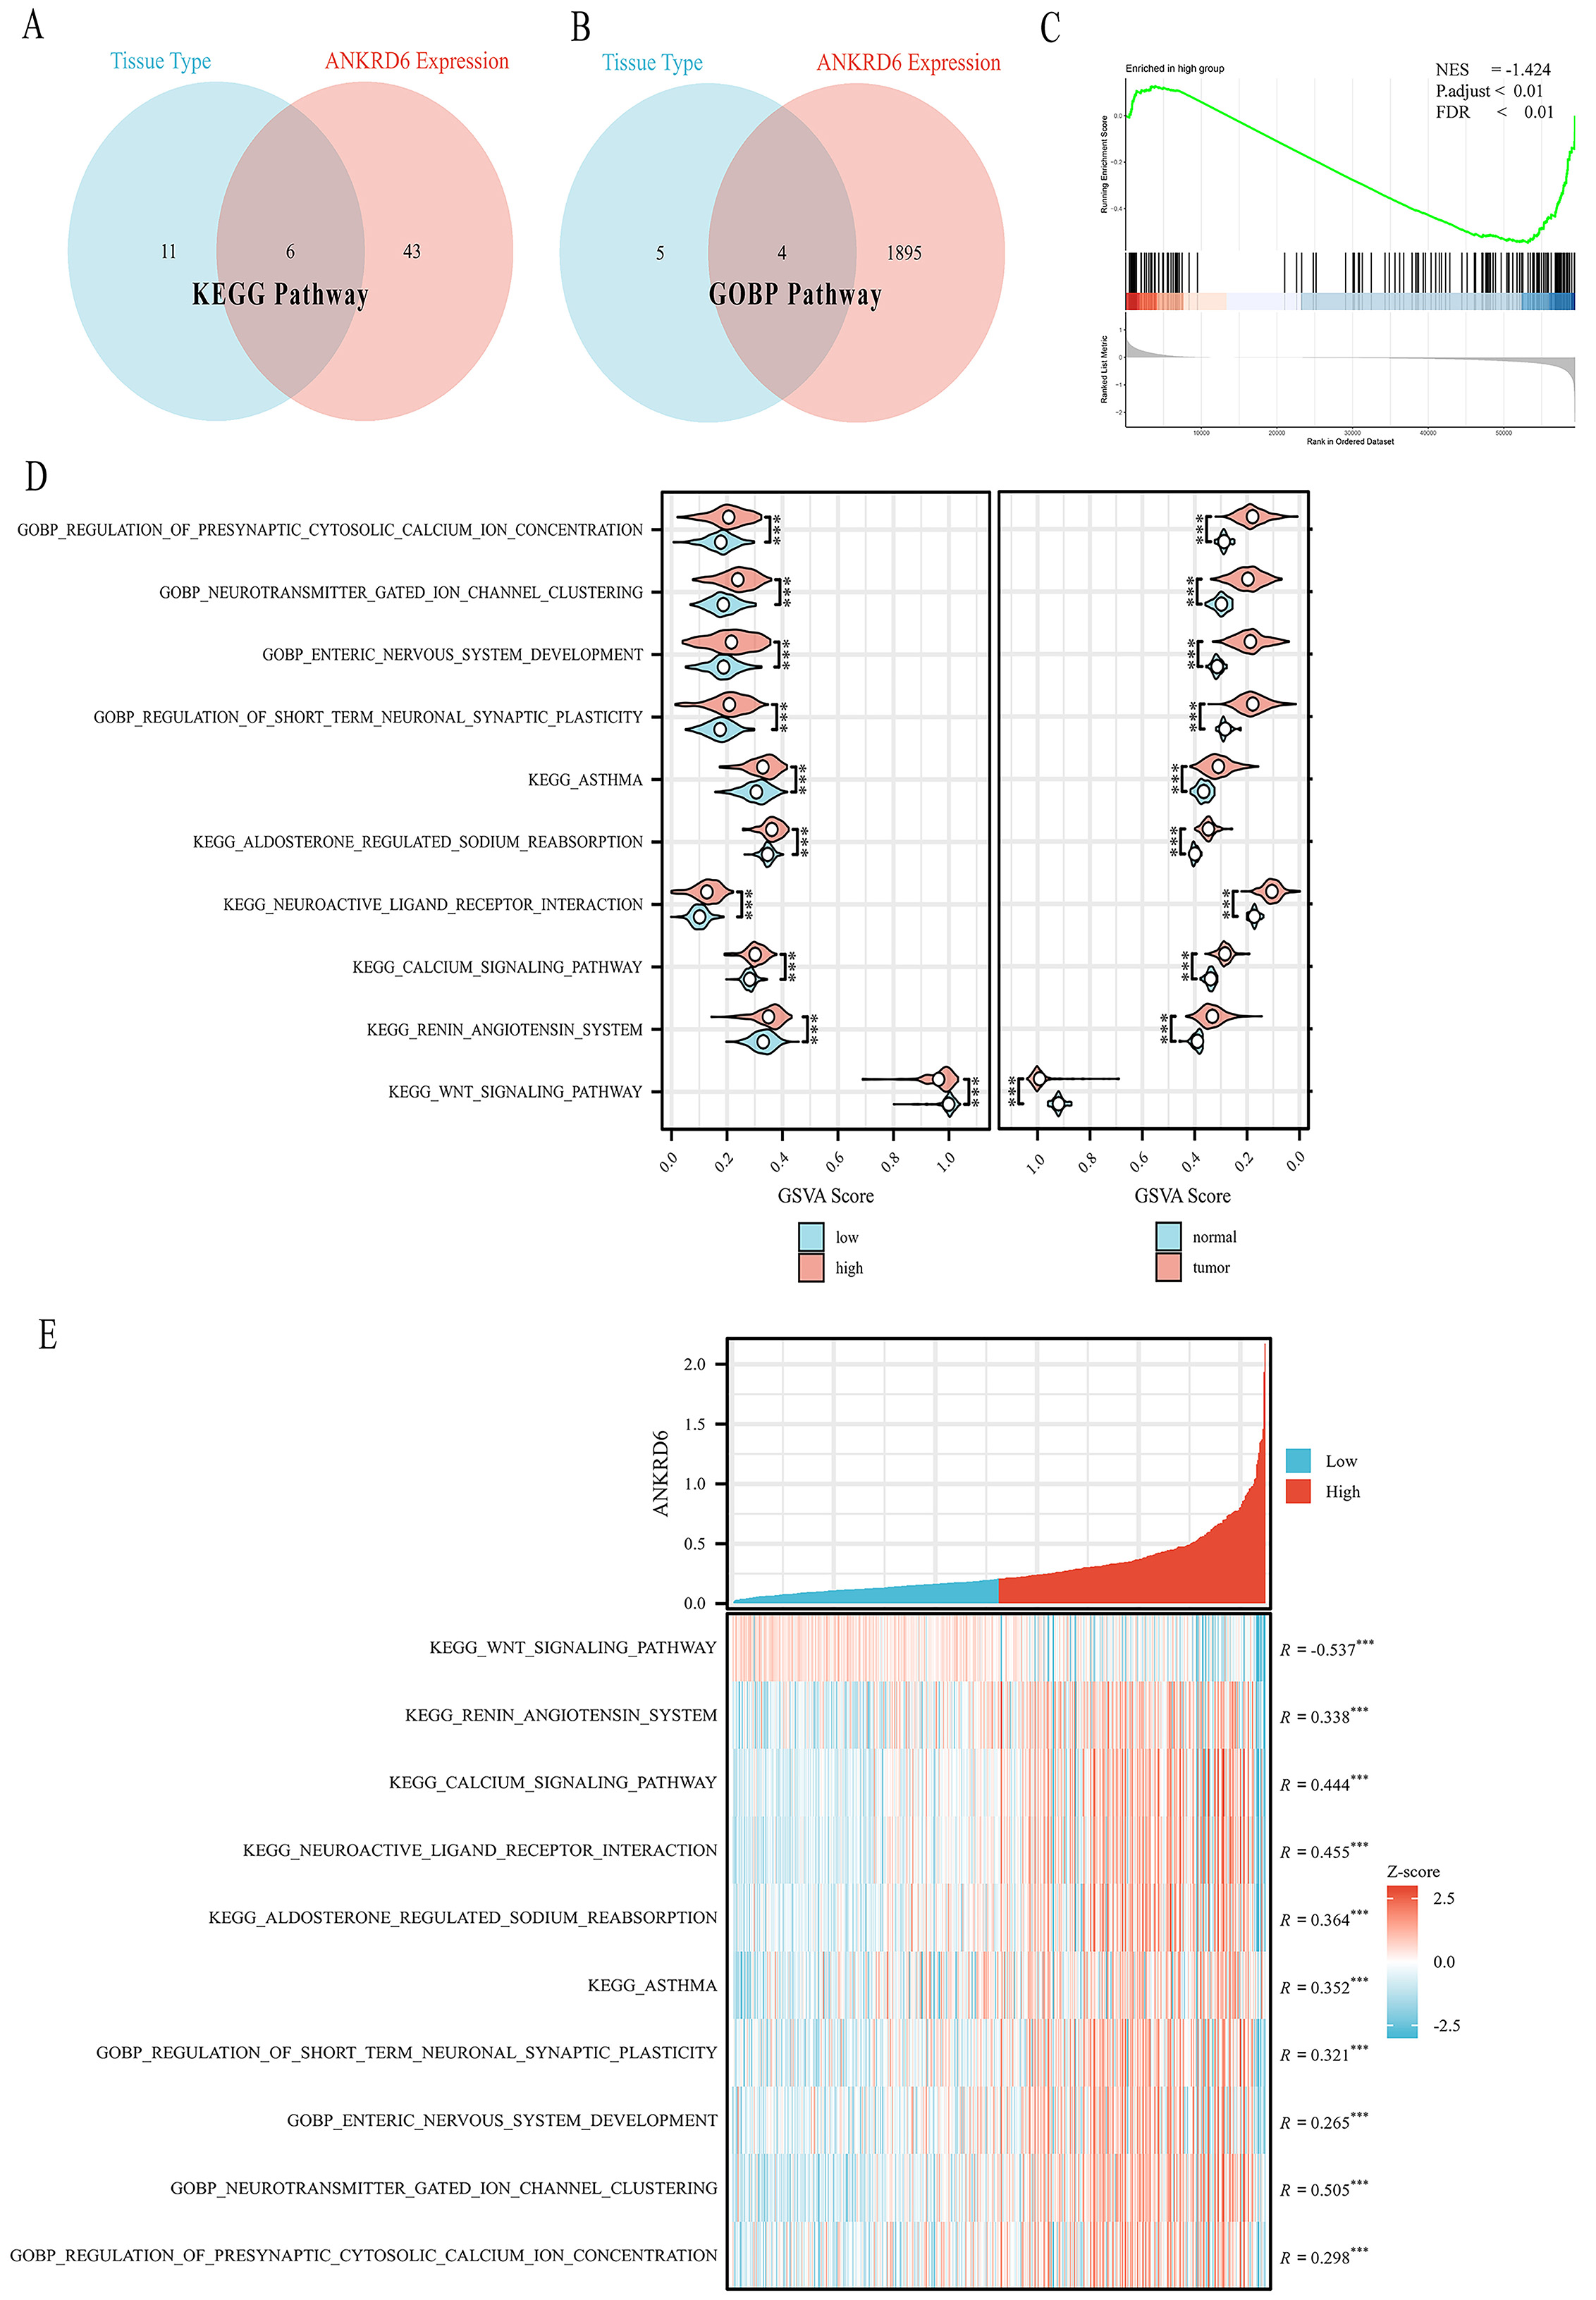
Figure 5. Association between ANKRD6 expression and pathway activity in COAD. (A) KEGG pathway intersection analysis showing the relationship between ANKRD6 expression levels and tissue type. (B) GO-BP pathway intersection analysis showing the relationship between ANKRD6 expression levels and tissue type. (C) GSEA showing suppression of the KEGG_WNT_SIGNALING_PATHWAY in the high ANKRD6 expression group, with a negative normalized enrichment score (NES = -1.424) and statistically significant adjusted
Next, GSEA was performed using genes ranked by log2 fold change between high- and low-ANKRD6 groups. KEGG_WNT_SIGNALING_PATHWAY was significantly enriched in the low-ANKRD6 expression group (normalized enrichment score [NES] = -1.424, p.adjust < 0.01, FDR < 0.01), suggesting that the global Wnt signaling program is downregulated in high-ANKRD6 samples [Figure 5C].
At the sample level, GSVA scores further confirmed these findings. Although the KEGG_WNT_SIGNALING_PATHWAY showed higher activity in tumors compared with normal tissues, its GSVA score was significantly lower in the high-ANKRD6 group than in the low-ANKRD6 group
Correlation analysis demonstrated a significant negative correlation between ANKRD6 expression and GSVA scores of KEGG_WNT_SIGNALING_PATHWAY (R = -0.537, P < 0.001), indicating that higher ANKRD6 expression is associated with suppressed pathway activity [Figure 5E].
Together, these results consistently show that ANKRD6 expression is inversely associated with the KEGG-defined Wnt signaling pathway. This finding provides the rationale for subsequent gene-level analyses and experimental validation aimed at elucidating the regulatory mechanisms by which ANKRD6 influences Wnt signaling in COAD.
Screening of KEGG_WNT_SIGNALING_PATHWAY genes associated with COAD survival and correlation with ANKRD6
Through LASSO regression analysis of 151 genes in the KEGG_WNT_SIGNALING_PATHWAY (see Supplementary Material 1), we identified 25 genes significantly associated with COAD survival [Table 1]. The LASSO coefficient distribution and cross-validation curve are shown in Figure 6A and B. Specifically, Figure 6A illustrates the trend of LASSO regression coefficients as the λ changes, highlighting how gene weights shrink with increasing regularization. Figure 6B presents the ten-fold cross-validation error curve used to determine the optimal λ value, which was identified as 0.0237. At this λ, the model retained 25 non-zero coefficients corresponding to survival-associated genes, including RHOA, WNT7A, and MAPK8/JNK. The LASSO regression coefficients reflect the relative contribution of each gene to predicting COAD survival. For instance, higher expression of RHOA (coefficient = 0.826108), Wnt family member 10B (WNT10B)
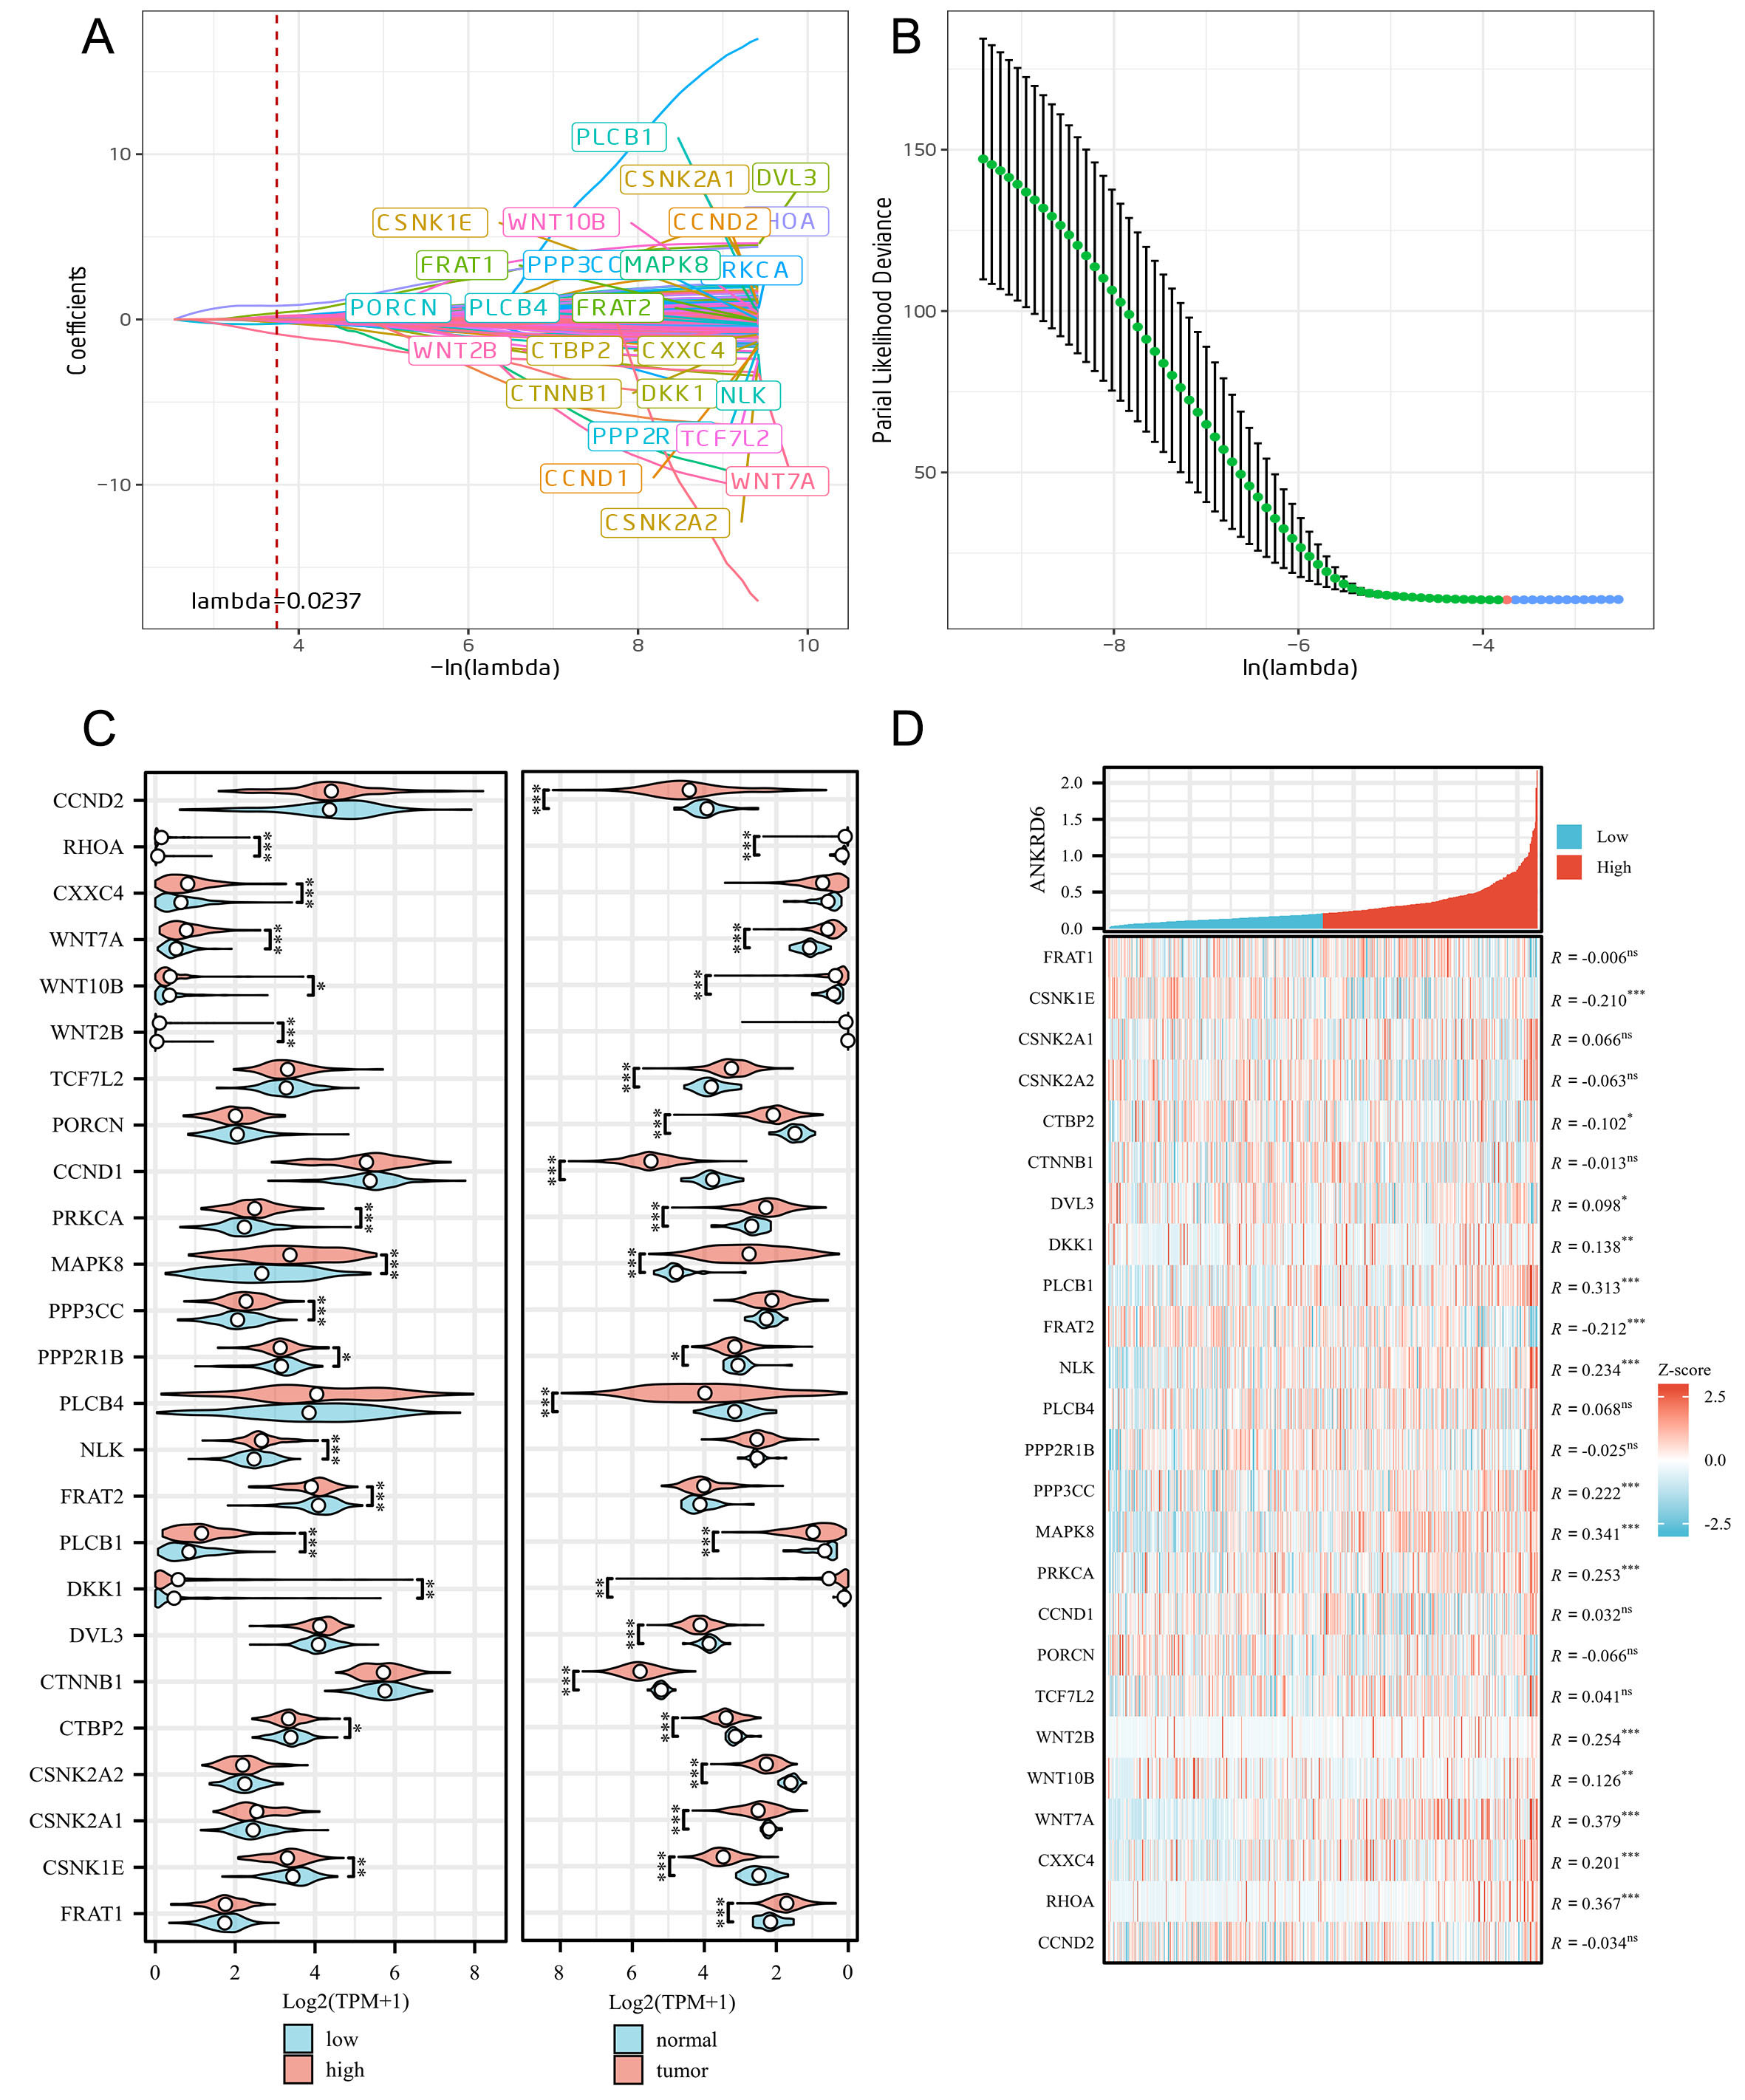
Figure 6. LASSO regression analysis and gene expression differences in tumor and normal tissues. (A) LASSO regression coefficient path showing the changes in regression coefficients for 151 KEGG_WNT_SIGNALING_PATHWAY genes at different λ values. The red dashed line represents the optimal λ value (0.0237). (B) Selection of the optimal λ value, determined by the minimum point of partial likelihood deviance, represented by a vertical line. Error bars indicate standard error. (C) Violin plots comparing the expression of the 25 survival-related genes in two contexts: left panel - high vs. low ANKRD6 expression groups (red: high, blue: low); right panel - tumor vs. normal tissues (red: tumor, blue: normal). This layout highlights how these genes vary with ANKRD6 expression status and tumorigenesis. (D) Correlation analysis between ANKRD6 expression and the 25 genes. The heatmap illustrates gene expression Z-scores, where positive correlations are shown in red and negative correlations in blue. The figure reports correlation coefficients (R) along with statistical significance. (ns: Not significant; *P < 0.05; **P < 0.01; ***P < 0.001).
25 KEGG_WNT_SIGNALING_PATHWAY genes associated with COAD survival identified via LASSO regression
| Gene | Lasso coefficient |
| WNT7A | -0.88535 |
| RHOA | 0.826108 |
| DVL3 | 0.391467 |
| PPP2R1B | -0.25792 |
| WNT2B | 0.206613 |
| CSNK2A2 | -0.2001 |
| CCND1 | -0.15832 |
| WNT10B | 0.151802 |
| PLCB1 | 0.13729 |
| PRKCA | 0.129716 |
| CCND2 | 0.118331 |
| TCF7L2 | -0.11478 |
| CSNK2A1 | 0.111904 |
| CTBP2 | -0.05833 |
| PPP3CC | 0.056707 |
| CTNNB1 | -0.05602 |
| CSNK1E | 0.054877 |
| DKK1 | -0.04609 |
| MAPK8 | -0.04117 |
| FRAT2 | -0.02979 |
| NLK | -0.02051 |
| FRAT1 | -0.01147 |
| CXXC4 | -0.00914 |
| PLCB4 | -0.00221 |
| PORCN | 0.001557 |
Next, we analyzed the differential expression of these 25 genes in normal and tumor tissues using TCGA data [Figure 6C], revealing significant expression differences between normal and tumor tissues. Further analysis revealed that ANKRD6 expression significantly altered the expression profiles of these genes, suggesting a potential regulatory function.
Among the 25 survival-related genes, WNT7A, RHOA, and MAPK8 showed the strongest correlations with ANKRD6 (r = 0.379, 0.367, and 0.341; all P < 0.001) [Figure 6D], suggesting a regulatory link between ANKRD6 and critical Wnt pathway mediators in COAD.
Single-cell and spatial transcriptomic characterization of ANKRD6 expression in COAD
To further clarify the cellular origin and spatial localization of ANKRD6 in CRC, single-cell RNA-seq and spatial transcriptomic analyses were performed. UMAP clustering identified major cell types, including malignant epithelial cells, fibroblasts, endothelial cells, monocytes, plasma cells, mast cells, myofibroblasts, enteric glial cells, CD4+ and CD8+ T-cell subsets [Figure 7A]. ANKRD6 expression was broadly detectable across multiple cell populations but showed relatively higher density in fibroblasts, although the enrichment was not pronounced [Figure 7B]. Spatial transcriptomic mapping revealed the distribution of ten major cell types, including B cells, CD4+ T cells, dendritic cells (DCs), endothelial cells, epithelial cells, fibroblasts, macrophages, neutrophils, plasma cells, and tumor cells [Figure 7C]. Correlation analysis demonstrated that ANKRD6 expression was positively correlated with CD4+ T cells and tumor cells, but negatively correlated with plasma cells and fibroblasts [Figure 7D]. In addition, tumor cells themselves showed positive correlations with CD8+ T cells, plasma cells, macrophages, and fibroblasts, reflecting a complex intercellular communication network within the tumor microenvironment.
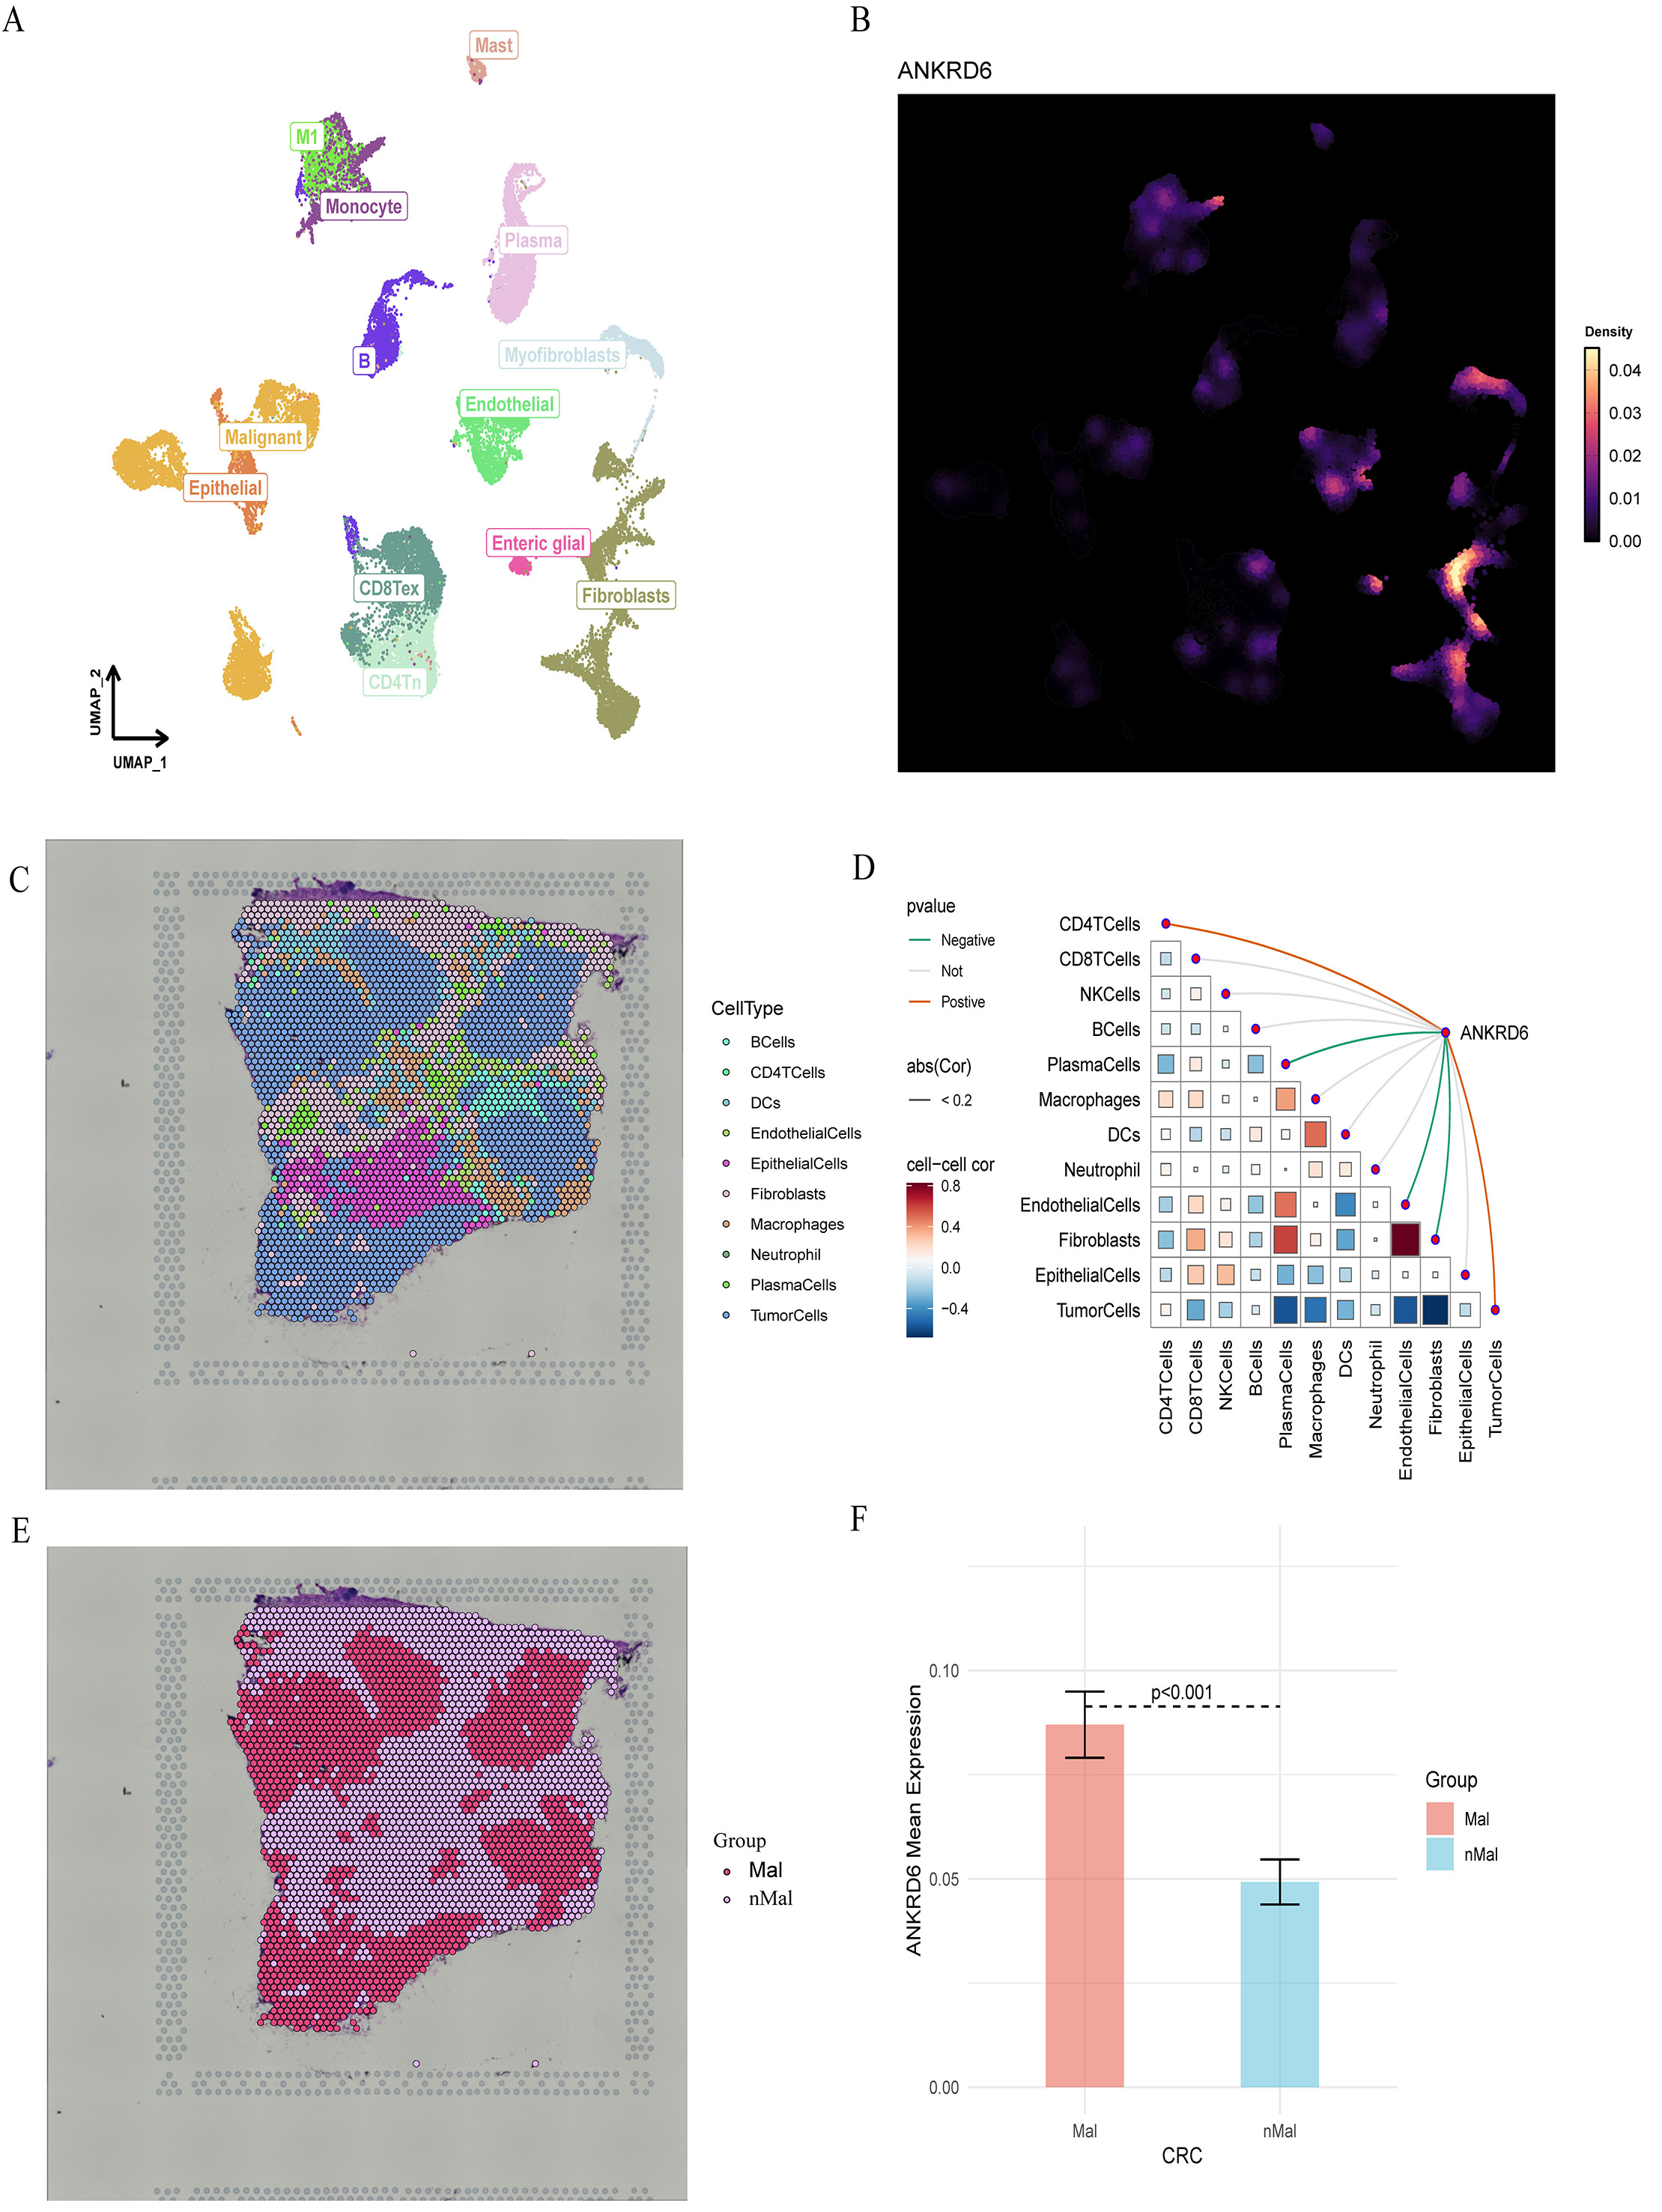
Figure 7. Single-cell and spatial transcriptomic analysis of ANKRD6 in colorectal cancer (COAD). (A) UMAP clustering of major cellular populations. (B) Single-cell expression distribution of ANKRD6. (C) Spatial transcriptomic cell-type mapping showing the distribution of ten major cellular lineages across colorectal tumor sections. (D) Correlation matrix and interaction network of ANKRD6 with major cell types. Red, green, and gray lines denote positive, negative, and non-significant correlations, with line thickness indicating correlation strength. In the triangular heatmap, red and blue squares represent positive and negative correlations; color depth reflects P-value significance, and square size indicates the absolute correlation coefficient. (E) Spatial segmentation of malignant (Mal) and non-malignant (nMal) regions. (F) Quantitative comparison of ANKRD6 expression between malignant and non-malignant regions, showing significantly elevated expression in malignant areas (P < 0.001; independent-sample t test).
Spatial segmentation further confirmed that ANKRD6 expression was significantly higher in Mal regions compared to nMal areas (P < 0.001; Figure 7D-F). Overall, these results indicate that ANKRD6 is mainly localized to tumor-associated compartments and may play a role in epithelial-stromal or immune-tumor interactions within the CRC microenvironment.
ANKRD6 expression in colon adenocarcinoma and its impact on key signaling pathway genes and proteins
Quantitative IHC analysis revealed that all ten COAD specimens exhibited positive ANKRD6 staining, whereas only one of the ten paired adjacent normal tissues showed weak positivity (P < 0.01, McNemar’s test), indicating a tumor-specific upregulation pattern [Figure 8A and Supplementary Table 1]. To further explore the function of ANKRD6, we knocked down its expression using specific siRNAs and evaluated knockdown efficiency via qPCR. In siRNA-transfected cells, ANKRD6 mRNA expression declined by 28%, 54%, and 33% compared with the NC group (P < 0.01), demonstrating that the siRNAs successfully suppressed ANKRD6 [Figure 8B].
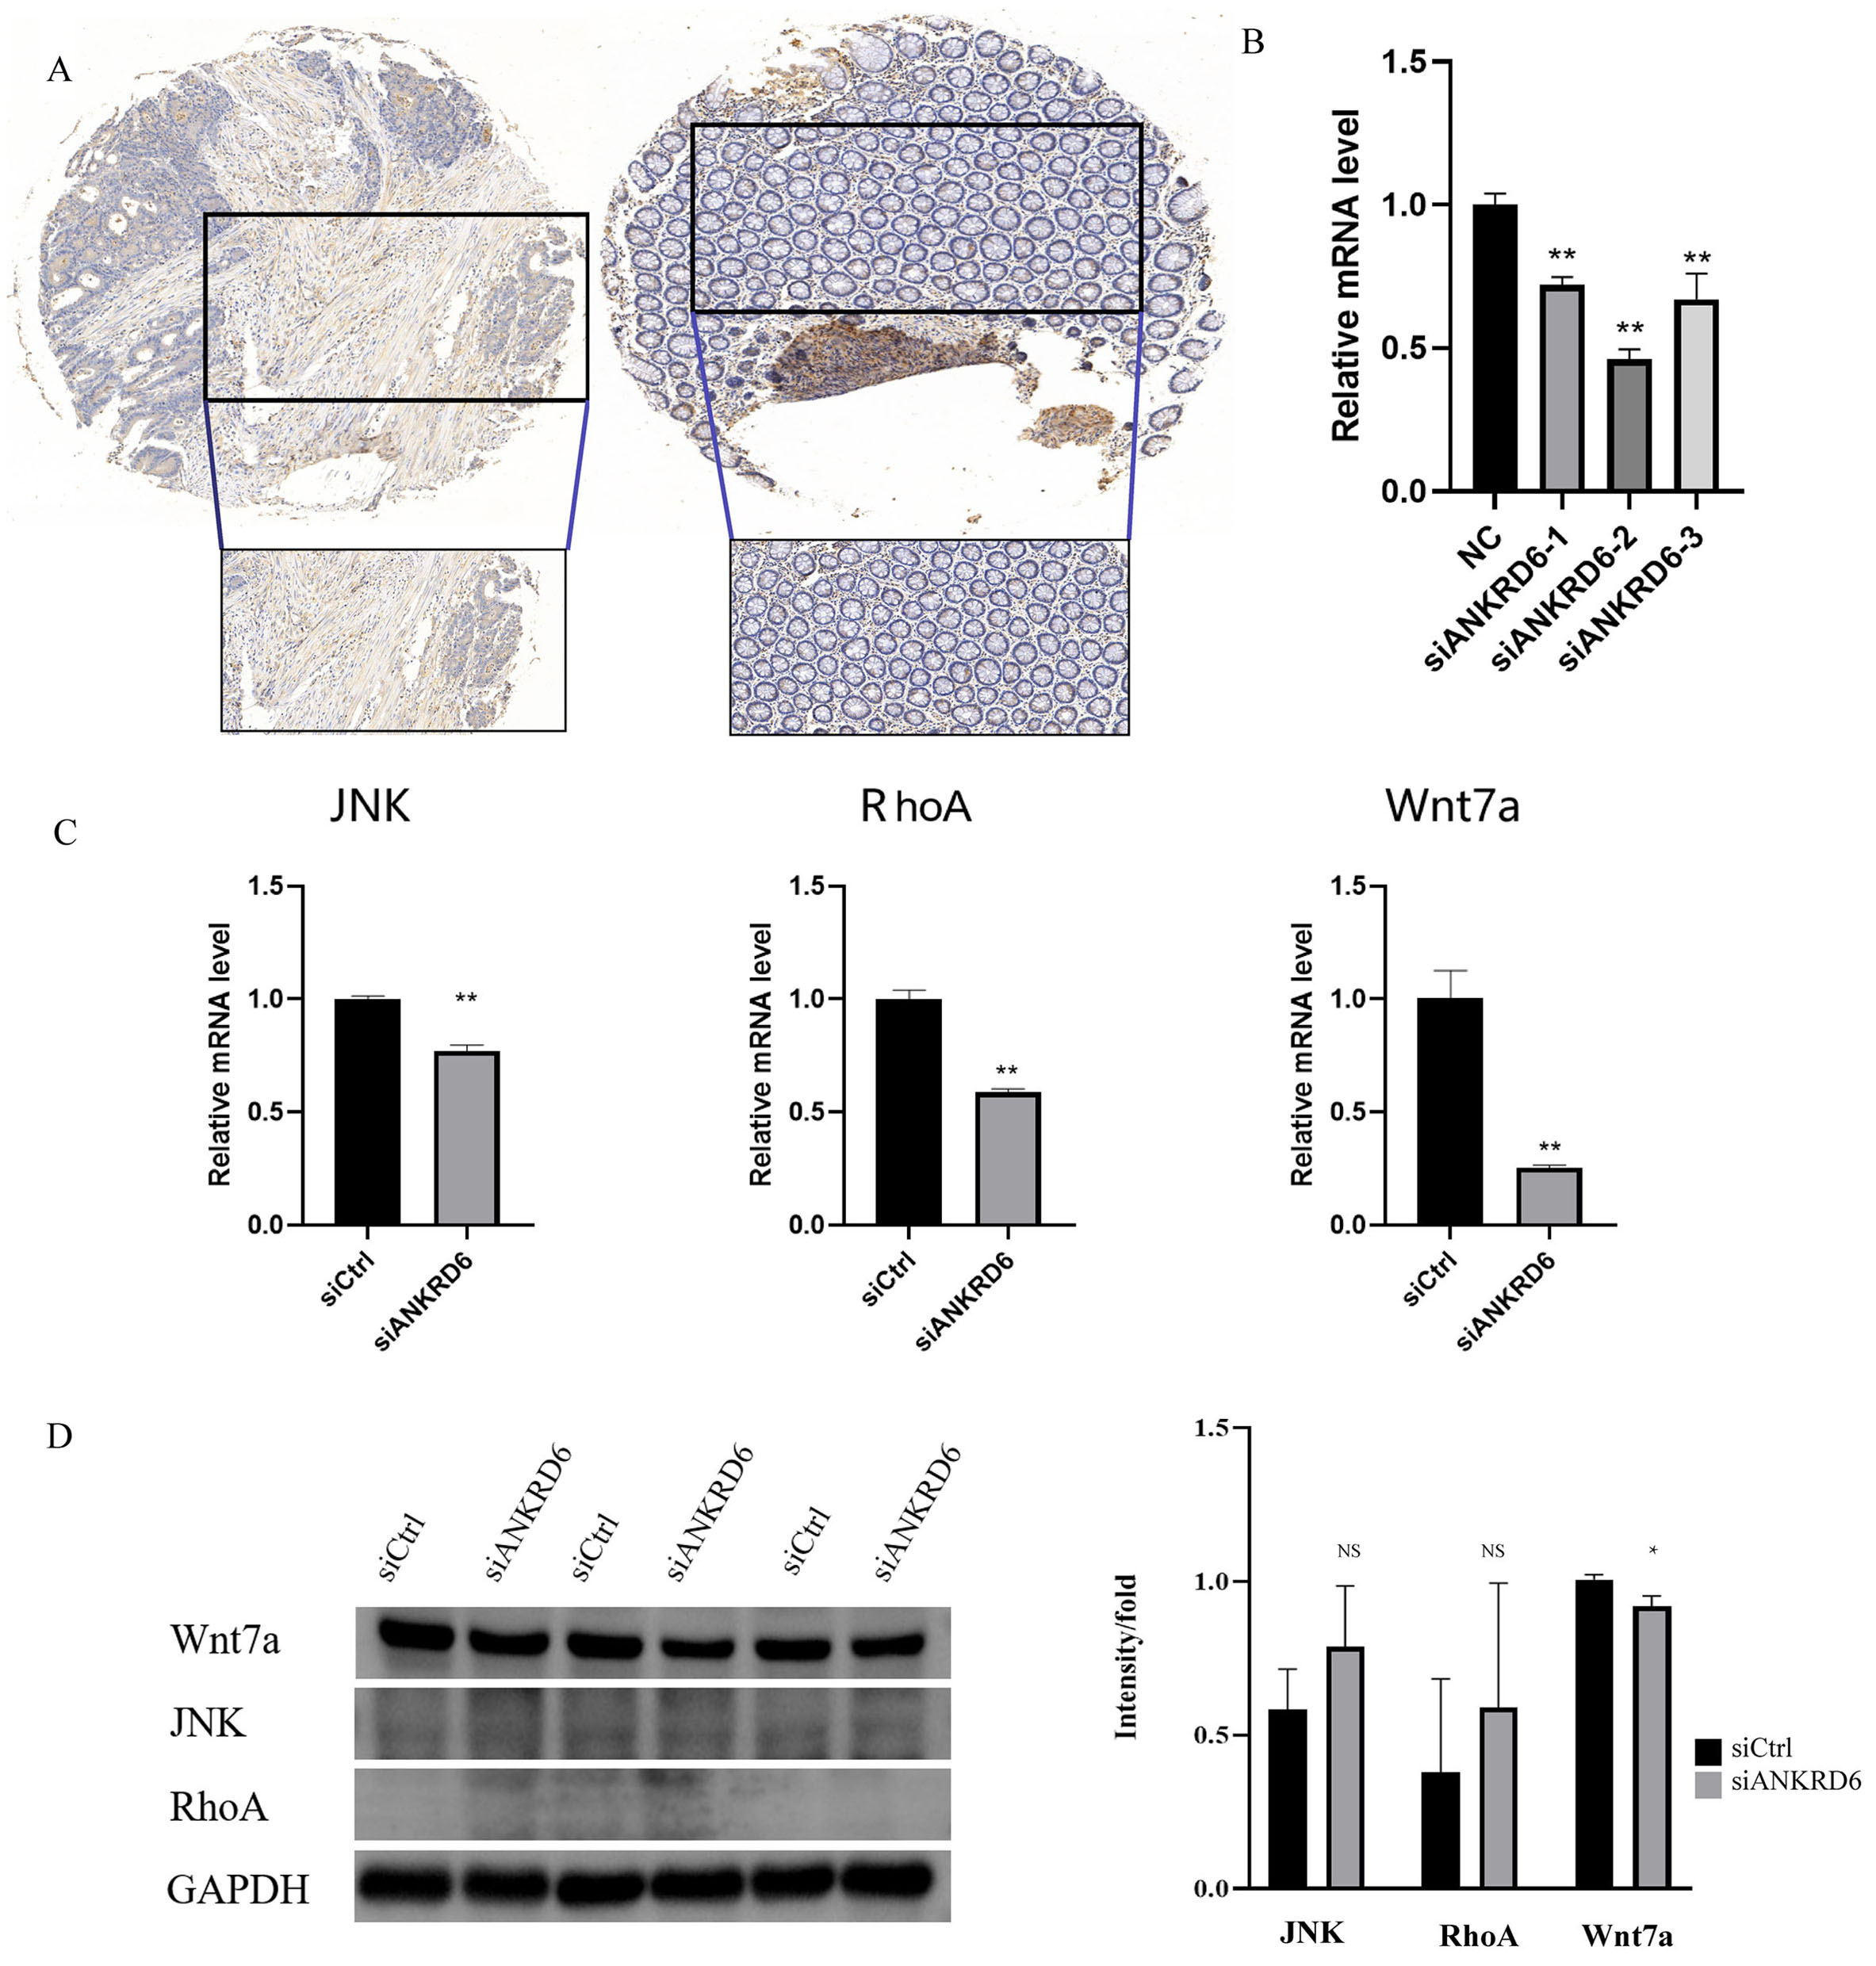
Figure 8. Analysis of the impact of ANKRD6 knockdown on protein expression and related gene expression in Colon Adenocarcinoma cells. (A) Immunohistochemistry revealed cytoplasmic enrichment of ANKRD6 in COAD samples, with positive regions visualized as brown staining, whereas adjacent normal tissues exhibited weaker signals. (B) qPCR results showing that ANKRD6 mRNA levels were significantly reduced in siANKRD6-1, siANKRD6-2, and siANKRD6-3 transfected groups compared to the negative control (NC group)
Silencing ANKRD6 resulted in a pronounced reduction in JNK, RHOA, and WNT7A transcripts (P < 0.01), supporting its role in COAD development through modulation of the Wnt signaling cascade. Western blot validation demonstrated that suppression of ANKRD6 led to a significant reduction in WNT7A protein abundance, while no obvious alterations were observed in JNK or RHOA levels [Figure 8C and D].
These findings are consistent with the qPCR results and further support the notion that ANKRD6 may regulate the Wnt signaling pathway in Colon Adenocarcinoma via specific mechanisms. This discovery provides new scientific evidence for investigating ANKRD6 as a potential therapeutic target in Colon Adenocarcinoma.
DISCUSSION
Cancer constitutes a significant global health burden, ranking among the foremost causes of mortality. As research progresses, scientists have come to realize that cancer development and progression involve not only single-gene mutations but also the dysregulation of complex gene regulatory networks, epigenetic modifications, and the abnormal activation or inhibition of signaling pathways[23]. Therefore, uncovering the mechanisms by which key genes influence cancer is critical for developing novel diagnostic biomarkers and therapeutic targets[24]. Leveraging a pan-cancer analytic framework provides a “global map” of gene expression and prognostic significance across multiple tumor types, helping to distinguish shared oncogenic programs from cancer-type-specific mechanisms. This perspective enables the rational selection of representative malignancies - such as COAD - for in-depth mechanistic investigation and facilitates the translation of molecular insights into precision oncology strategies.
ANKRD6, a potential cancer-related gene, has garnered significant attention in recent years, with studies showing its involvement in various biological processes. However, the specific function and regulatory mechanisms of ANKRD6 in cancer are still not fully understood[25,26].
This study systematically analyzed the expression and biological function of ANKRD6 in various cancers, with a particular focus on its prognostic value, epigenetic modifications, tumor stemness, and pathway regulation in COAD. In COAD, ANKRD6 was markedly upregulated, and subsequent pathway enrichment highlighted significant associations with multiple key signaling networks. GSVA analysis suggested that ANKRD6 is associated with the inhibition of the Wnt signaling pathway, while LASSO regression identified survival-related genes, and GSEA further validated the molecular regulatory mechanisms of ANKRD6. Accumulating studies highlight the central role of Wnt and phosphoinositide 3-kinase (PI3K)/protein kinase B (AKT) signaling pathway(PI3K/AKT) signaling in cancer development, with ANKRD6 emerging as an important regulator of these pathways[15].
Mechanistically, ANKRD6 appears to function as a key modulator of Wnt pathway topology. As an ankyrin-repeat scaffold protein, ANKRD6 has been shown to interact directly with Dishevelled (DVL) and competitively displace Prickle at the DVL-binding interface, thereby biasing signal flux toward the noncanonical Wnt/planar cell polarity (PCP) branch[27]. This interaction facilitates PCP complex assembly and membrane localization, culminating in activation of the downstream RHOA-JNK cascade[28]. Such a mechanism is consistent with the positive association we observed between ANKRD6 and WNT7A expression and the selective enrichment of PCP-related gene sets. In parallel, ANKRD6 has been reported to recruit CK1ε to the Axin-GSK3β-β-catenin destruction complex, promoting β-catenin phosphorylation and proteasomal degradation, ultimately reducing β-catenin/TCF transcriptional output[29]. Together, these findings support a model in which ANKRD6 orchestrates a “PCP-dominant, β-catenin-suppressed” signaling configuration in COAD, providing a coherent explanation for the apparent global Wnt pathway inhibition detected by GSVA and GSEA, despite local upregulation of specific pathway modules.
Although previous studies have suggested that ANKRD6 may exhibit dual roles in different cancers, our current findings focus on its biological function in COAD. Moreover, accumulating evidence suggests that the functional role of ANKRD6 is highly context-dependent across malignancies. Recent studies have demonstrated that tumor heterogeneity, metabolic rewiring, hypoxia-HIF signaling, apoptosis regulation, and immune microenvironment remodeling collectively shape the phenotypic outcome of Wnt pathway modulation by ankyrin repeat proteins, including ANKRD6[30]. These findings provide a mechanistic basis for the “dual role” observed in our pan-cancer analysis, where ANKRD6 may act as a tumor suppressor in certain contexts by promoting β-catenin degradation, yet serve as a tumor promoter in others through PCP-axis activation and enhanced RHOA-JNK signaling[31,32]. This duality highlights the importance of considering cellular context and pathway crosstalk when interpreting the prognostic significance of ANKRD6 across cancer types[33].
Our findings shed light on the context-specific function of ANKRD6 in COAD and provide a rationale for the development of diagnostic biomarkers and targeted interventions grounded in its regulatory networks[34]. Cox regression and log-rank tests demonstrated that ANKRD6 expression exhibits heterogeneous prognostic implications across different malignancies, functioning as both a favorable and adverse indicator depending on cancer type. Specifically, high ANKRD6 expression was associated with better prognosis in glioblastoma, lung adenocarcinoma, and lower-grade glioma, potentially inhibiting tumor proliferation and invasion by regulating the cell cycle and DNA repair pathways[35,36]. In these malignancies, including gastroesophageal adenocarcinoma, renal clear cell carcinoma, COAD, and gastric cancer, higher ANKRD6 levels predicted poorer survival, potentially due to activation of pro-tumorigenic signaling cascades that facilitate proliferation and metastasis[37]. Based on ROC analysis, ANKRD6 displayed moderate discriminative ability in COAD and lung adenocarcinoma, reflected by AUCs of 0.715, 0.722, and 0.766, implying that it may require combination with other markers to improve diagnostic value. However, combining ANKRD6 with other molecular markers in a multi-factor diagnostic model may enhance its diagnostic efficacy, especially for early screening of colorectal and COAD[38]. Taken together, the data indicate that ANKRD6 plays divergent roles depending on the tumor type, underscoring its relevance to cancer prognosis. Future efforts integrating multi-center datasets and functional studies are warranted to consolidate its value as a biomarker and therapeutic candidate.
In line with our bulk transcriptomic findings, single-cell and spatial transcriptomic analyses further delineate the context-specific role of ANKRD6 within the CRC microenvironment. Rather than being uniformly expressed, ANKRD6 localized predominantly to fibroblasts and malignant epithelial clusters, implying a stromal-tumor axis of regulation. Its positive correlation with CD4+ T cells and tumor cells, together with negative association with plasma cells and fibroblasts, suggests that ANKRD6 may participate in reshaping immune-stromal balance toward a pro-tumor milieu. The spatial enrichment of ANKRD6 in malignant versus adjacent nMal regions further supports its functional involvement in tumor progression rather than passive expression drift. Collectively, these findings extend the mechanistic model of ANKRD6 beyond canonical Wnt regulation to encompass microenvironmental remodeling, offering a potential link between intracellular signaling bias and tissue-level heterogeneity in COAD.
Epigenetic alterations, with DNA methylation being the most prominent, are central to controlling transcriptional activity in tumor biology. This study revealed differential methylation patterns of ANKRD6 across various cancers. In kidney renal papillary cell carcinoma, melanoma, and thyroid cancer, high methylation of ANKRD6 may impair its tumor-suppressive function through gene silencing, promoting tumor development. Conversely, in kidney renal clear cell carcinoma, bladder cancer, breast cancer, and COAD, low methylation of ANKRD6 may activate the Wnt and PI3K/AKT signaling pathways, driving tumor progression. Multiple reports have demonstrated that dysregulation of the PI3K/AKT pathway, via aberrant DNA methylation or enhanced signaling to downstream effectors, plays a pivotal role in cancer initiation and progression[39]. Moreover, ANKRD6 methylation levels were negatively correlated with gene expression, particularly in gastric cancer, where high methylation significantly suppressed its expression, thereby promoting tumor progression[40]. In summary, the divergent methylation profiles of ANKRD6 across tumor types suggest a context-dependent role in oncogenesis and emphasize its translational relevance for biomarker development and targeted therapy.
In recent years, RNA modifications have gained increasing recognition for their role in regulating gene expression. This study found that ANKRD6 was significantly correlated with multiple RNA modification regulators (e.g., FTO, DNMT3A) in COAD, suggesting that ANKRD6 may participate in cancer development through RNA modification regulation. Notably, the positive correlation with FTO indicates a potential role for m6A modifications in regulating ANKRD6. As the major m6A demethylase, FTO promotes cancer progression by regulating gene expression and signaling pathways in various cancers, including COAD[41]. Additionally, FTO regulates mRNA stability in tumor cells via demethylation, thereby modulating gene expression and cancer progression[42]. These findings suggest that m6A modification and its regulatory mechanisms may play key roles in cancer development, offering potential targets for future cancer therapies.
Tumor stem cells are key factors contributing to tumor recurrence, metastasis, and drug resistance. This study found that ANKRD6 was significantly negatively correlated with multiple tumor stemness scores, particularly in COAD, where ANKRD6 may inhibit tumor recurrence and metastasis by suppressing stem cell-like properties and reducing the proportion of cancer stem cells. Tumor stem cells possess a high capacity for self-renewal and drug resistance, allowing them to evade conventional chemotherapy and reinitiate tumor growth after treatment[43,44]. Moreover, the inhibitory effect of ANKRD6 may be achieved by blocking stemness-related signaling pathways such as Wnt and Notch, thereby suppressing cancer stem cell characteristics[45]. Thus, ANKRD6 could be a potential target for COAD therapy, inhibiting tumor progression by modulating tumor stem cell traits.
Consistent with our bioinformatics findings, GSVA revealed a significant negative correlation between ANKRD6 expression and overall Wnt signaling pathway activity in COAD, suggesting that ANKRD6 may act as a suppressor of canonical Wnt signaling. LASSO regression further identified 25 Wnt pathway genes associated with COAD survival, among which WNT7A, RHOA, and MAPK8 were most strongly correlated with ANKRD6 expression. In vitro experiments confirmed that ANKRD6 knockdown markedly reduced the expression of these genes, leading to impaired proliferation and invasion of COAD cells. These results are in line with previous reports showing that Wnt signaling drives tumor progression by regulating cell growth and metastasis[46]. Specifically, WNT7A promotes tumor cell migration by activating the RHOA signaling axis, whereas MAPK8 serves as a critical mediator of downstream signal transduction[47]. It is noteworthy, however, that WNT7A displayed a negative regression coefficient in the multigene LASSO survival model, indicating a favorable prognostic association in this multivariate context. This finding does not necessarily contradict its positive correlation with ANKRD6 but rather highlights the complexity of Wnt pathway regulation, where individual genes may exert context-dependent or compensatory effects. Together with the observed β-catenin suppression and PCP-axis activation, these data support a model in which ANKRD6 orchestrates a “PCP-biased, canonical Wnt-suppressed” network configuration, consistent with the GSVA/GSEA results and the phenotypic consequences observed in functional assays.
This study reveals the differential expression of ANKRD6 across various cancers and its potential biological functions. However, there are several limitations. First, the data primarily derive from the TCGA database, and the absence of validation in independent external cohorts may limit the generalizability of the results. Second, although bioinformatics analysis revealed an association between ANKRD6 and the Wnt signaling pathway, our functional validation was limited to two COAD cell lines and transient siRNA-mediated knockdown, without direct phenotypic assessment of proliferation, migration, or apoptosis. Third, the number of clinical samples used for IHC validation was relatively small, which may not fully reflect the spatial and interpatient heterogeneity of ANKRD6 expression in CRC tissues. In addition, single-cell and spatial transcriptomic analyses revealed that ANKRD6 shows diffuse expression across multiple cell types, with modest enrichment in fibroblasts. This pattern implies a role in tumor-stroma communication rather than tumor cells alone. Future studies using co-culture or fibroblast-derived organoid models are warranted to better capture this microenvironmental context[48,49]. This approach may not fully recapitulate the in vivo tumor microenvironment or the long-term biological effects of ANKRD6 modulation. Therefore, the present work should be interpreted as hypothesis-generating, and its conclusions drawn with appropriate caution. Future studies should incorporate stable knockdown or lustered regularly interspaced short palindromic repeats/CRISPR-associated protein 9 (CRISPR/Cas9)-mediated knockout models, complemented by xenograft and patient-derived organoid systems, to provide more physiologically relevant evidence. Previous research has shown that the Wnt signaling pathway is closely related to tumor progression in COAD, with ANKRD6 exerting anti-tumor effects by inhibiting key genes in the Wnt signaling pathway, such as WNT7A, RHOA, and MAPK8[50]. Additional work focusing on the epigenetic and post-transcriptional regulation of ANKRD6 is warranted. These efforts will help construct a more comprehensive mechanistic framework and may ultimately facilitate the translation of ANKRD6 into a clinically actionable biomarker or therapeutic target in COAD.
Conclusions
This study systematically characterized ANKRD6 across human cancers and identified its context-dependent prognostic role. In COAD, high ANKRD6 expression was associated with poor survival and overall suppression of canonical Wnt signaling, as revealed by GSVA and GSEA analyses. LASSO regression identified WNT7A, RHOA, and MAPK8 as survival-associated hub genes within the Wnt pathway, and qPCR and Western blot assays confirmed a positive regulatory relationship between ANKRD6 and WNT7A expression. Single-cell and spatial transcriptomic analyses revealed ANKRD6 enrichment in fibroblasts and tumor epithelial cells, closely linked to immune-stromal interactions in CRC. Together, these findings suggest that ANKRD6 serves as a key modulator of Wnt pathway activity in COAD and may contribute to tumor progression through complex regulatory mechanisms. Our results highlight ANKRD6 as a potential prognostic biomarker and therapeutic target, while also providing a basis for further functional and mechanistic studies to validate its role and explore its clinical applicability.
DECLARATIONS
Acknowledgements
The authors acknowledge Xiantao Academic (https://www.xiantao.love) for its support with data visualization. All figures were generated and finalized by the authors based on original analyses.
Authors' contributions
Participated in in vitro experiments and bioinformatics analysis, study design, data analysis, and manuscript drafting: Zhao H
Participated in in vitro experiments and statistical analysis, data collection, and bioinformatics analysis: Fang Y
Performed validation experiments and contributed to data interpretation: Yang N
Provided technical support for bioinformatics and contributed to data interpretation: Liu G
Conducted statistical analysis and contributed to manuscript revision: Chen X
Supervised the project, reviewed, and edited the manuscript as the corresponding author: Zhao J
Availability of data and materials
The datasets used and analyzed during the current study are available from the corresponding author upon reasonable request.
Financial support and sponsorship
This study was supported by the following grants: the 2023 Anhui Provincial Health and Wellness Research Project (Grant No. AHWJ2023Bba20065); the Anhui Province Clinical Medicine Research and Transformation Program (Grant No. 202427b10020034); the 2024 University-Enterprise Integrated Development “Qilu Research Fund” Project (Grant No. XQQL202408); and the 2024 Key Research Project Fund (Natural Sciences Category) (Grant No. WK2024ZZD28).
Conflicts of interest
All authors declared that there are no conflicts of interest.
Ethical approval and consent to participate
The Ethics Committee of the First Affiliated Hospital of Wannan Medical College (Yijishan Hospital) approved the study (Wuhu, China; Approval No. 202220). The study was conducted in accordance with local legislation and institutional requirements. Written informed consent was obtained from all participants, including consent for the publication of any potentially identifiable images or data.
Consent for publication
Not applicable.
Copyright
© The Author(s) 2025.
Supplementary Materials
REFERENCES
1. Siegel RL, Miller KD, Goding Sauer A, et al. Colorectal cancer statistics, 2020. CA Cancer J Clin. 2020;70:145-64.
2. Dekker E, Tanis PJ, Vleugels JLA, Kasi PM, Wallace MB. Colorectal cancer. Lancet. 2019;394:1467-80.
3. Tao Y, Li J, Pan J, et al. Integration of scRNA-seq and bulk RNA-Seq identifies circadian rhythm disruption-related genes associated with prognosis and drug resistance in colorectal cancer patients. Immunotargets Ther. 2025;14:475-89.
4. Guinney J, Dienstmann R, Wang X, et al. The consensus molecular subtypes of colorectal cancer. Nat Med. 2015;21:1350-6.
5. Wang X, Wei W, Hua N, Li C, Yu L. Diagnostic value of serum fibrin degradation complex DR-70 combined with conventional tumor biomarkers in colorectal cancer. J Int Med Res. 2024;52:3000605241266236.
6. Osseis M, Nehmeh WA, Rassy N, et al. Surgery for T4 colorectal cancer in older patients: determinants of outcomes. J Pers Med. 2022;12:1534.
7. Kalyan A, Kircher S, Shah H, Mulcahy M, Benson A. Updates on immunotherapy for colorectal cancer. J Gastrointest Oncol. 2018;9:160-9.
8. Chen Y, Xiao C, Fan Q, Zhang Y, Huang Q, Ou Y. Multi-omics pan-cancer analysis of procollagen N-propeptidase gene family of ADAMTS as novel biomarkers to associate with prognosis, tumor immune microenvironment, signaling pathways, and drug sensitivities. Front Biosci. 2024;29:151.
9. Xie J, Xie Y, Tan W, et al. Deciphering the role of ELAVL1: insights from pan-cancer multiomics analyses with emphasis on nasopharyngeal carcinoma. J Transl Int Med. 2025;13:138-55.
10. Bai R, Wu D, Shi Z, et al. Pan-cancer analyses demonstrate that ANKRD6 is associated with a poor prognosis and correlates with M2 macrophage infiltration in colon cancer. Chin J Cancer Res. 2021;33:93-102.
11. Zheng P, Yang S, Ren D, Zhang X, Bai Q. A pan-cancer analysis of the oncogenic role of methyltransferase-like 1 in human tumors. Neurol India. 2024;72:837-45.
12. Elizazu J, Artetxe-Zurutuza A, Otaegi-Ugartemendia M, et al. Identification of a novel gene signature related to prognosis and metastasis in gastric cancer. Cell Oncol. 2024;47:1355-73.
13. Nie K, He ZJ, Kong LJ. NR3C2 affects the proliferation and invasiveness of colon cancer cells through the Wnt/β-Catenin signaling pathway. J Cancer Res Clin Oncol. 2024;150:411.
14. Tian J, Cao X, Jiang Z, et al. LncRNA CCAT2 promotes the proliferation and metastasis of colorectal cancer through activation of the ERK and Wnt signaling pathways by regulating GNB2 expression. Cancer Med. 2024;13:e70169.
15. Zhao H, Liu G, Li Y, Yang N, Zhao J. [High expression of ANKRD6 is an indicator for poor prognosis of colon adenocarcinoma]. Nan Fang Yi Ke Da Xue Xue Bao. 2023;43:1715-24.
16. Liu S, Lv S, Li X, Lu W, Chen S. The signature genes of cuproptosis associates with tumor immune microenvironment and predicts prognosis in kidney renal clear cell carcinoma. Front Oncol. 2024;14:1409620.
17. Zhao Z, Song Z, Wang Z, et al. Retinol dehydrogenase 10 promotes epithelial-mesenchymal transition in spinal cord gliomas via PI3K/AKT pathway. Int J Immunopathol Pharmacol. 2024;38:3946320241276336.
18. Lin X, Zheng J, Cai X, et al. Glycometabolism and lipid metabolism related genes predict the prognosis of endometrial carcinoma and their effects on tumor cells. BMC Cancer. 2024;24:571.
19. Malta TM, Sokolov A, Gentles AJ, et al. Machine learning identifies stemness features associated with oncogenic dedifferentiation. Cell. 2018;173:338-54.e15.
20. Xun Z, Ding X, Zhang Y, et al. Reconstruction of the tumor spatial microenvironment along the malignant-boundary-nonmalignant axis. Nat Commun. 2023;14:933.
21. Shi J, Wei X, Xun Z, et al. The web-based portal SpatialTME integrates histological images with single-cell and spatial transcriptomics to explore the tumor microenvironment. Cancer Res. 2024;84:1210-20.
22. Varghese F, Bukhari AB, Malhotra R, De A. IHC profiler: an open source plugin for the quantitative evaluation and automated scoring of immunohistochemistry images of human tissue samples. PLoS One. 2014;9:e96801.
23. Jung I, An J, Ko M. Epigenetic regulators of DNA cytosine modification: promising targets for cancer therapy. Biomedicines. 2023;11:654.
24. Yang Q, Jiang W, Hou P. Emerging role of PI3K/AKT in tumor-related epigenetic regulation. Semin Cancer Biol. 2019;59:112-24.
25. Weng J, Lin J, Xie Y, et al. Abstract 6006: RNA m6A methylation relay the oncogenic flow from DNA methylationto gene expression of ANKRD13B. Cancer Res. 2023;83:6006.
26. He CM, Zhang XD, Zhu SX, et al. Integrative pan-cancer analysis and clinical characterization of the N7-methylguanosine (m7G) RNA modification regulators in human cancers. Front Genet. 2022;13:998147.
27. Cirone P, Lin S, Griesbach HL, Zhang Y, Slusarski DC, Crews CM. A role for planar cell polarity signaling in angiogenesis. Angiogenesis. 2008;11:347-60.
29. Schwarz-Romond T, Asbrand C, Bakkers J, et al. The ankyrin repeat protein Diversin recruits Casein kinase Iepsilon to the beta-catenin degradation complex and acts in both canonical Wnt and Wnt/JNK signaling. Genes Dev. 2002;16:2073-84.
30. Qiong L, Shuyao X, Shan X, et al. Recent advances in the glycolytic processes linked to tumor metastasis. Curr Mol Pharmacol. 2024;17:e18761429308361.
31. Karati D, Kumar D. Molecular insight into the apoptotic mechanism of cancer cells: an explicative review. Curr Mol Pharmacol. 2024;17:e18761429273223.
32. Yin CL, Ma YJ. The regulatory mechanism of hypoxia-inducible factor 1 and its clinical significance. Curr Mol Pharmacol. 2024;17:e18761429266116.
33. Sensi B, Angelico R, Toti L, et al. Mechanism, potential, and concerns of immunotherapy for hepatocellular carcinoma and liver transplantation. Curr Mol Pharmacol. 2024;17:e18761429310703.
34. Chen JS, Huang JQ, Luo B, et al. PIK3CD induces cell growth and invasion by activating AKT/GSK-3β/β-catenin signaling in colorectal cancer. Cancer Sci. 2019;110:997-1011.
35. Bai J, Zhang X, Xiang ZX, Zhong PY, Xiong B. Identification of prognostic immune-related signature predicting the overall survival for colorectal cancer. Eur Rev Med Pharmacol Sci. 2020;24:1134-41.
36. Zhou L, Yu Y, Wen R, et al. Development and validation of an 8-gene signature to improve survival prediction of colorectal cancer. Front Oncol. 2022;12:863094.
37. Cai Z, Zhou F. A novel Anoikis and immune-related genes marked prognostic signature for colorectal cancer. Medicine. 2022;101:e31127.
38. Chen Z, Chen M, Xue Z, Zhu X. Comprehensive analysis of gene expression profiles identifies a P4HA1-related gene panel as a prognostic model in colorectal cancer patients. Cancer Biother Radiopharm. 2021;36:693-704.
39. Faleiro I, Roberto VP, Demirkol Canli S, et al. DNA methylation of PI3K/AKT pathway-related genes predicts outcome in patients with pancreatic cancer: a comprehensive bioinformatics-based study. Cancers. 2021;13:6354.
40. Zhao Q, Zhao Y, Hu W, et al. m6A RNA modification modulates PI3K/Akt/mTOR signal pathway in Gastrointestinal Cancer. Theranostics. 2020;10:9528-43.
41. Tsuruta N, Tsuchihashi K, Ohmura H, et al. RNA N6-methyladenosine demethylase FTO regulates PD-L1 expression in colon cancer cells. Biochem Biophys Res Commun. 2020;530:235-9.
42. Niu Y, Lin Z, Wan A, et al. RNA N6-methyladenosine demethylase FTO promotes breast tumor progression through inhibiting BNIP3. Mol Cancer. 2019;18:46.
43. Ma YS, Li W, Liu Y, Shi Y, Lin QL, Fu D. Targeting colorectal cancer stem cells as an effective treatment for colorectal cancer. Technol Cancer Res Treat. 2020;19:1533033819892261.
44. Li N, Babaei-Jadidi R, Lorenzi F, et al. An FBXW7-ZEB2 axis links EMT and tumour microenvironment to promote colorectal cancer stem cells and chemoresistance. Oncogenesis. 2019;8:13.
45. Das PK, Islam F, Lam AK. The roles of cancer stem cells and therapy resistance in colorectal carcinoma. Cells. 2020;9:1392.
46. Li J, Li S, Xing X, et al. FTO-mediated ZNF687 accelerates tumor growth, metastasis, and angiogenesis in colorectal cancer through the Wnt/β-catenin pathway. Biotechnol Appl Biochem. 2024;71:245-55.
47. Zhang H, Xu C, Jiang F, Feng J. A three-genes signature predicting colorectal cancer relapse reveals LEMD1 promoting CRC cells migration by RhoA/ROCK1 signaling pathway. Front Oncol. 2022;12:823696.
49. Aizawa T, Karasawa H, Funayama R, et al. Cancer-associated fibroblasts secrete Wnt2 to promote cancer progression in colorectal cancer. Cancer Med. 2019;8:6370-82.
Cite This Article
How to Cite
Download Citation
Export Citation File:
Type of Import
Tips on Downloading Citation
Citation Manager File Format
Type of Import
Direct Import: When the Direct Import option is selected (the default state), a dialogue box will give you the option to Save or Open the downloaded citation data. Choosing Open will either launch your citation manager or give you a choice of applications with which to use the metadata. The Save option saves the file locally for later use.
Indirect Import: When the Indirect Import option is selected, the metadata is displayed and may be copied and pasted as needed.
About This Article
Special Topic
Copyright

Data & Comments
Data
0


Comments
Comments must be written in English. Spam, offensive content, impersonation, and private information will not be permitted. If any comment is reported and identified as inappropriate content by OAE staff, the comment will be removed without notice. If you have any queries or need any help, please contact us at [email protected].