


fig8
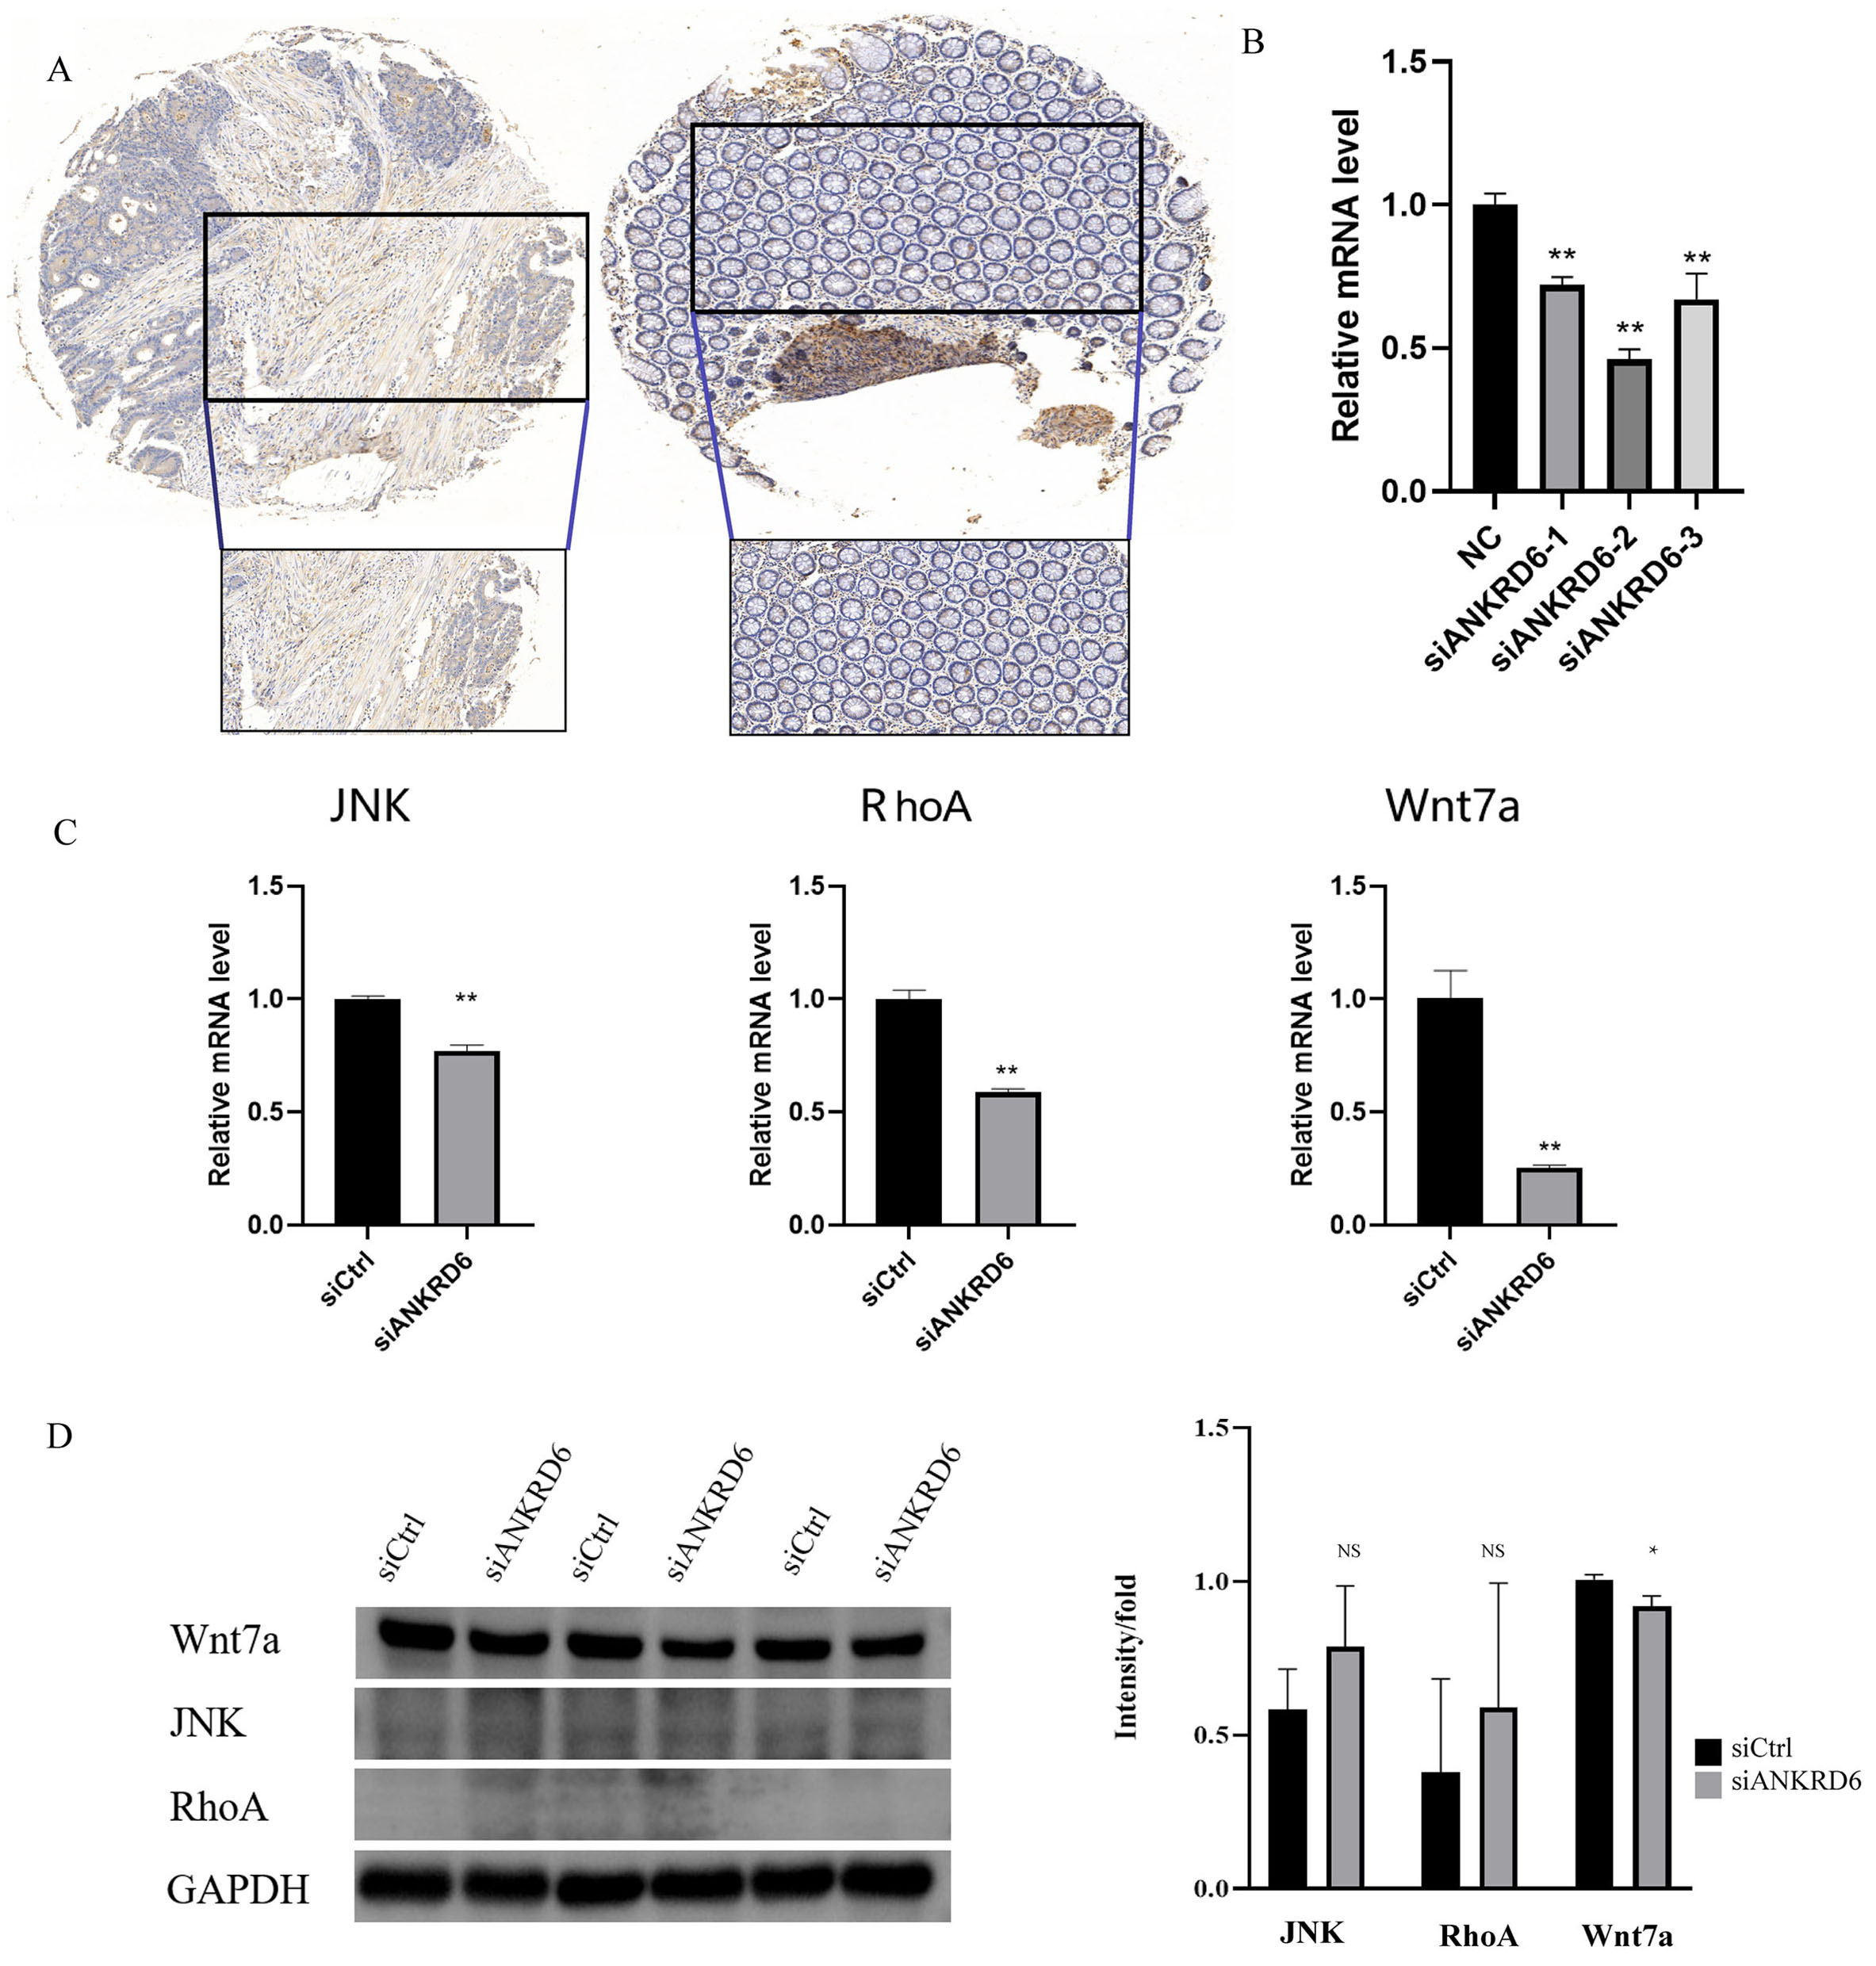
Figure 8. Analysis of the impact of ANKRD6 knockdown on protein expression and related gene expression in Colon Adenocarcinoma cells. (A) Immunohistochemistry revealed cytoplasmic enrichment of ANKRD6 in COAD samples, with positive regions visualized as brown staining, whereas adjacent normal tissues exhibited weaker signals. (B) qPCR results showing that ANKRD6 mRNA levels were significantly reduced in siANKRD6-1, siANKRD6-2, and siANKRD6-3 transfected groups compared to the negative control (NC group)


