


fig4
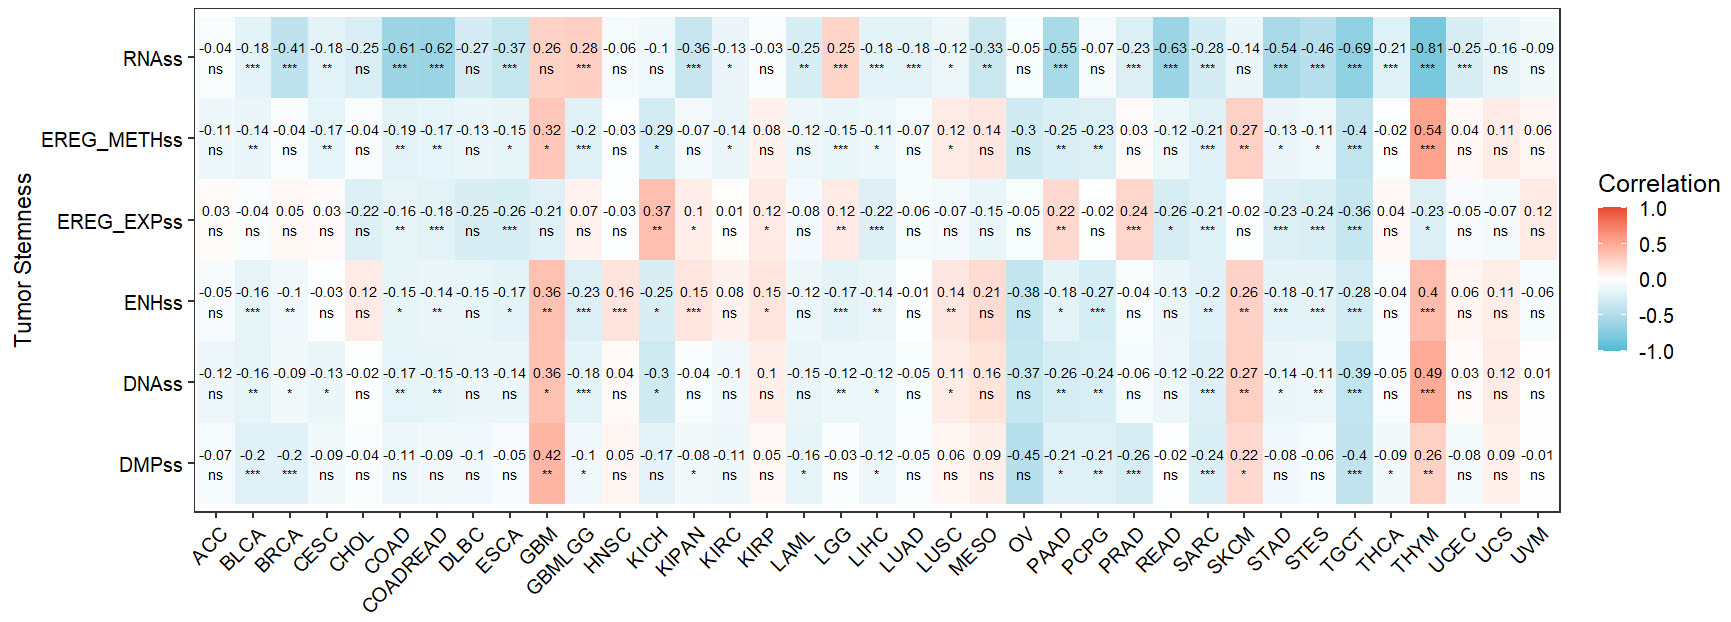
Figure 4. Correlation between ANKRD6 expression and tumor stemness indices across cancer types. Heatmap illustrating the Pearson correlation coefficients between ANKRD6 expression and various tumor stemness scores, including RNAss, EREG_METHss, EREG_EXPss, ENHss, DNAss, and DMPss, across different cancer types. The color scale represents correlation strength, with red indicating positive correlations and blue indicating negative correlations. Deeper colors correspond to stronger correlations. (ns: Not significant; *P < 0.05; **P < 0.01; ***P < 0.001).


