


fig5
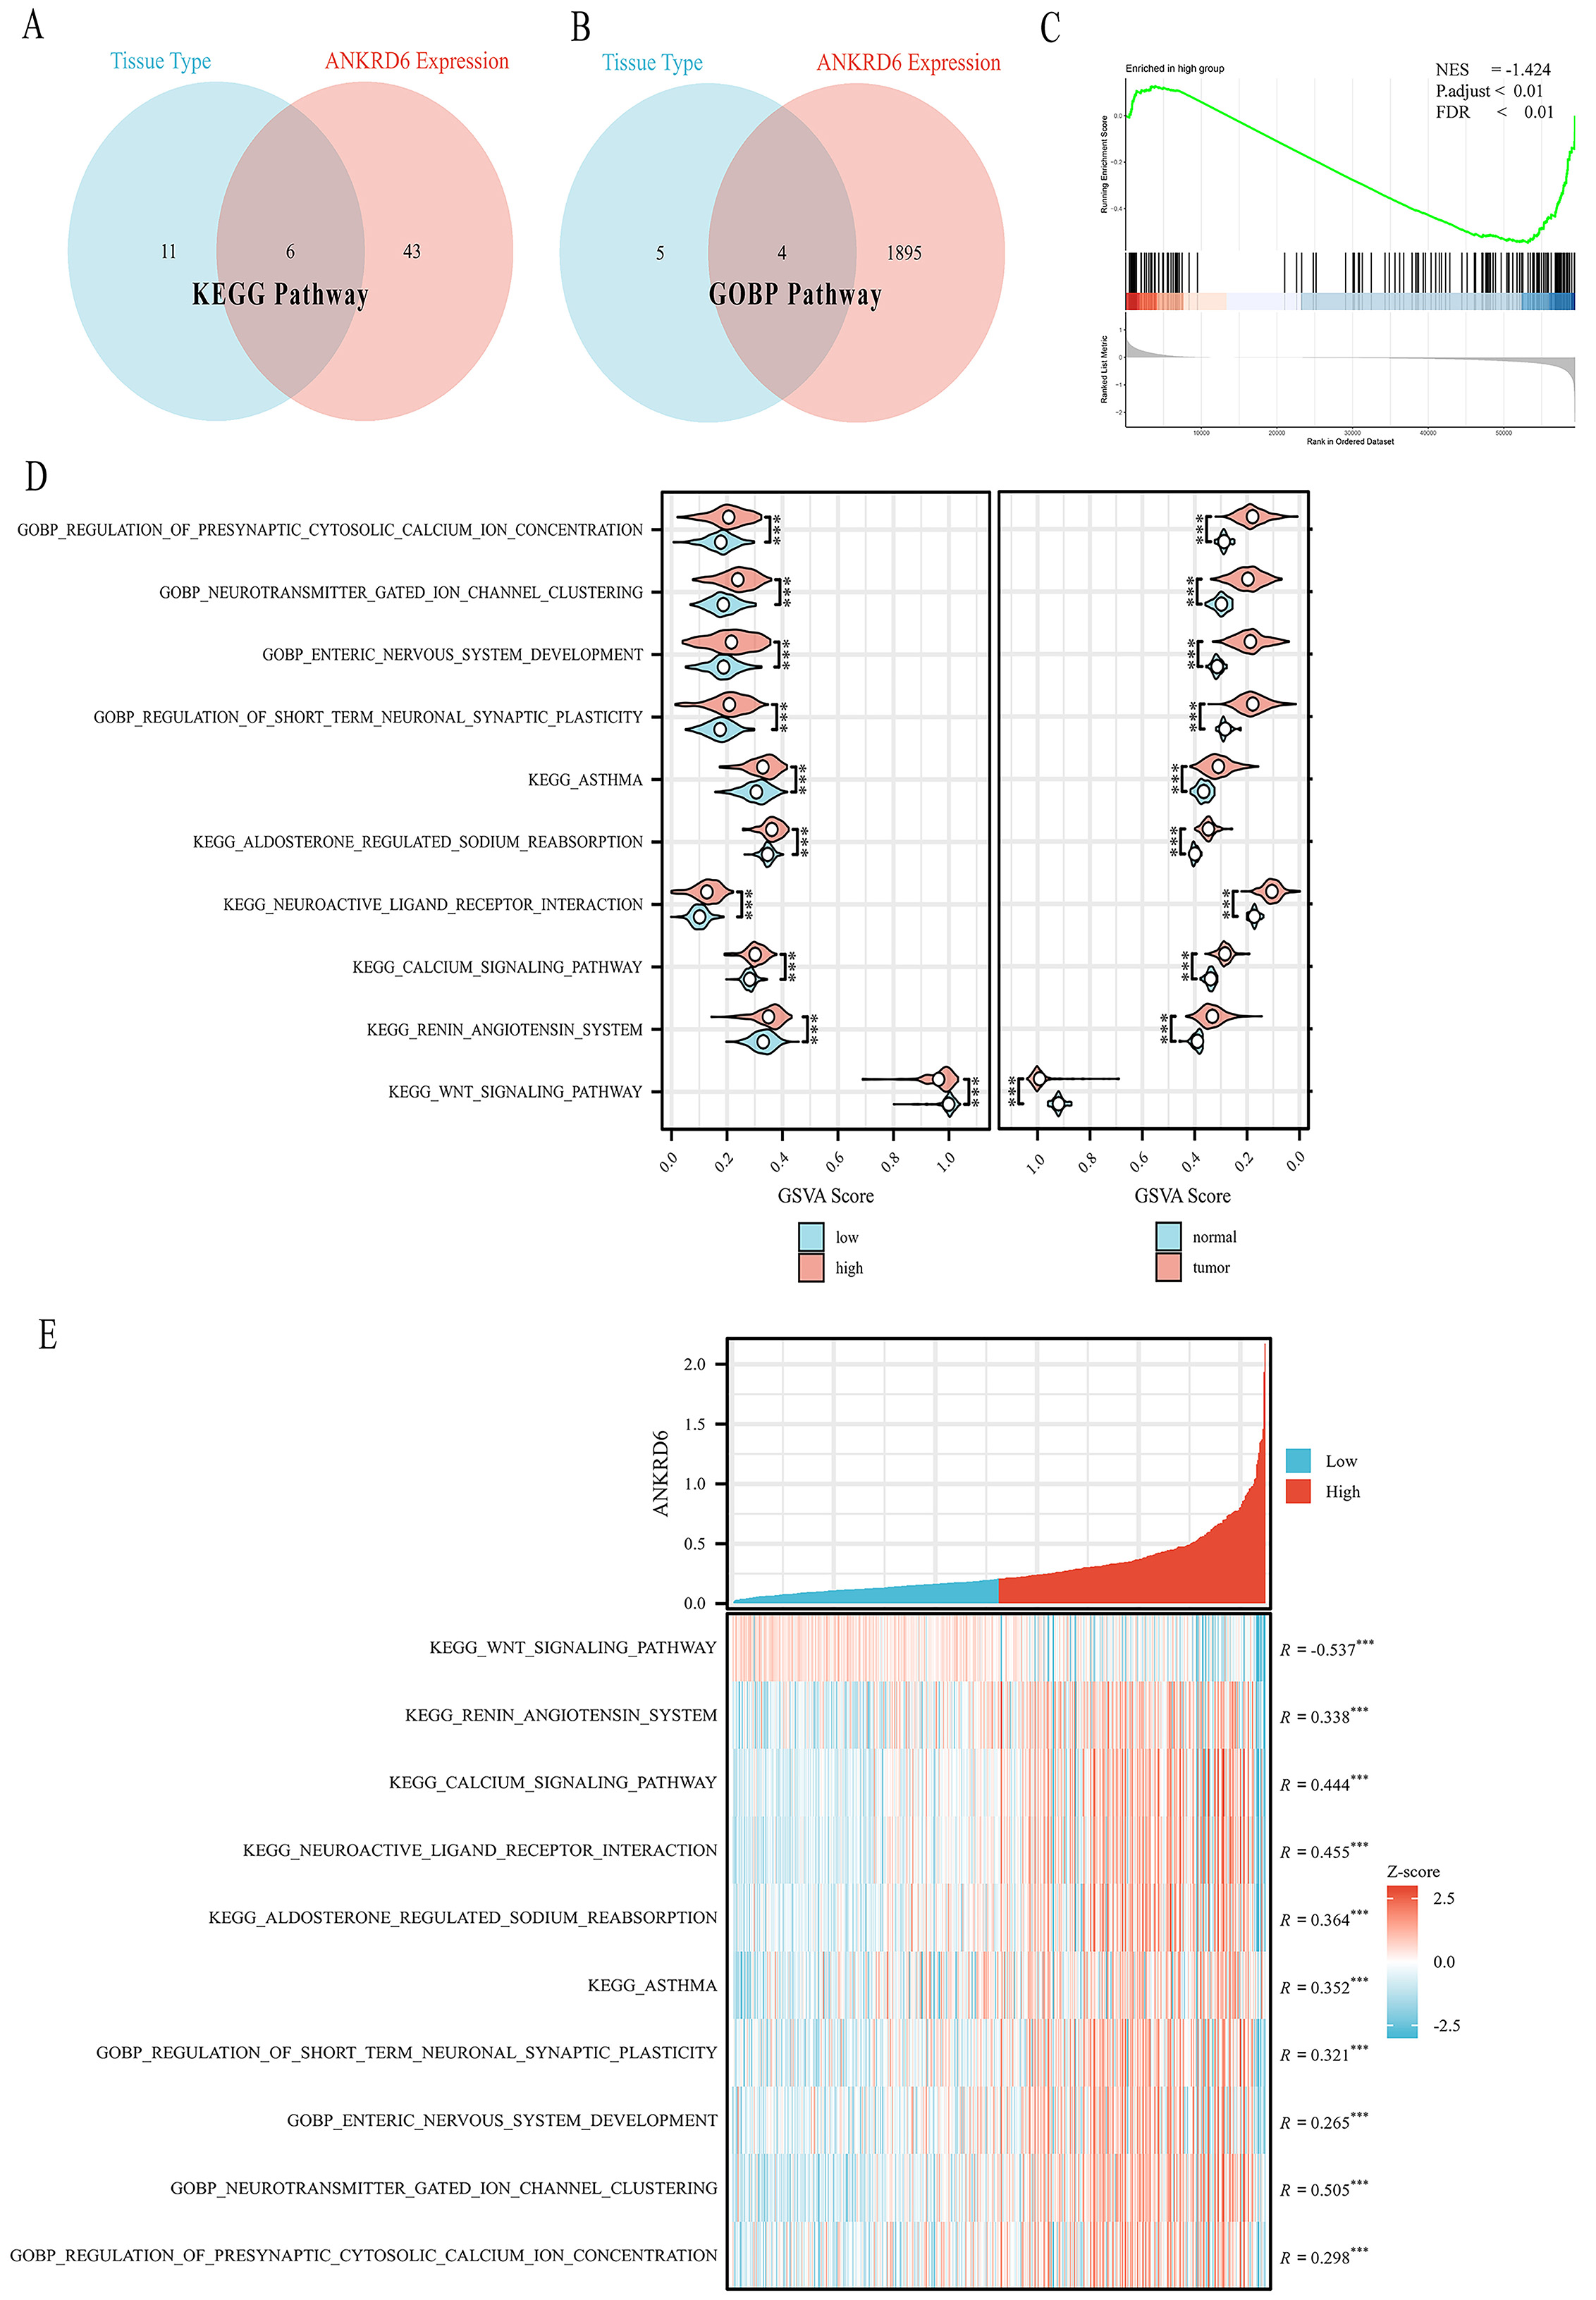
Figure 5. Association between ANKRD6 expression and pathway activity in COAD. (A) KEGG pathway intersection analysis showing the relationship between ANKRD6 expression levels and tissue type. (B) GO-BP pathway intersection analysis showing the relationship between ANKRD6 expression levels and tissue type. (C) GSEA showing suppression of the KEGG_WNT_SIGNALING_PATHWAY in the high ANKRD6 expression group, with a negative normalized enrichment score (NES = -1.424) and statistically significant adjusted


