Deciphering the role of CHST14 in gastric cancer through in silico analysis
Abstract
Background: Gastric cancer’s heterogeneous nature and subtle symptoms necessitate the identification of reliable diagnostic and prognostic biomarkers.
Methods: CHST14 expression in gastric cancer was analyzed using TCGA and GTEx data. Differentially expressed genes were identified and visualized through ROC, survival, volcano plots, and nomograms. Functional analyses included GO and KEGG enrichment, drug sensitivity predictions from the GDSC database, and immune cell infiltration estimation using TIMER algorithms.
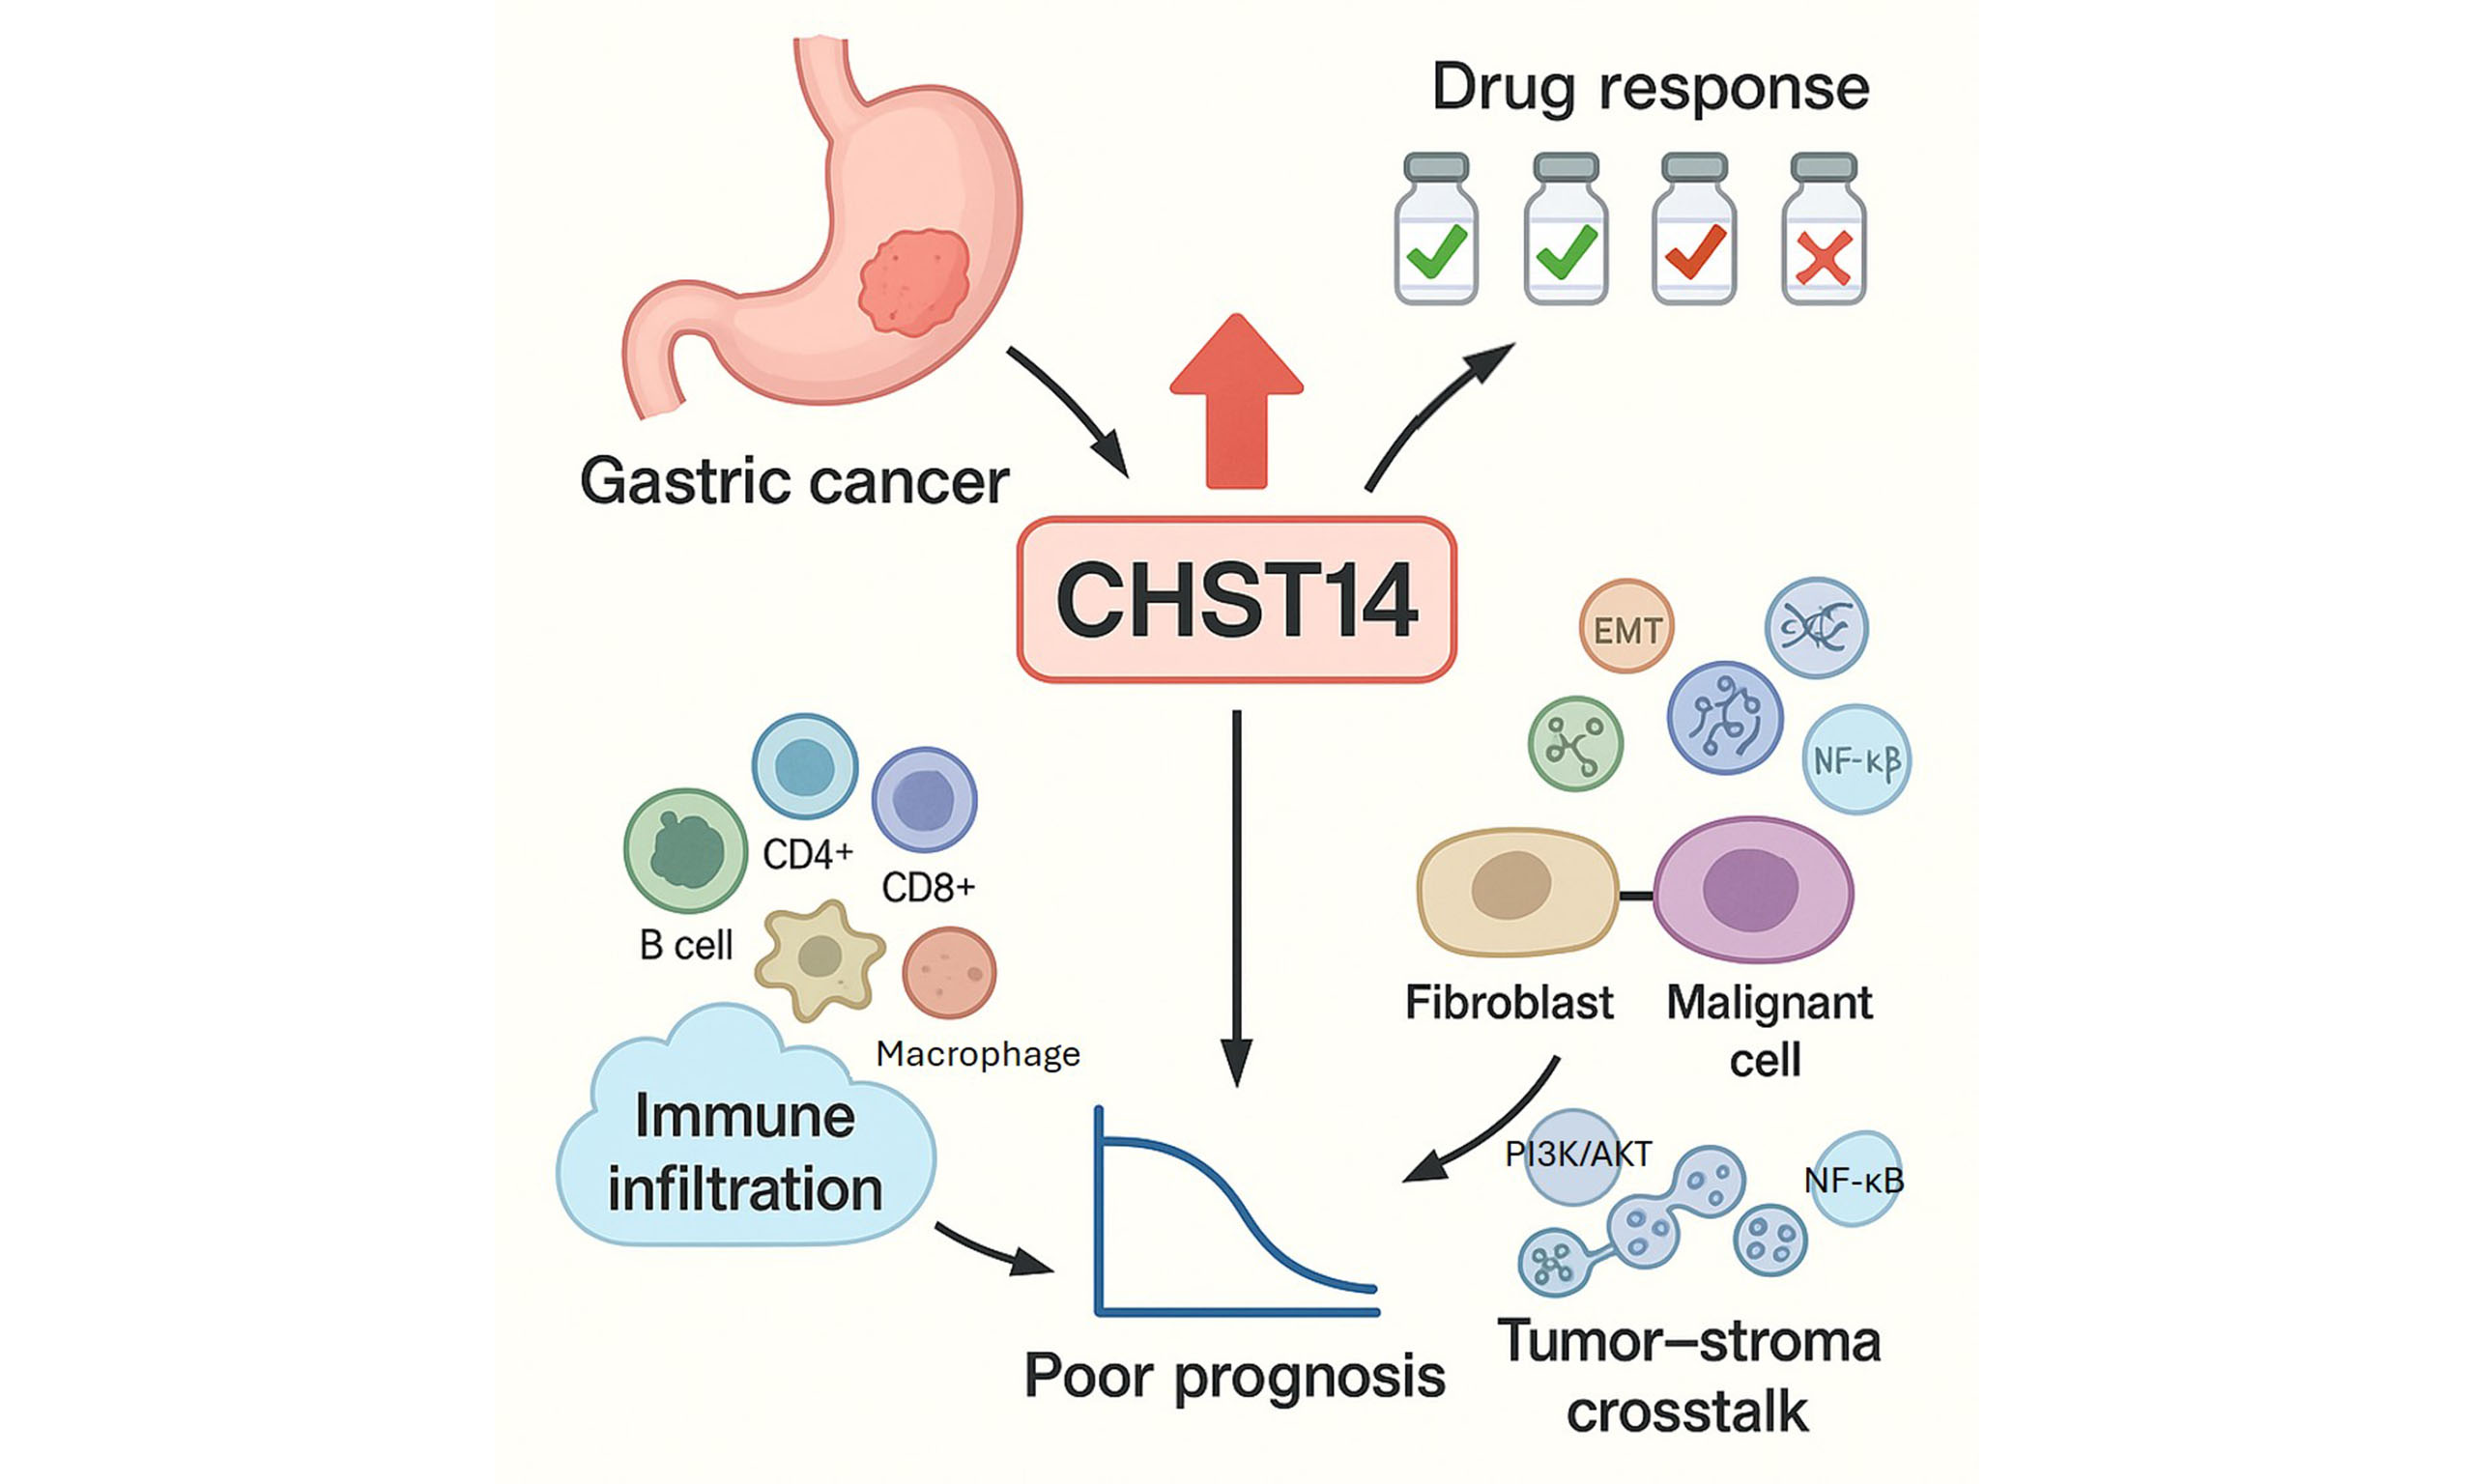
Results: CHST14 was overexpressed in gastric cancer tissues and correlated with poor overall survival and disease-specific survival, but showed no correlation with progression-free survival. Drug sensitivity analysis revealed CHST14’s positive association with chemotherapeutic agents such as SN-38, paclitaxel, and 5-fluorouracil, and negative correlation with others including BEZ235 and doxorubicin. Immune analysis showed CHST14 expression positively associated with infiltration of B cells, CD4+ T cells and CD8+ T cells, macrophages, neutrophils, and dendritic cells. Single-cell RNA sequencing data highlighted CHST14's role in cell-cell interactions, particularly between malignant cells and fibroblasts, and its involvement in tumor-stroma crosstalk. Enrichment analyses linked CHST14 to oncogenic pathways such as epithelial-mesenchymal transition, TNF-α signaling, and MAPK regulation.
Conclusion: CHST14 is a potential diagnostic and prognostic biomarker for gastric cancer, influencing drug metabolism and immune microenvironment interactions. These findings provide insights into CHST14’s mechanistic role in tumor progression and its potential as a therapeutic target. Further studies are required for clinical validation and mechanistic exploration.
Keywords
INTRODUCTION
Gastric cancer (GC) is the fourth leading cause of cancer deaths worldwide, and its incidence rate is particularly high in Asia and South America[1,2]. While its cause is still not fully understood, it has been suggested that dietary habits, bacterial infections, genetic factors, and chemical and pesticide exposure may all play a role in its development. Gastric cancer refers to malignant tumors that develop in the stomach. It usually grows in the inner tissue of the stomach and gradually spreads to other parts. Common symptoms include indigestion, abdominal mass, bloody vomiting, and black stool, though they may be difficult to detect[3].
Treatments vary depending on the type and severity of cancer and may include surgery, radiotherapy, chemotherapy, and targeted therapy[4]. In recent years, targeted therapy, especially immunotherapy, has made great progress in gastric cancer[5]. In addition, maintaining a healthy diet and lifestyle and receiving regular gastroscopy screenings can help reduce the risk of developing it. The search for diagnostic and prognostic markers is of great importance because of the unremarkable and heterogeneous nature of gastric cancer symptoms[6].
CHST14, also known as carbohydrate sulfotransferase 14, is associated with diseases including Ehlers-Danlos Syndrome, Musculocontractural Type 1, and Musculocontractural Ehlers-Danlos Syndrome[7-13]. Ehlers-Danlos syndrome (EDS) is caused by mutations in genes that encode collagen or enzymes involved in collagen modification, and it impacts the skin, joints, blood vessels, and various internal organs. It is currently classified into 13 distinct subtypes[14]. Among them, musculocontractural EDS (MC-EDS) is a rare form that typically presents in the neonatal period, characterized by distinctive craniofacial features and distal arthrogryposis[15]. What is now known as MC-EDS was previously described under three separate names: “adducted thumb-clubfoot syndrome”, “EDS Kosho type”, and a kyphoscoliosis variant not associated with lysyl hydroxylase deficiency. Genetically, MC-EDS is now divided into two types: type 1, caused by pathogenic variants in the CHST14 gene, and type 2, caused by variants in the DSE gene. These genes encode the enzymes D4ST1 and DSE, respectively, which are involved in the biosynthesis of glycosaminoglycans (GAGs) such as chondroitin sulfate (CS) and dermatan sulfate (DS)[16].
CHST14 is a member of the human natural killer (HNK-1) family of sulfotransferases. The HNK-1 carbohydrate plays important roles in nervous system development, regeneration after trauma, and synaptic plasticity. A previous study showed that CHST14 is specific for 4-O sulfation of the GalNAc in CS-B (DS) units after dermatan sulfate epimerase activity and this specificity can also be exhibited by CHST12[17]. It is also involved in the process of proteoglycan biosynthesis and plays an important role in physiological function[18]. CHST14 has also been shown to regulate the proliferation and neurogenesis of neural progenitor cells[19] and impair cognitive function in mice[20]. Recently, a study explored the role of CHST14 in gastric cancer and suggested that its increased expression is associated with poorer prognosis and high energy metabolism[21]. However, further research is needed to verify these results and to elucidate the implications of CHST14 in gastric cancer treatment. Herein, this finding is of utmost significance as it offers further insight into the molecular mechanisms involved in the connection between CHST14 and the immune microenvironment of gastric cancer.
MATERIALS AND METHODS
TCGA analysis
Transcriptomic and clinical data for gastric cancer (STAD cohort) were downloaded from The Cancer Genome Atlas (TCGA) via the UCSC Xena browser (https://xenabrowser.net/) in January 2024. Gene expression profiles (HTSeq-FPKM) and corresponding clinical annotations were used for subsequent analysis. Differentially expressed genes (DEGs) were identified using the “limma” package in R (version 4.2.2). Receiver operating characteristic (ROC) curves, Kaplan-Meier survival curves, and volcano plots were generated using the “pROC”, “survival”, and “EnhancedVolcano” packages, respectively. A prognostic nomogram integrating CHST14 expression and clinical variables was constructed using the “rms” package. All statistical analyses and visualizations were performed using RStudio (version 2022.12.0).
Gene set enrichment analysis
Differentially expressed genes between high (75%-100%) and low (0%-25%) groups were identified using a fold change cut-off of 1.3 and P-value < 0.05. Then, volcano plots and heatmaps were generated to visualize these significant genes, which were further enriched in GO terminologies and KEGG pathways.
Drug sensitivity analysis
Using the R package “pRRophetic”, the Genomics of Drug Sensitivity in Cancer (GDSC) database was accessed to predict the chemotherapeutic response for each sample. The parameters for the prediction process were set to the default values, and the samples' half-maximal inhibitory concentration (IC50) was estimated by ridge regression. The batch effects of combat and tissue type of all tissues were taken into account, and the duplicate gene expression was summarized as the mean value[22].
Immune cell infiltration analysis
Immune cell infiltration levels in the TCGA cohort were assessed using the TIMER algorithms (http://timer.cistrome.org/).
Single-cell data source and preprocessing
The single-cell RNA sequencing dataset used in this study, STAD_GSE134520, was obtained from the TISCH2 database, a curated repository of tumor microenvironment single-cell transcriptomic data. This dataset includes high-resolution annotations of various cell types, clusters, and tumor microenvironment features, enabling comprehensive analyses of gene expression and functional enrichment.
Single-cell quality control and normalization
Prior to downstream analyses, raw single-cell RNA sequencing data underwent rigorous quality control (QC) steps integrated within the TISCH2 platform. Low-quality cells with fewer than 200 detected genes or high mitochondrial gene content (> 10%) were excluded to ensure accurate downstream interpretation. Genes expressed in fewer than 3 cells were excluded to remove lowly expressed, non-informative features. Gene expression values were normalized using a log-transformation to correct for technical variability and differences in sequencing depth between cells. Batch effects were mitigated using algorithms such as Harmony or Seurat's integration pipeline, ensuring consistent results across experimental replicates.
Single-cell clustering and annotation
Cell clustering was performed using the Louvain algorithm based on a shared nearest neighbor (SNN) graph, and the resulting clusters were visualized using Uniform Manifold Approximation and Projection (UMAP). Clusters were annotated based on marker gene expression, with major lineages identified, including fibroblasts, malignant cells, gland mucous cells, and others. Specific clusters of interest, such as Clusters 16 and 18, were identified for detailed analysis based on their high expression of CHST14.
Single-cell gene expression analysis
CHST14 expression levels were analyzed across all annotated cell types and clusters. CHST14 expression was overlaid onto UMAP plots to explore its spatial distribution within the tumor microenvironment.Violin plots were generated to compare CHST14 expression across cell types and specific clusters. These visualizations highlighted elevated CHST14 expression in Clusters 16 (fibroblasts) and 18 (malignant cells), which were prioritized for functional analyses.
Single-cell functional enrichment analysis
To investigate the biological roles of CHST14, the following enrichment analyses were performed: In Gene Ontology Biological Process (GO:BP), upregulated and downregulated biological processes were identified for CHST14-high clusters, providing insights into cellular functions such as protein homeostasis, metabolic reprogramming, and signaling pathways. KEGG pathway analysis was conducted to identify dysregulated pathways, including "ECM-receptor interaction", "PI3K/AKT signaling", and "Focal adhesion", which are critical for tumor progression and cell communication. Hallmark gene sets were analyzed to capture overarching biological themes, such as "Epithelial-Mesenchymal Transition", "Hypoxia", and "IL-6/JAK/STAT3 signaling", associated with CHST14 expression. Enrichment analyses of oncogenic and immunologic gene sets revealed tumor-specific signaling pathways and immune-related processes enriched in CHST14-high clusters.
Cell-cell interaction analysis at single-cell resolution
To explore intercellular communication, cell-cell interaction networks were constructed using interaction scores calculated by CellChat or similar tools integrated into TISCH2. These networks quantified interaction strengths between cell clusters, highlighting interactions involving CHST14-high clusters. Heatmaps and network diagrams were generated to visualize key interactions, particularly between fibroblasts (Cluster 16) and malignant cells (Cluster 18).
Statistical analysis
Enrichment scores and differential expression analyses were performed using integrated statistical pipelines within TISCH2. Pathway and gene set significance were evaluated using adjusted P-values (FDR < 0.05), and visualizations were generated using TISCH2's built-in plotting tools. By incorporating these steps, the study ensured a comprehensive and rigorous analysis of CHST14 expression and its biological implications in the tumor microenvironment. The combination of quality-controlled single-cell data, clustering, and advanced enrichment analyses provided robust insights into the role of CHST14 in tumor biology.
RESULTS
CHST14 is overexpressed in gastric cancer
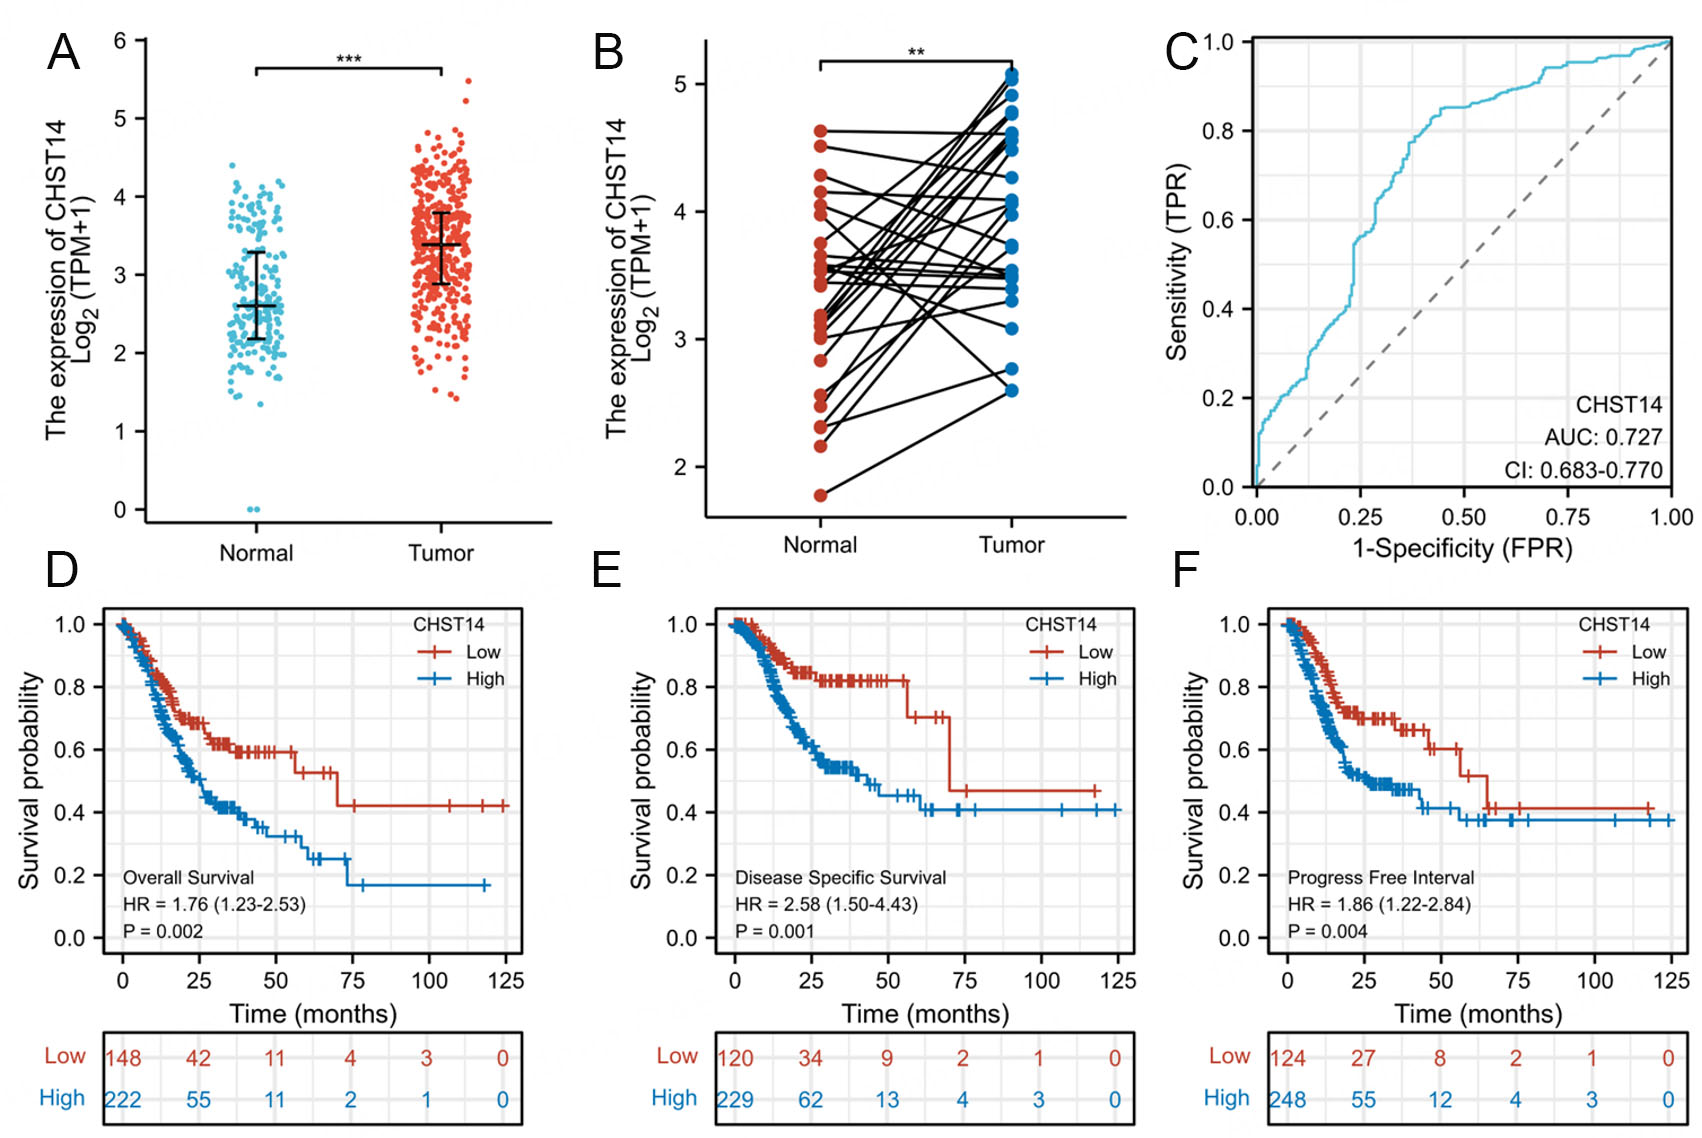
From the TCGA STAD cohort and the GTEx database, overall sample analysis revealed that CHST14 was overexpressed in gastric cancer [Figure 1A]. Additionally, CHST14 was overexpressed in gastric cancer tissues compared to adjacent normal tissues in the TCGA STAD cohort [Figure 1B], where clinical information of gastric cancer patients is listed in Table 1. In addition, we assessed the performance of predicting prognosis by using ROC analysis, and the area under the curve (AUC) of CHST14 expression classification was found to be 0.727, which indicates its potential as a diagnostic biomarker [Figure 1C].
Figure 1. CHST14 as a diagnostic and prognostic biomarker in gastric cancer. Analysis was performed using the TCGA-STAD cohort. (A) CHST14 mRNA expression levels were compared between the TCGA-STAD cohort and the GTEx database. (B) CHST14 mRNA expression levels were compared between gastric cancer tissues and corresponding paired normal tissues from the TCGA-STAD cohort. (C) The diagnostic ROC curve of CHST14 in gastric cancer was generated using data from the TCGA STAD cohort and the GTEx database. Based on the TCGA-STAD cohort, KM plots were constructed for overall survival (D), disease-specific survival (E), and progression-free interval (F) in GC. Differences between the CHST14-high and CHST14-low groups were assessed using log-rank tests, with the cut-off value determined to minimize the P-value. TCGA-STAD: The cancer genome atlas-stomach adenocarcinoma; GTEx: genotype-tissue expression; ROC: receiver operating characteristic; KM: kaplan-meier; GC: gastric cancer. *P < 0.05; **P < 0.01; ***P < 0.001.
The clinic information on gastric cancer patients
| Characteristic | Levels | Overall |
| n | 375 | |
| T stage, n (%) | T1 | 19 (5.2%) |
| T2 | 80 (21.8%) | |
| T3 | 168 (45.8%) | |
| T4 | 100 (27.2%) | |
| N stage, n (%) | N0 | 111 (31.1%) |
| N1 | 97 (27.2%) | |
| N2 | 75 (21%) | |
| N3 | 74 (20.7%) | |
| M stage, n (%) | M0 | 330 (93%) |
| M1 | 25 (7%) | |
| Pathologic stage, n (%) | Stage I | 53 (15.1%) |
| Stage II | 111 (31.5%) | |
| Stage III | 150 (42.6%) | |
| Stage IV | 38 (10.8%) | |
| Primary therapy outcome, n (%) | PD | 65 (20.5%) |
| SD | 17 (5.4%) | |
| PR | 4 (1.3%) | |
| CR | 231 (72.9%) | |
| Gender, n (%) | Female | 134 (35.7%) |
| Male | 241 (64.3%) | |
| Race, n (%) | Asian | 74 (22.9%) |
| Black or African American | 11 (3.4%) | |
| White | 238 (73.7%) | |
| Histological type, n (%) | Diffuse type | 63 (16.8%) |
| Mucinous type | 19 (5.1%) | |
| Not otherwise specified | 207 (55.3%) | |
| Papillary type | 5 (1.3%) | |
| Signet ring type | 11 (2.9%) | |
| Tubular type | 69 (18.4%) | |
| Age, n (%) | < =65 | 4.2%) |
| > 65 | 207 (55.8%) | |
| Residual tumor, n (%) | R0 | 298 (90.6%) |
| R1 | 15 (4.6%) | |
| R2 | 16 (4.9%) | |
| Histologic grade, n (%) | G1 | 10 (2.7%) |
| G2 | 137 (37.4%) | |
| G3 | 219 (59.8%) | |
| Anatomic neoplasm subdivision, n (%) | Antrum/Distal | 138 (38.2%) |
| Cardia/proximal | 48 (13.3%) | |
| Fundus/body | 130 (36%) | |
| Gastroesophageal Junction | 41 (11.4%) | |
| Other | 4 (1.1%) | |
| Reflux history, n (%) | No | 175 (81.8%) |
| Yes | 39 (18.2%) | |
| Antireflux treatment, n (%) | No | 142 (79.3%) |
| Yes | 37 (20.7%) | |
| H pylori infection, n (%) | No | 145 (89%) |
| Yes | 18 (11%) | |
| Barrett’s esophagus, n (%) | No | 193 (92.8%) |
| Yes | 15 (7.2%) | |
| OS event, n (%) | Alive | 228 (60.8%) |
| Dead | 147 (39.2%) | |
| DSS event, n (%) | Alive | 263 (74.3%) |
| Dead | 91 (25.7%) | |
| PFI event, n (%) | Alive | 251 (66.9%) |
| Dead | 124 (33.1%) | |
| Age, median (IQR) | 67 (58, 73) |
Prognostic analysis of CHST14 in gastric cancer
To develop the prognostic value and explore the significance of the CHST14 gene in gastric cancer, data were evaluated using the Kaplan-Meier (KM) plotting and log-rank test. As seen in Figure 1D-F, it was observed that high expression of CHST14 was related to worse overall survival (HR = 1.76, P = 0.002), disease-specific survival (HR = 2.58, P = 0.001), and progress-free interval (HR = 1.86, P = 0.004).
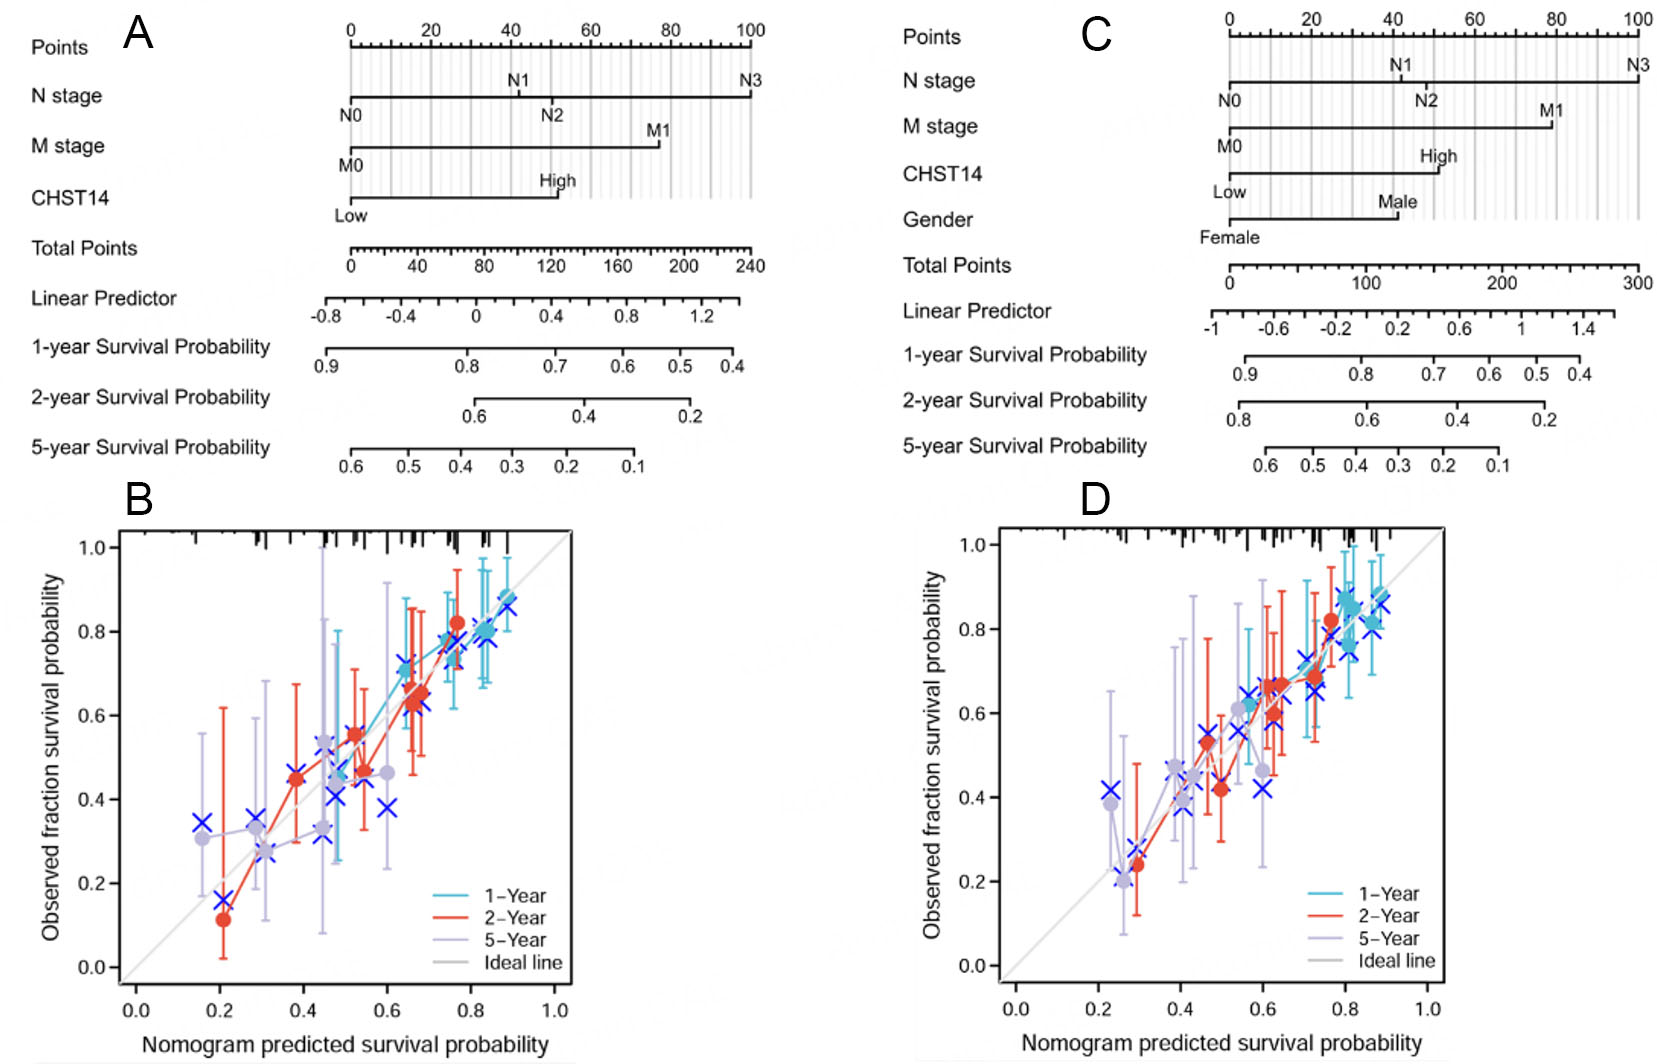
The clinical relevance of the high and low CHST14 in sub-groups of patients was also analyzed [Table 2]. In this cohort of gastric cancer patients, CHST14 expression levels were associated with several clinical and pathological characteristics. Notably, patients in the high CHST14 expression group had a higher proportion of advanced T stage (especially T4) compared to those with low expression, with a statistically significant difference (*P = 0.045). Similarly, a greater number of high-expression patients were diagnosed at a more advanced pathologic stage, particularly Stage III and IV, and fewer were Stage I cases (*P = 0.043). Interestingly, reflux history and Barrett’s esophagus were both more commonly reported in the low CHST14 group, with significant differences (*P = 0.014 and *P = 0.028, respectively). Importantly, survival analysis revealed worse outcomes in the high CHST14 group: these patients had significantly higher mortality rates in overall survival (OS), disease-specific survival (DSS), and progression-free interval (PFI) (*P = 0.007, *P = 0.029, and *P = 0.040, respectively). Other variables such as age, gender, race, histological type, residual tumor, and H. pylori infection did not show significant differences between the groups. Overall, high CHST14 expression appeared to be associated with more aggressive disease features and poorer prognosis. Furthermore, a clinical survival nomogram was constructed for gastric cancer patients, considering TNM stage and CHST14 expression as the risk factors for 1-, 2-, and 5-year overall survival
Figure 2. Prognostic analysis of CHST14 in gastric cancer. Based on TCGA-STAD cohorts, multivariate Cox regression was conducted to construct the nomogram for the prediction of 1-, 2-, and 5-year overall survival (A). The calibration plots of the nomogram for estimation of overall survival at 1, 2, and 5 years (B). Based on TCGA-STAD cohorts, multivariate Cox regression was conducted to construct the nomogram for the prediction of 1-, 2-, and 5-year disease-specific survival (C). The calibration plots of the nomogram for estimation of disease-specific survival at 1, 2, and 5 years (D). TCGA-STAD: The cancer genome atlas-stomach adenocarcinoma.
Gastric cancer patients with different characteristics in the CHST14-high and -low groups
| Characteristic | Levels | Low expression of CHST14 | High expression of CHST14 | P value | |
| n | 187 | 188 | |||
| T stage, n (%) | T1 | 15 (4.1%) | 4 (1.1%) | *0.045 | |
| T2 | 43 (11.7%) | 37 (10.1%) | |||
| T3 | 81 (22.1%) | 87 (23.7%) | |||
| T4 | 45 (12.3%) | 55 (15%) | |||
| N stage, n (%) | N0 | 66 (18.5%) | 45 (12.6%) | 0.072 | |
| N1 | 48 (13.4%) | 49 (13.7%) | |||
| N2 | 33 (9.2%) | 42 (11.8%) | |||
| N3 | 31 (8.7%) | 43 (12%) | |||
| M stage, n (%) | M0 | 166 (46.8%) | 164 (46.2%) | 0.432 | |
| M1 | 10 (2.8%) | 15 (4.2%) | |||
| Pathologic stage, n (%) | Stage I | 36 (10.2%) | 17 (4.8%) | *0.043 | |
| Stage II | 56 (15.9%) | 55 (15.6%) | |||
| Stage III | 69 (19.6%) | 81 (23%) | |||
| Stage IV | 17 (4.8%) | 21 (6%) | |||
| Primary therapy outcome, n (%) | PD | 27 (8.5%) | 38 (12%) | 0.061 | |
| SD | 11 (3.5%) | 6 (1.9%) | |||
| PR | 0 (0%) | 4 (1.3%) | |||
| CR | 117 (36.9%) | 114 (36%) | |||
| Gender, n (%) | Female | 69 (18.4%) | 65 (17.3%) | 0.718 | |
| Male | 118 (31.5%) | 123 (32.8%) | |||
| Race, n (%) | Asian | 42 (13%) | 32 (9.9%) | 0.238 | |
| Black or African American | 6 (1.9%) | 5 (1.5%) | |||
| White | 109 (33.7%) | 129 (39.9%) | |||
| Histological type, n (%) | Diffuse type | 28 (7.5%) | 35 (9.4%) | 0.432 | |
| Mucinous type | 7 (1.9%) | 12 (3.2%) | |||
| Not otherwise specified | 103 (27.5%) | 104 (27.8%) | |||
| Papillary type | 2 (0.5%) | 3 (0.8%) | |||
| Signet ring type | 7 (1.9%) | 4 (1.1%) | |||
| Tubular type | 40 (10.7%) | 29 (7.8%) | |||
| Age, n (%) | < = 65 | 77 (20.8%) | 87 (23.5%) | 0.422 | |
| > 65 | 107 (28.8%) | 100 (27%) | |||
| Residual tumor, n (%) | R0 | 146 (44.4%) | 152 (46.2%) | 0.909 | |
| R1 | 7 (2.1%) | 8 (2.4%) | |||
| R2 | 7 (2.1%) | 9 (2.7%) | |||
| Histologic grade, n (%) | G1 | 4 (1.1%) | 6 (1.6%) | 0.203 | |
| G2 | 77 (21%) | 60 (16.4%) | |||
| G3 | 103 (28.1%) | 116 (31.7%) | |||
| Anatomic neoplasm subdivision, n (%) | Antrum/distal | 75 (20.8%) | 63 (17.5%) | 0.303 | |
| Cardia/proximal | 23 (6.4%) | 25 (6.9%) | |||
| Fundus/body | 55 (15.2%) | 75 (20.8%) | |||
| Gastroesophageal junction | 23 (6.4%) | 18 (5%) | |||
| other | 2 (0.6%) | 2 (0.6%) | |||
| Reflux history, n (%) | No | 85 (39.7%) | 90 (42.1%) | *0.014 | |
| Yes | 28 (13.1%) | 11 (5.1%) | |||
| Antireflux treatment, n (%) | No | 73 (40.8%) | 69 (38.5%) | 1.000 | |
| Yes | 19 (10.6%) | 18 (10.1%) | |||
| H. pylori infection, n (%) | No | 86 (52.8%) | 59 (36.2%) | 0.959 | |
| Yes | 10 (6.1%) | 8 (4.9%) | |||
| Barrett’s esophagus, n (%) | No | 104 (50%) | 89 (42.8%) | *0.028 | |
| Yes | 13 (6.2%) | 2 (1%) | |||
| OS event, n (%) | Alive | 127 (33.9%) | 101 (26.9%) | *0.007 | |
| Dead | 60 (16%) | 87 (23.2%) | |||
| DSS event, n (%) | Alive | 138 (39%) | 125 (35.3%) | *0.029 | |
| Dead | 35 (9.9%) | 56 (15.8%) | |||
| PFI event, n (%) | Alive | 135 (36%) | 116 (30.9%) | *0.040 | |
| Dead | 52 (13.9%) | 72 (19.2%) | |||
| Age, median (IQR) | 68 (58, 74) | 67 (58, 73) | 0.288 | ||
Univariate and multivariate Cox regression analysis of overall survival in GC
| Characteristics | Total (N) | Univariate analysis | Multivariate analysis | ||
| Hazard ratio (95%CI) | P value | Hazard ratio (95%CI) | P value | ||
| T stage | 362 | ||||
| T1 | 18 | Reference | |||
| T2 | 78 | 6.725 (0.913-49.524) | 0.061 | 5.066 (0.680-37.759) | 0.113 |
| T3 | 167 | 9.548 (1.326-68.748) | *0.025 | 6.407 (0.875-46.890) | 0.067 |
| T4 | 99 | 9.634 (1.323-70.151) | *0.025 | 5.791 (0.776-43.209) | 0.087 |
| N stage | 352 | ||||
| N0 | 107 | Reference | |||
| N1 | 97 | 1.629 (1.001-2.649) | *0.049 | 1.248 (0.742-2.098) | 0.404 |
| N2 | 74 | 1.655 (0.979-2.797) | 0.060 | 1.369 (0.793-2.364) | 0.260 |
| N3 | 74 | 2.709 (1.669-4.396) | < 0.001 | 2.081 (1.238-3.496) | *0.006 |
| M stage | 352 | ||||
| M0 | 327 | Reference | |||
| M1 | 25 | 2.254 (1.295-3.924) | *0.004 | 1.938 (1.085-3.461) | *0.025 |
| Gender | 370 | ||||
| Female | 133 | Reference | |||
| Male | 237 | 1.267 (0.891-1.804) | 0.188 | ||
| H. pylori infection | 162 | ||||
| Yes | 18 | Reference | |||
| No | 144 | 1.539 (0.661-3.585) | 0.317 | ||
| CHST14 | 370 | ||||
| Low | 183 | Reference | |||
| High | 187 | 1.618 (1.156-2.264) | *0.005 | 1.532 (1.075-2.185) | *0.018 |
Univariate and multivariate Cox regression analysis of disease-specific survival in GC
| Characteristics | Total (N) | Univariate analysis | Multivariate analysis | ||
| Hazard ratio (95%CI) | P value | Hazard ratio (95%CI) | P value | ||
| T stage | 345 | ||||
| T1 | 17 | Reference | |||
| T2 | 73 | 18368422.833 (0.000-Inf) | 0.994 | ||
| T3 | 158 | 31445474.870 (0.000-Inf) | 0.994 | ||
| T4 | 97 | 28733964.565 (0.000-Inf) | 0.994 | ||
| N stage | 334 | ||||
| N0 | 104 | Reference | |||
| N1 | 88 | 1.169 (0.613-2.229) | 0.635 | 1.024 (0.528-1.984) | 0.944 |
| N2 | 72 | 1.893 (1.015-3.531) | *0.045 | 1.669 (0.882-3.159) | 0.116 |
| N3 | 70 | 2.714 (1.500-4.909) | < 0.001 | 2.329 (1.256-4.317) | *0.007 |
| M stage | 333 | ||||
| M0 | 311 | Reference | |||
| M1 | 22 | 2.438 (1.221-4.870) | *0.012 | 2.209 (1.092-4.472) | *0.028 |
| Gender | 349 | ||||
| Female | 125 | Reference | |||
| Male | 224 | 1.573 (0.985-2.514) | 0.058 | 1.678 (1.031-2.732) | *0.037 |
| H. pylori infection | 157 | ||||
| Yes | 18 | Reference | |||
| No | 139 | 1.792 (0.644-4.992) | 0.264 | ||
| CHST14 | 349 | ||||
| Low | 169 | Reference | |||
| High | 180 | 1.869 (1.211-2.885) | *0.005 | 1.750 (1.112-2.755) | *0.016 |
Univariate and multivariate Cox regression analysis of progression-free survival in GC
| Characteristics | Total (N) | Univariate analysis | Multivariate analysis | ||
| Hazard ratio (95%CI) | P value | Hazard ratio (95%CI) | P value | ||
| T stage | 364 | ||||
| T1 | 19 | Reference | |||
| T2 | 78 | 3.323 (0.783-14.101) | 0.103 | 2.897 (0.357-23.482) | 0.319 |
| T3 | 168 | 5.157 (1.263-21.049) | *0.022 | 3.007 (0.378-23.916) | 0.298 |
| T4 | 99 | 4.055 (0.968-16.992) | 0.055 | 3.345 (0.408-27.388) | 0.260 |
| N stage | 354 | ||||
| N0 | 108 | Reference | |||
| N1 | 97 | 1.150 (0.684-1.934) | 0.597 | 1.136 (0.460-2.802) | 0.782 |
| N2 | 75 | 1.635 (0.968-2.761) | 0.066 | 1.525 (0.628-3.703) | 0.351 |
| N3 | 74 | 2.480 (1.516-4.056) | < 0.001 | 2.645 (1.117-6.265) | *0.027 |
| M stage | 353 | ||||
| M0 | 328 | Reference | |||
| M1 | 25 | 2.224 (1.194-4.144) | *0.012 | 1.902 (0.758-4.771) | 0.171 |
| Gender | 372 | ||||
| Female | 133 | Reference | |||
| Male | 239 | 1.638 (1.099-2.440) | *0.015 | 2.607 (1.366-4.975) | *0.004 |
| H. pylori infection | 163 | ||||
| Yes | 18 | Reference | |||
| No | 145 | 3.118 (0.977-9.957) | 0.055 | 2.820 (0.860-9.243) | 0.087 |
| CHST14 | 372 | ||||
| Low | 185 | Reference | |||
| High | 187 | 1.537 (1.073-2.201) | *0.019 | 1.191 (0.685-2.071) | 0.536 |
CHST14-related genes of GO and KEGG analysis
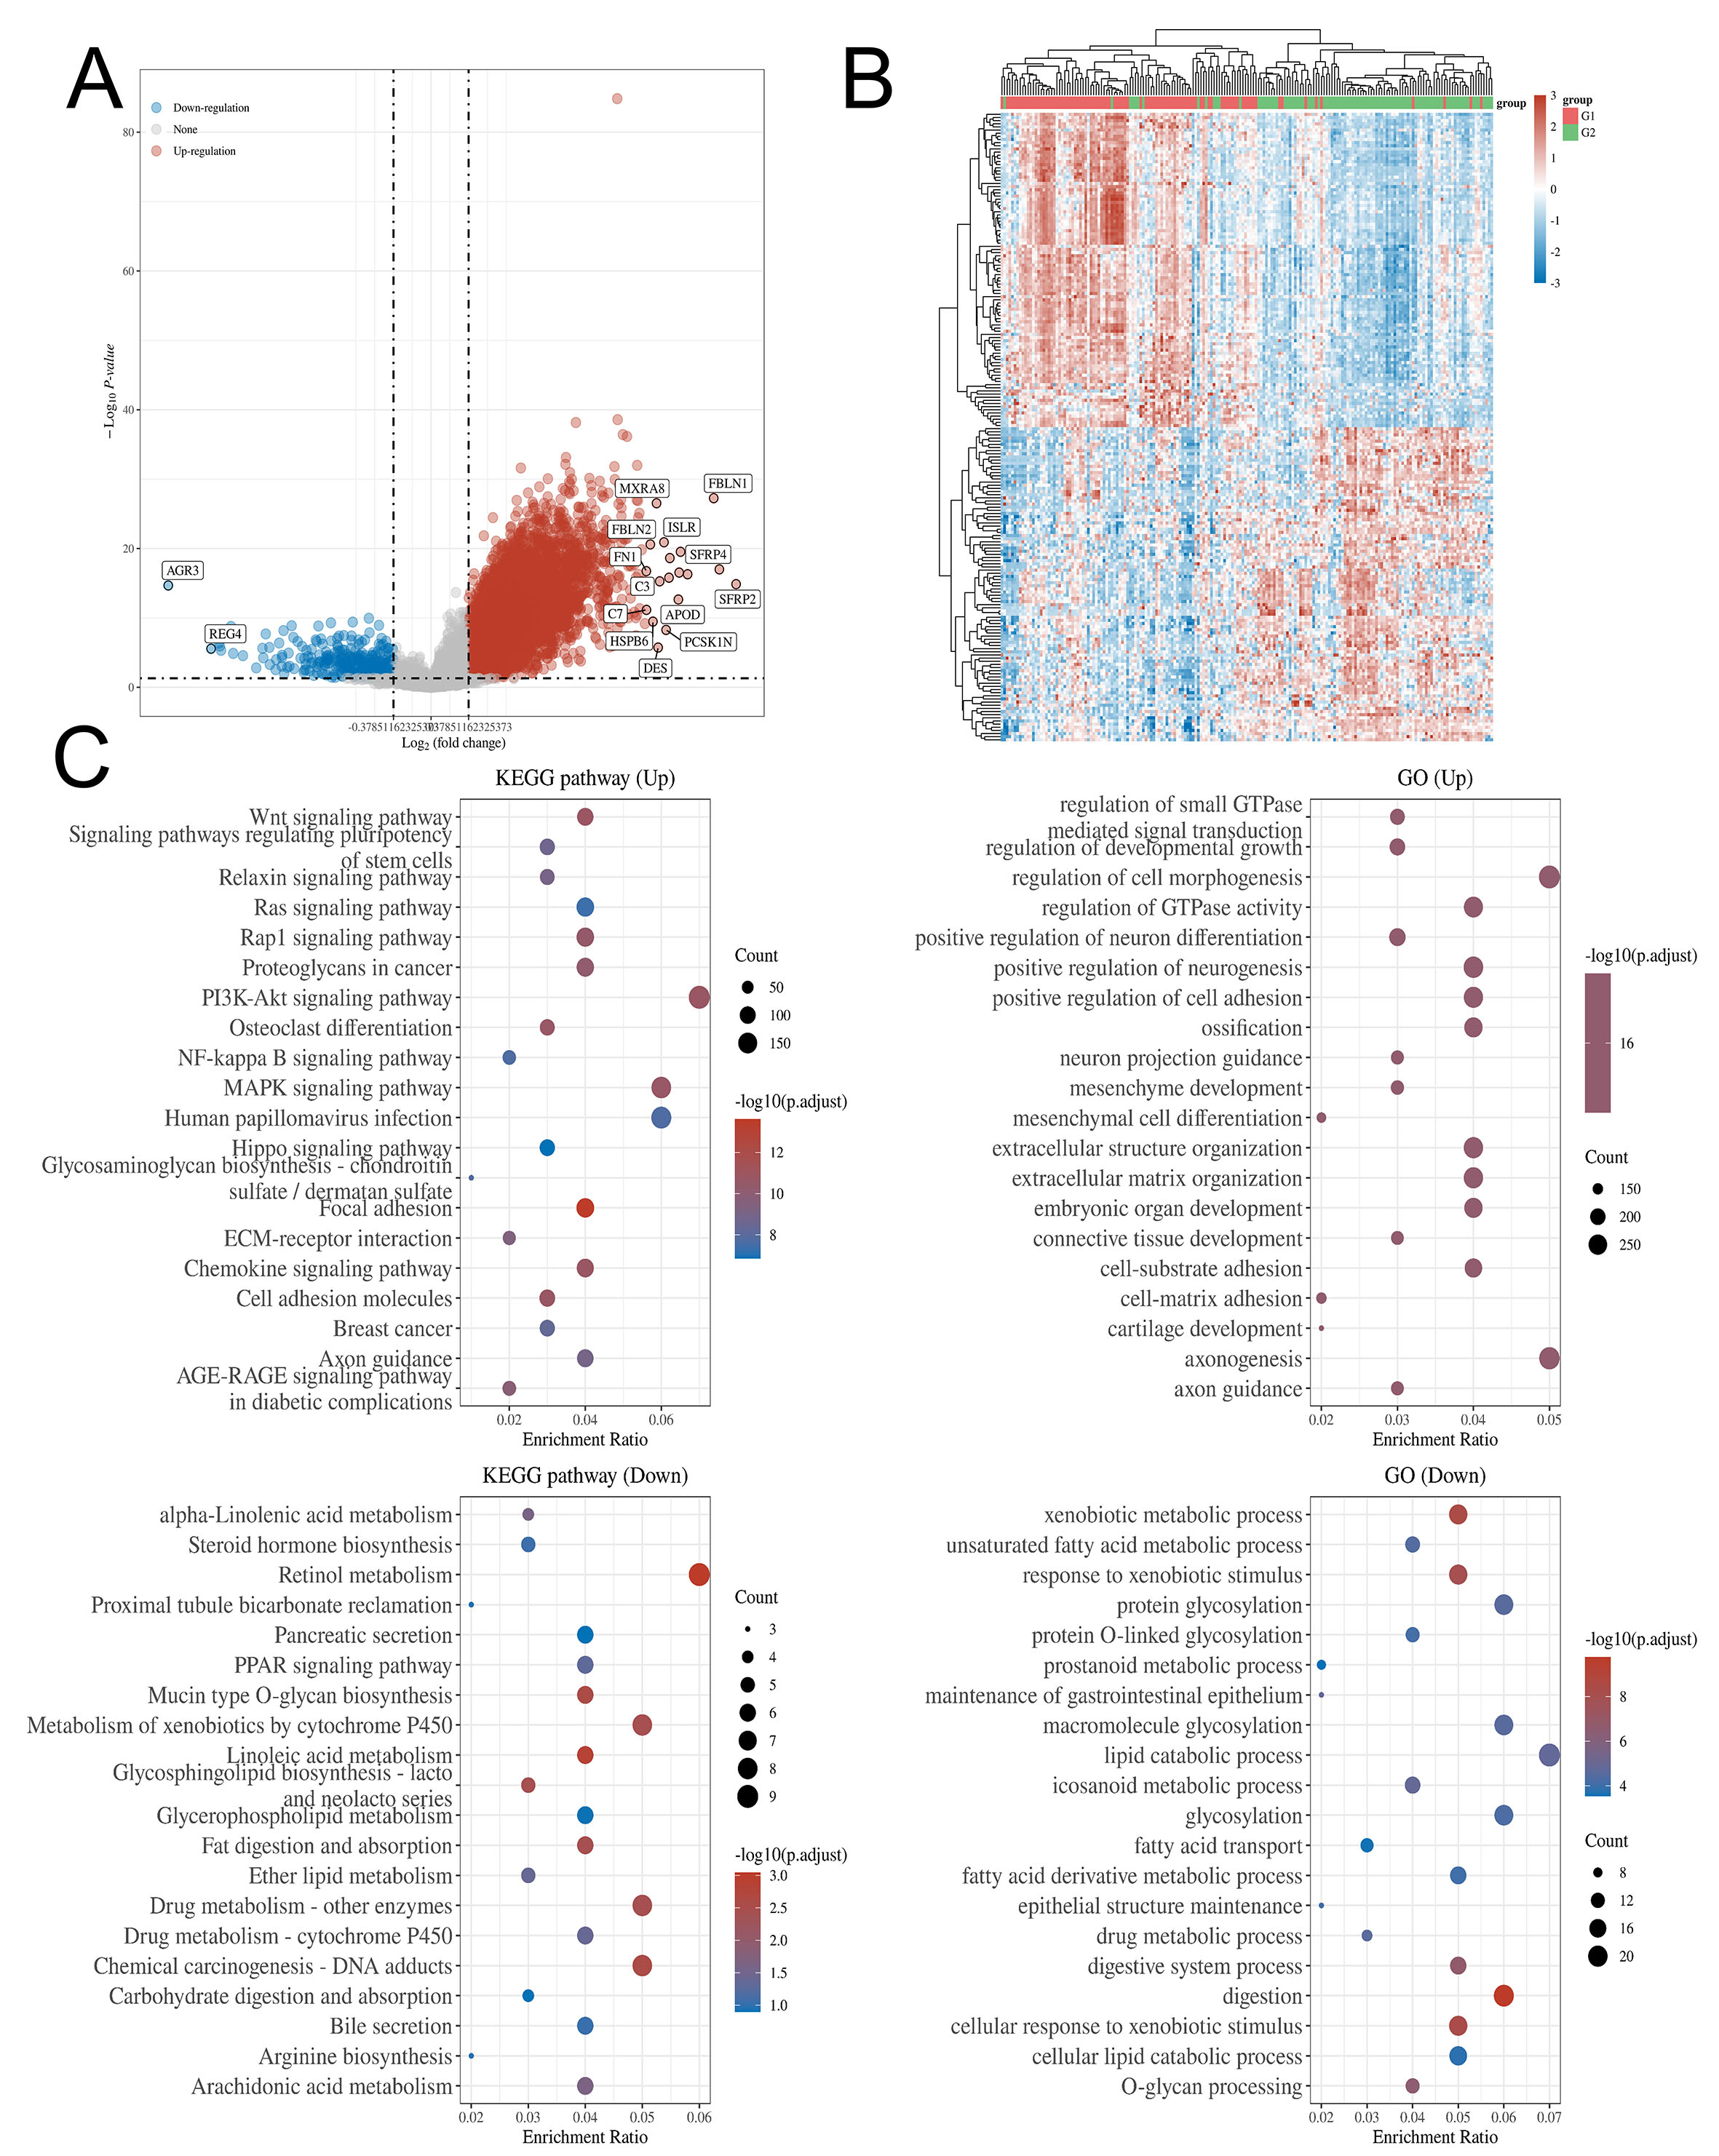
To further determine the role of CHST14 in gastric cancer, CHST14-related genes were analyzed using GO and KEGG analyses. Differentially expressed genes (DEGs) were identified by comparing CHST14 expression between the high-expression group (75%-100%) and the low-expression group (0%-25%). KEGG pathway analysis revealed that positively regulated genes were associated with the PI3K-Akt, MAPK, Wnt, Ras, Rap1, and chemokine signaling pathways, among others. GO analysis showed that CHST14-upregulated genes were linked to morphogenesis regulation, axonogenesis, and regulation of GTPase activity. In contrast, negatively regulated genes were linked to retinol metabolism, drug metabolism, and lipid catabolism. These findings suggest that CHST14 may be involved in the regulation of drug metabolism [Figure 3].
Figure 3. GO and KEGG enrichment analysis of CHST14-related genes in gastric cancer. Based on the TCGA-STAD cohort, samples were divided into CHST14-high (75%-100%) and CHST14-low (0%-25%) groups, using a fold-change cut-off of > 1.3 and a P-value < 0.05. (A) Volcano plots of CHST14-related genes. Red dots indicate upregulated CHST14-related genes, while blue dots indicate downregulated CHST14-related genes. (B) Heatmap and hierarchical clustering analysis of CHST14-related genes. (C) GO and KEGG enrichment pathways of CHST14-related genes. GO: Gene ontology; KEGG: kyoto encyclopedia of genes and genomes; TCGA-STAD: the cancer genome atlas-stomach adenocarcinoma.
The relationship between CHST14 and drug sensitivity
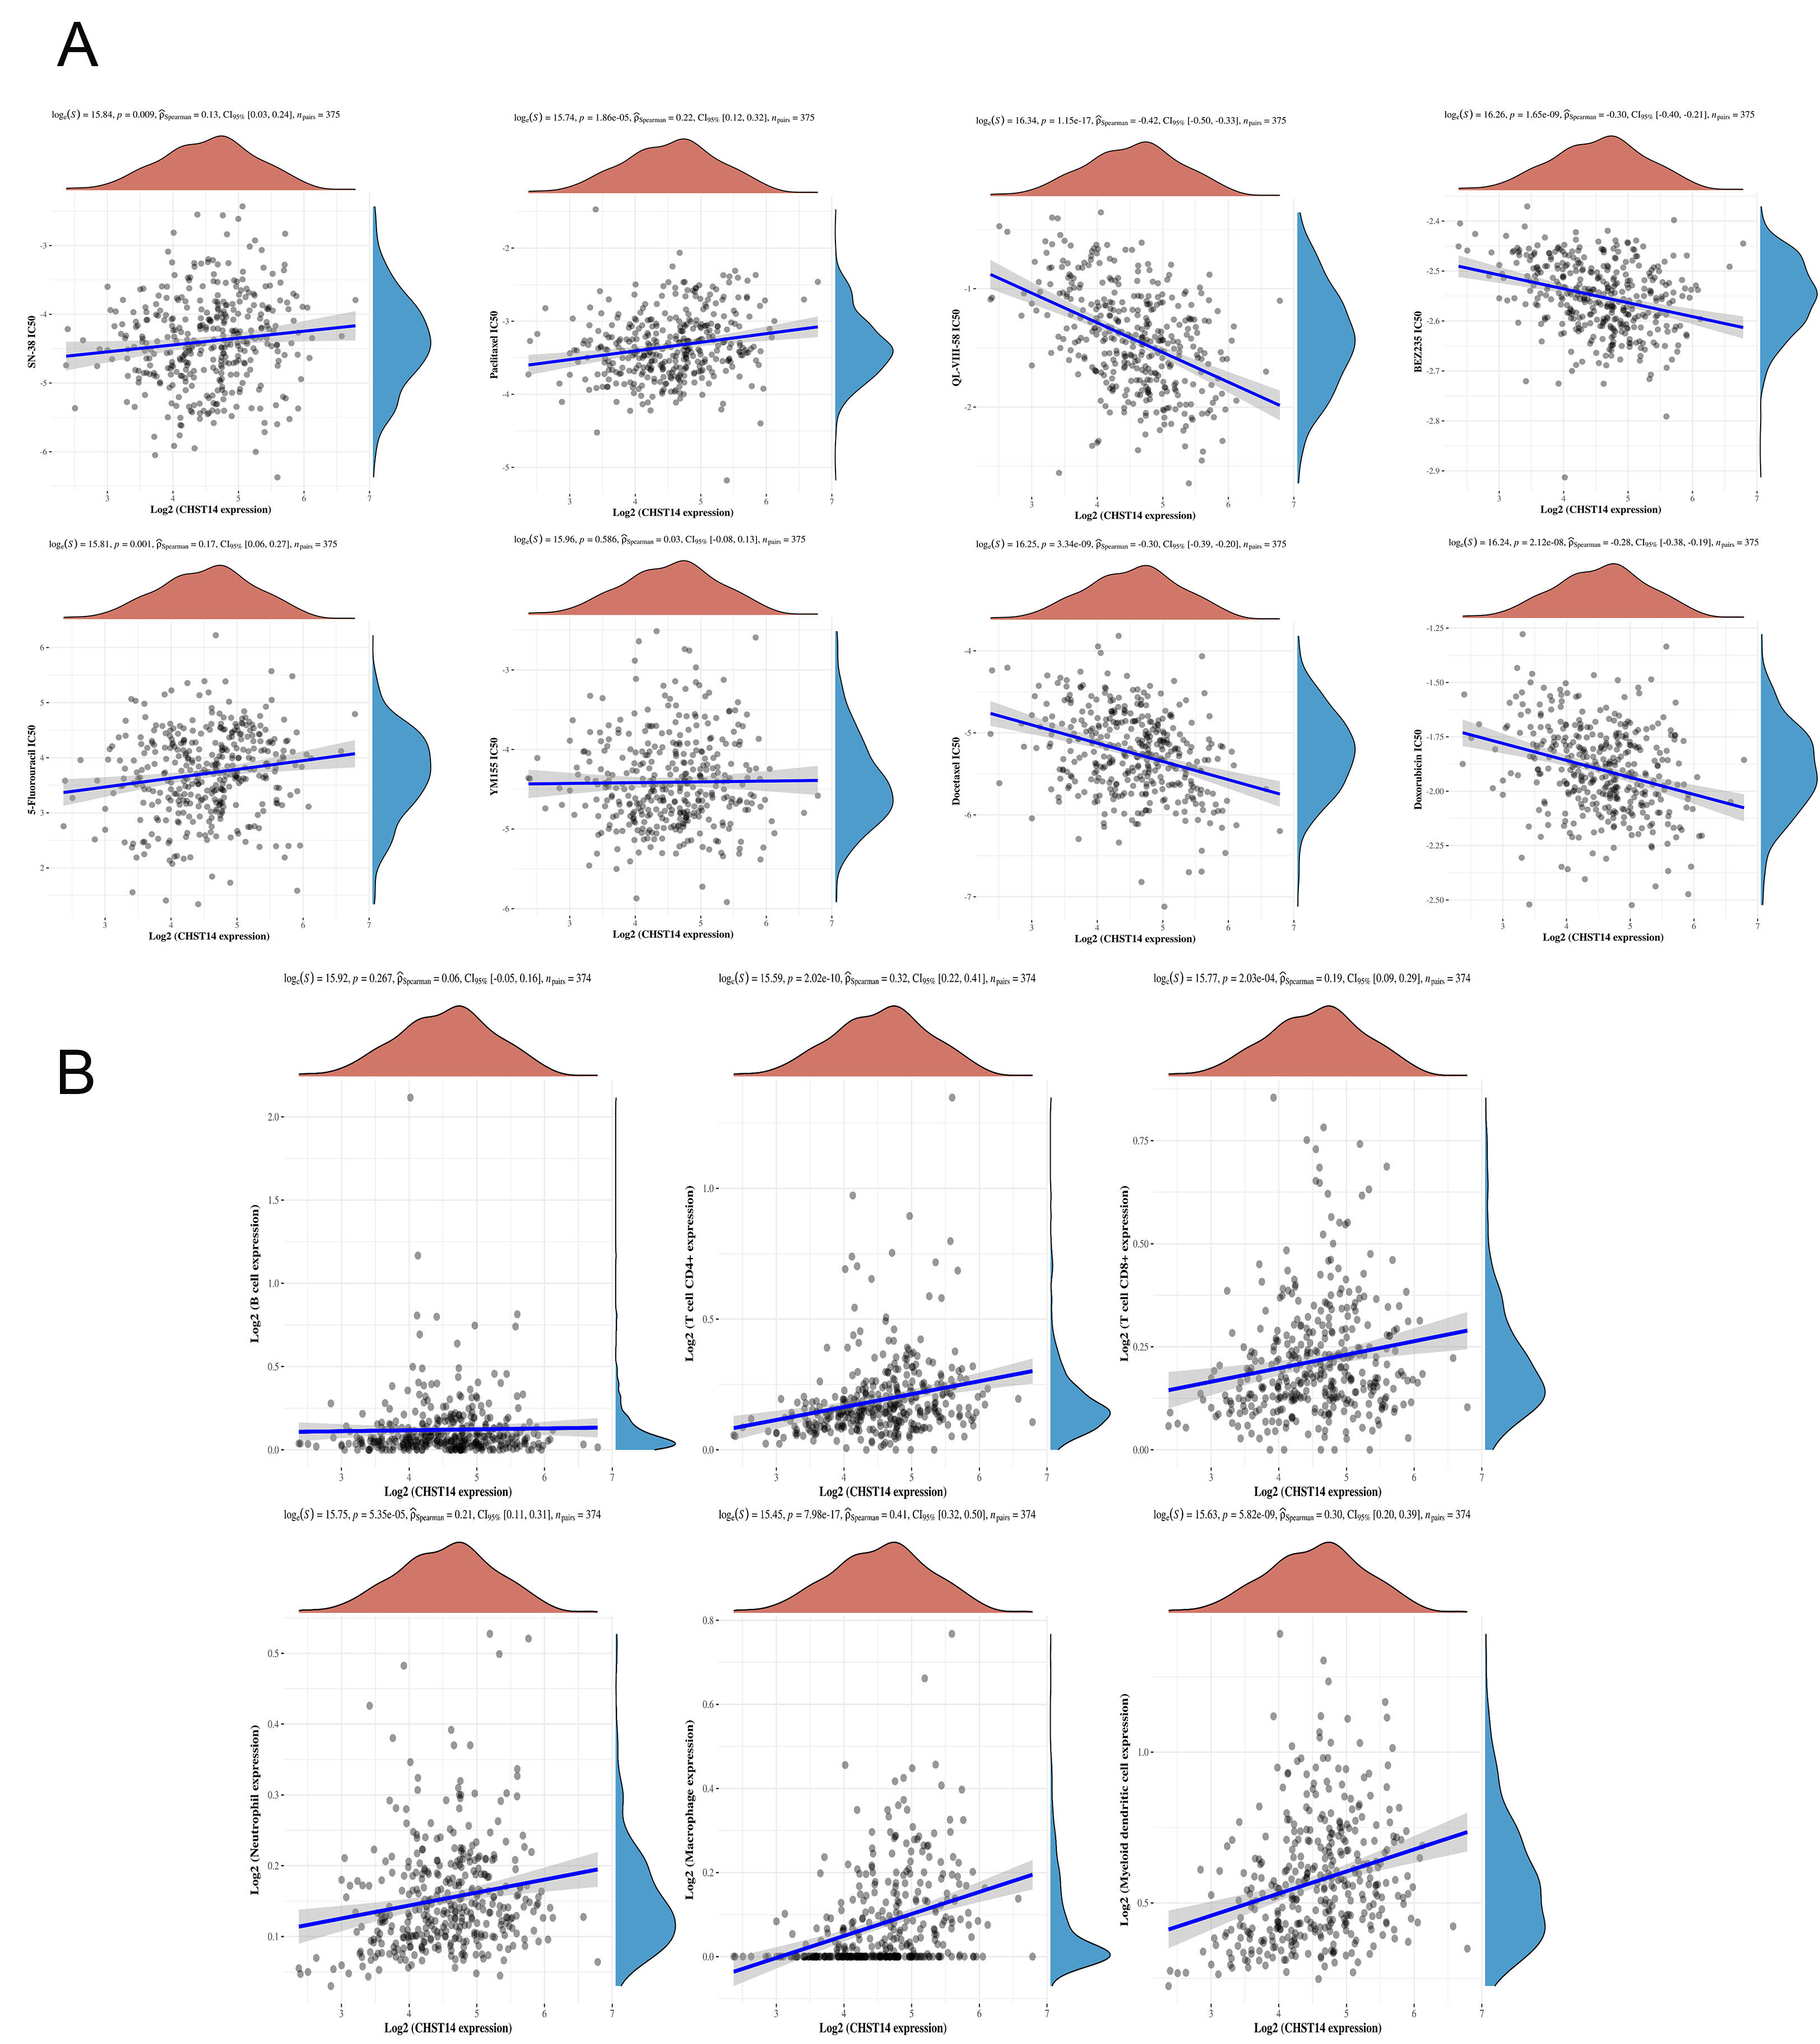
To assess the potential functional impact of CHST14 on drug response, we performed a Spearman correlation analysis between CHST14 expression levels and sensitivity to various anticancer compounds using predictive pharmacogenomic datasets. As shown in Figure 4A, CHST14 expression demonstrated a moderate positive correlation with the predicted response to SN-38 (ρ = 0.13), paclitaxel (ρ = 0.22), and 5-fluorouracil (ρ = 0.17), suggesting that higher CHST14 levels may be associated with increased sensitivity to these agents. In contrast, negative correlations were observed with QL-VIII-58 (ρ = -0.42), BEZ235
Figure 4. CHST14 is related to drug sensitivity and immune cell infiltration. (A) Relationship between CHST14 and drug sensitivity. Using the R package “pRRophetic”, the Genomics of Drug Sensitivity in Cancer (GDSC) database was accessed to predict the chemotherapeutic response for each sample. Default parameters were used for the prediction, and the half-maximal inhibitory concentration (IC50) of each sample was estimated via ridge regression. The association between CHST14 expression and the drugs SN-38, paclitaxel, 5-fluorouracil, YM155, QL-VIII-58, BEZ235, Docetaxel, and Doxorubicin was analyzed. (B) CHST14 and immune cell infiltration. The TIMER algorithm was used to estimate levels of immune cell infiltration. Correlations between CHST14 expression and B cells, CD4+ T cells, CD8+ T cells, neutrophils, macrophages, and myeloid dendritic cells were analyzed. GDSC: Genomics of drug sensitivity in cancer; IC50: half-maximal inhibitory concentration.
CHST14 is regulated by immune cell infiltration
Tumor microenvironment (TME) characteristics are intrinsically linked to the efficacy of cancer immunotherapy, and TME characteristics can significantly influence cancer progression and metastasis. In addition, to determine the possible link between CHST14 gene expression and immune cell infiltration, the correlation between the expression and immune cell infiltration was analyzed using the TIMER algorithm. Spearman correlation analysis was carried out to investigate the role of CHST14 in immune response therapy. Results showed a positive correlation between CHST14 expression and B cells, CD4+ T cells, CD8+ T cells, neutrophils, macrophages, and myeloid dendritic cells, implying that CHST14 may be involved in the filtration of immune cells and influence the gastric cancer microenvironment [Figure 4B].
Expression of CHST14 and cell-cell interaction
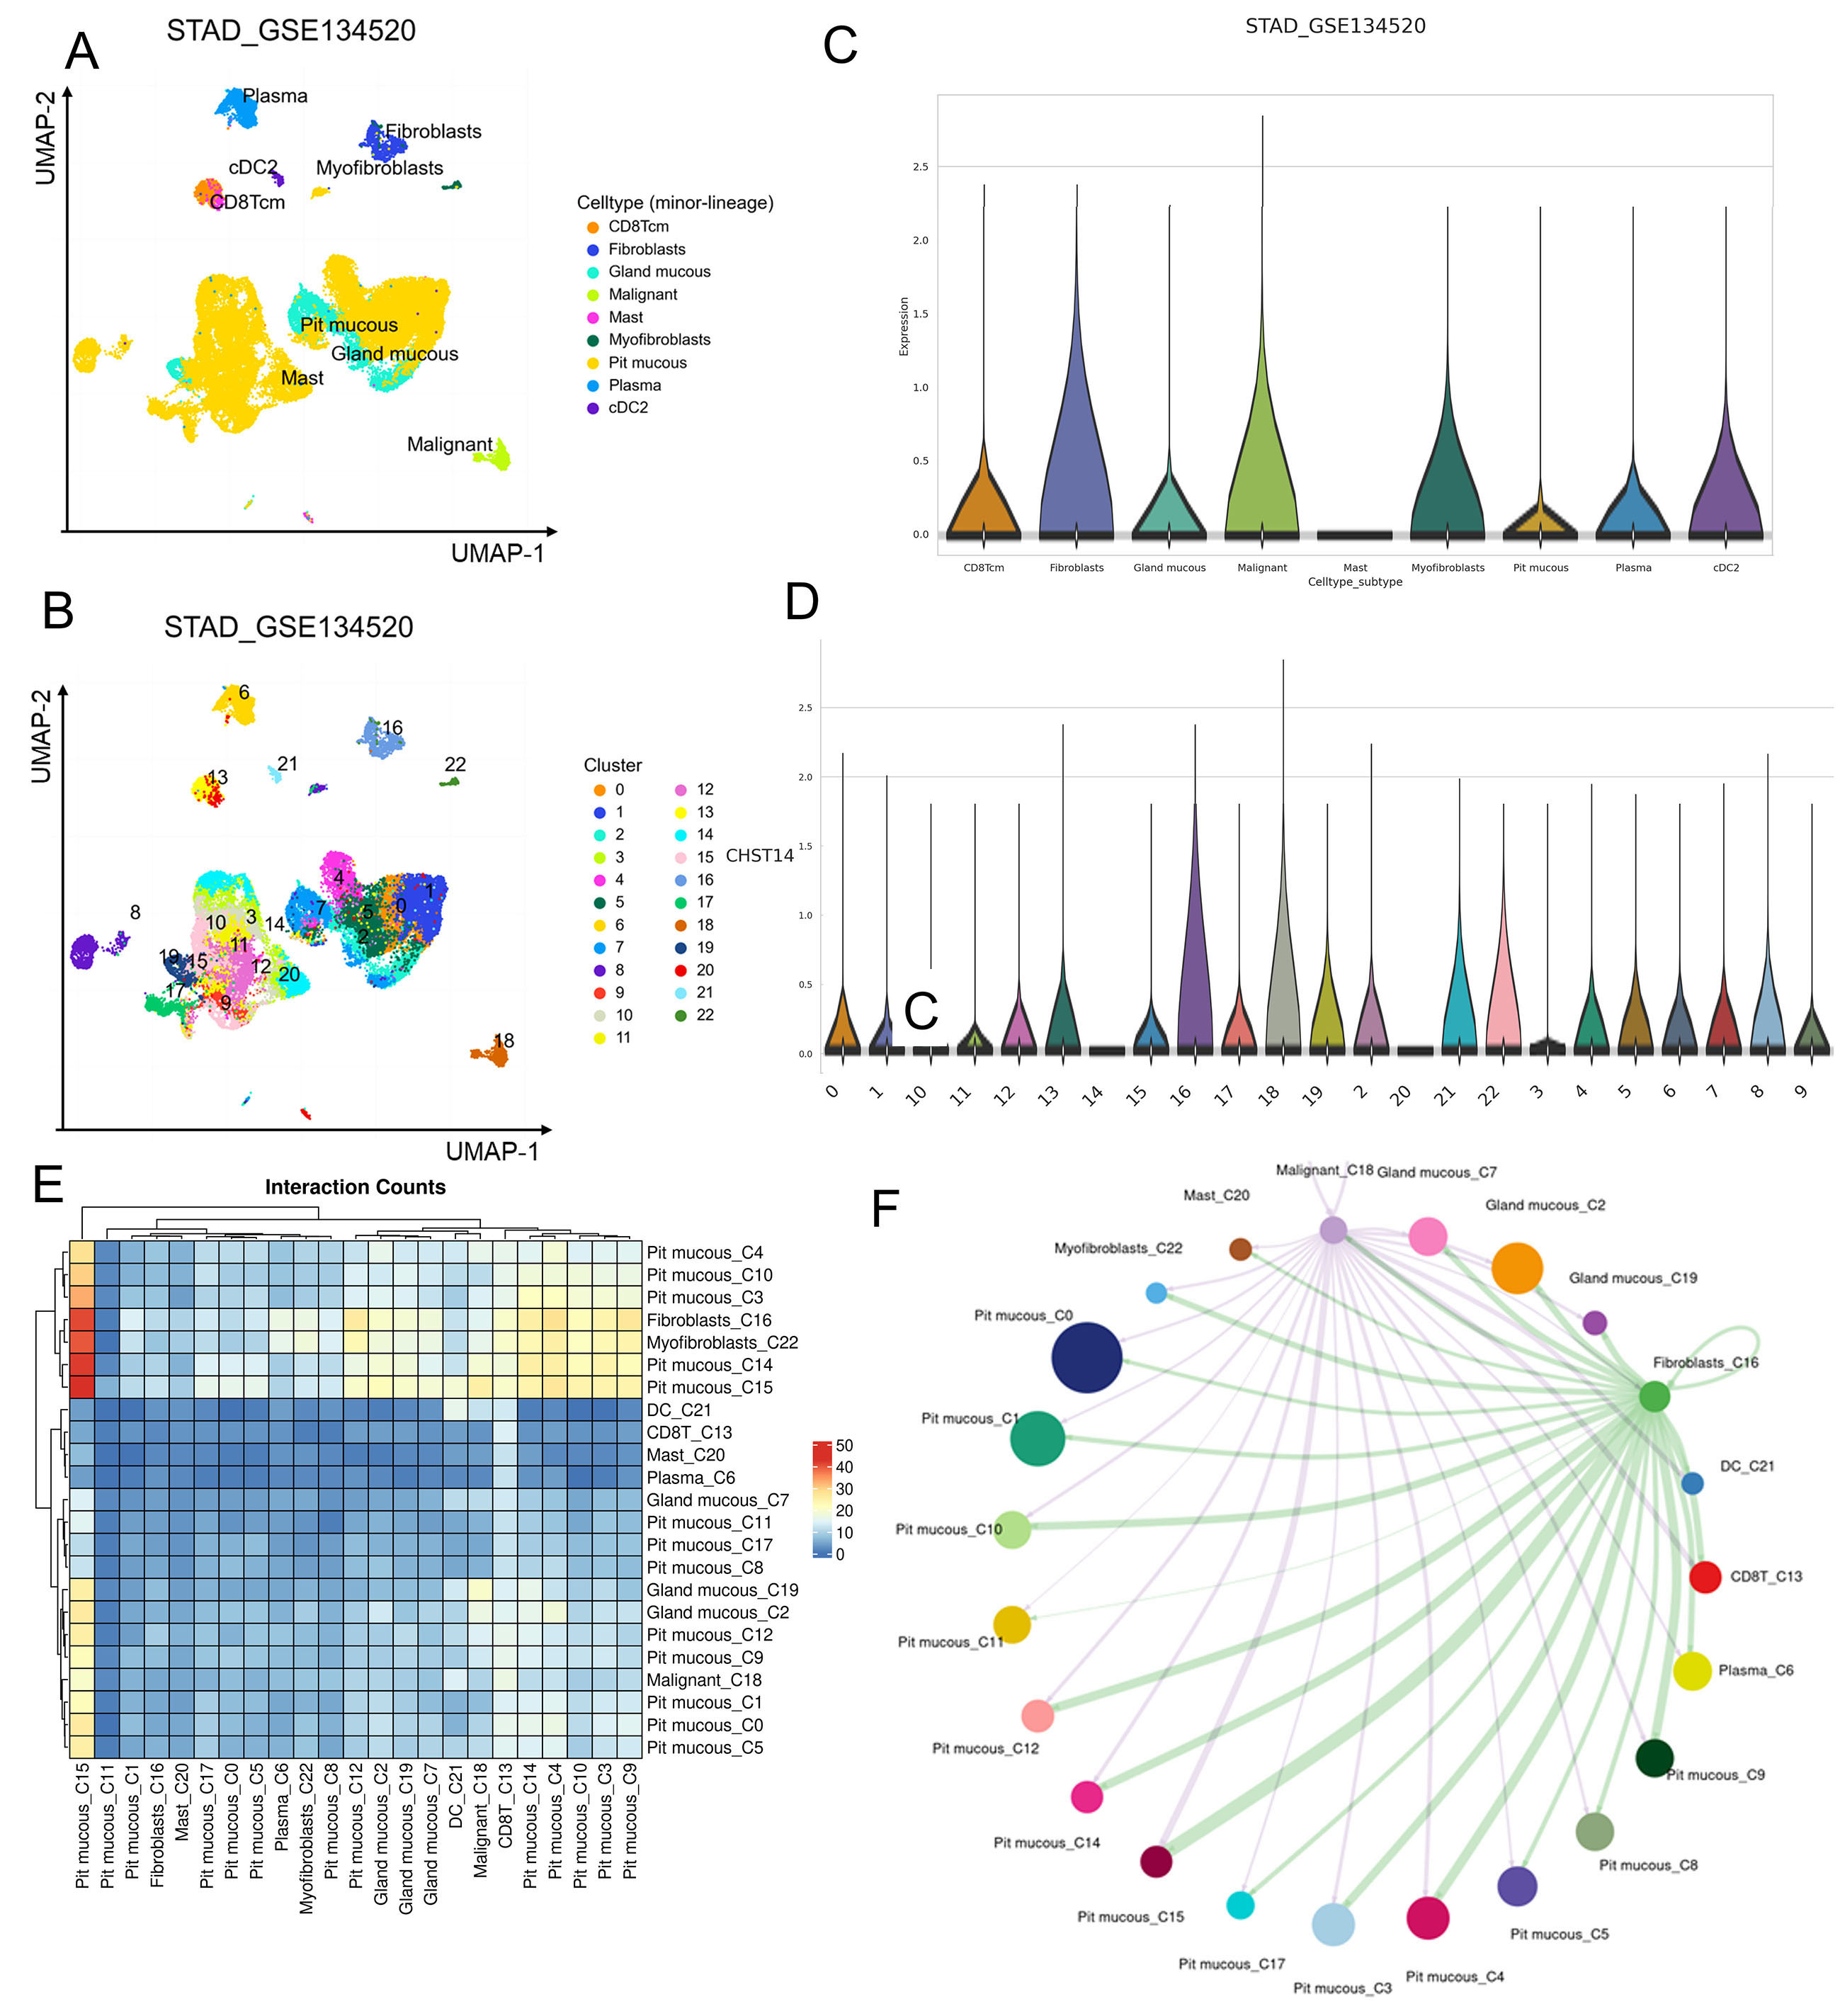
In this study, we analyzed the single-cell RNA sequencing data of STAD_GSE134520 to investigate the expression pattern of CHST14 and its potential role in cell-cell communication. The UMAP visualization revealed distinct cell populations, with CHST14 expression showing significant variation among the clusters [Figure 5A and B]. CHST14 was predominantly expressed in clusters 16 and 18, which were identified as key clusters of interest for further analysis [Figure 5B].
Figure 5. Expression of CHST14 and cell-cell interaction in STAD_GSE134520. (A) UMAP plot of cell clusters colored by cell type, showing the distribution of CHST14 expression across minor lineages. (C) Violin plot of CHST14 expression across cell subtypes, highlighting elevated expression in malignant cells and gland mucous cells. (B) UMAP plot of cell clusters colored by cluster IDs, identifying CHST14-high clusters (16 and 18). (D) Violin plot of CHST14 expression across clusters, indicating significantly higher expression in Clusters 16 and 18. (E) Heatmap of interaction counts between cell clusters, with higher interaction frequency observed in CHST14-expressing clusters. (F) Network diagram illustrating cell-cell communication, highlighting key interactions involving Clusters 16 and 18. UMAP: Uniform manifold approximation and projection.
Violin plots demonstrated that CHST14 expression was markedly higher in malignant cells (Cluster 18) and gland mucous cells (Cluster 16), compared to other cell types such as fibroblasts, plasma cells, and myofibroblasts [Figure 5C and D]. These findings highlight the potential functional importance of CHST14 in malignant and glandular mucous cell biology.
To explore intercellular communication, we performed a cell-cell interaction analysis using interaction counts. The heatmap [Figure 5E] revealed robust interactions between clusters expressing CHST14, particularly between Cluster 16 (fibroblast) and Cluster 18 (malignant cells). Network visualization further illustrated the complex communication network, with prominent interactions between pit mucous cells and CHST14-expressing clusters [Figure 5F].
These results suggest that CHST14 may play a critical role in the tumor microenvironment by mediating interactions between malignant and fibroblast cells. Further experimental validation is required to elucidate the mechanistic role of CHST14 in cell communication and tumor progression.
Transcriptional regulatory analysis in single cells
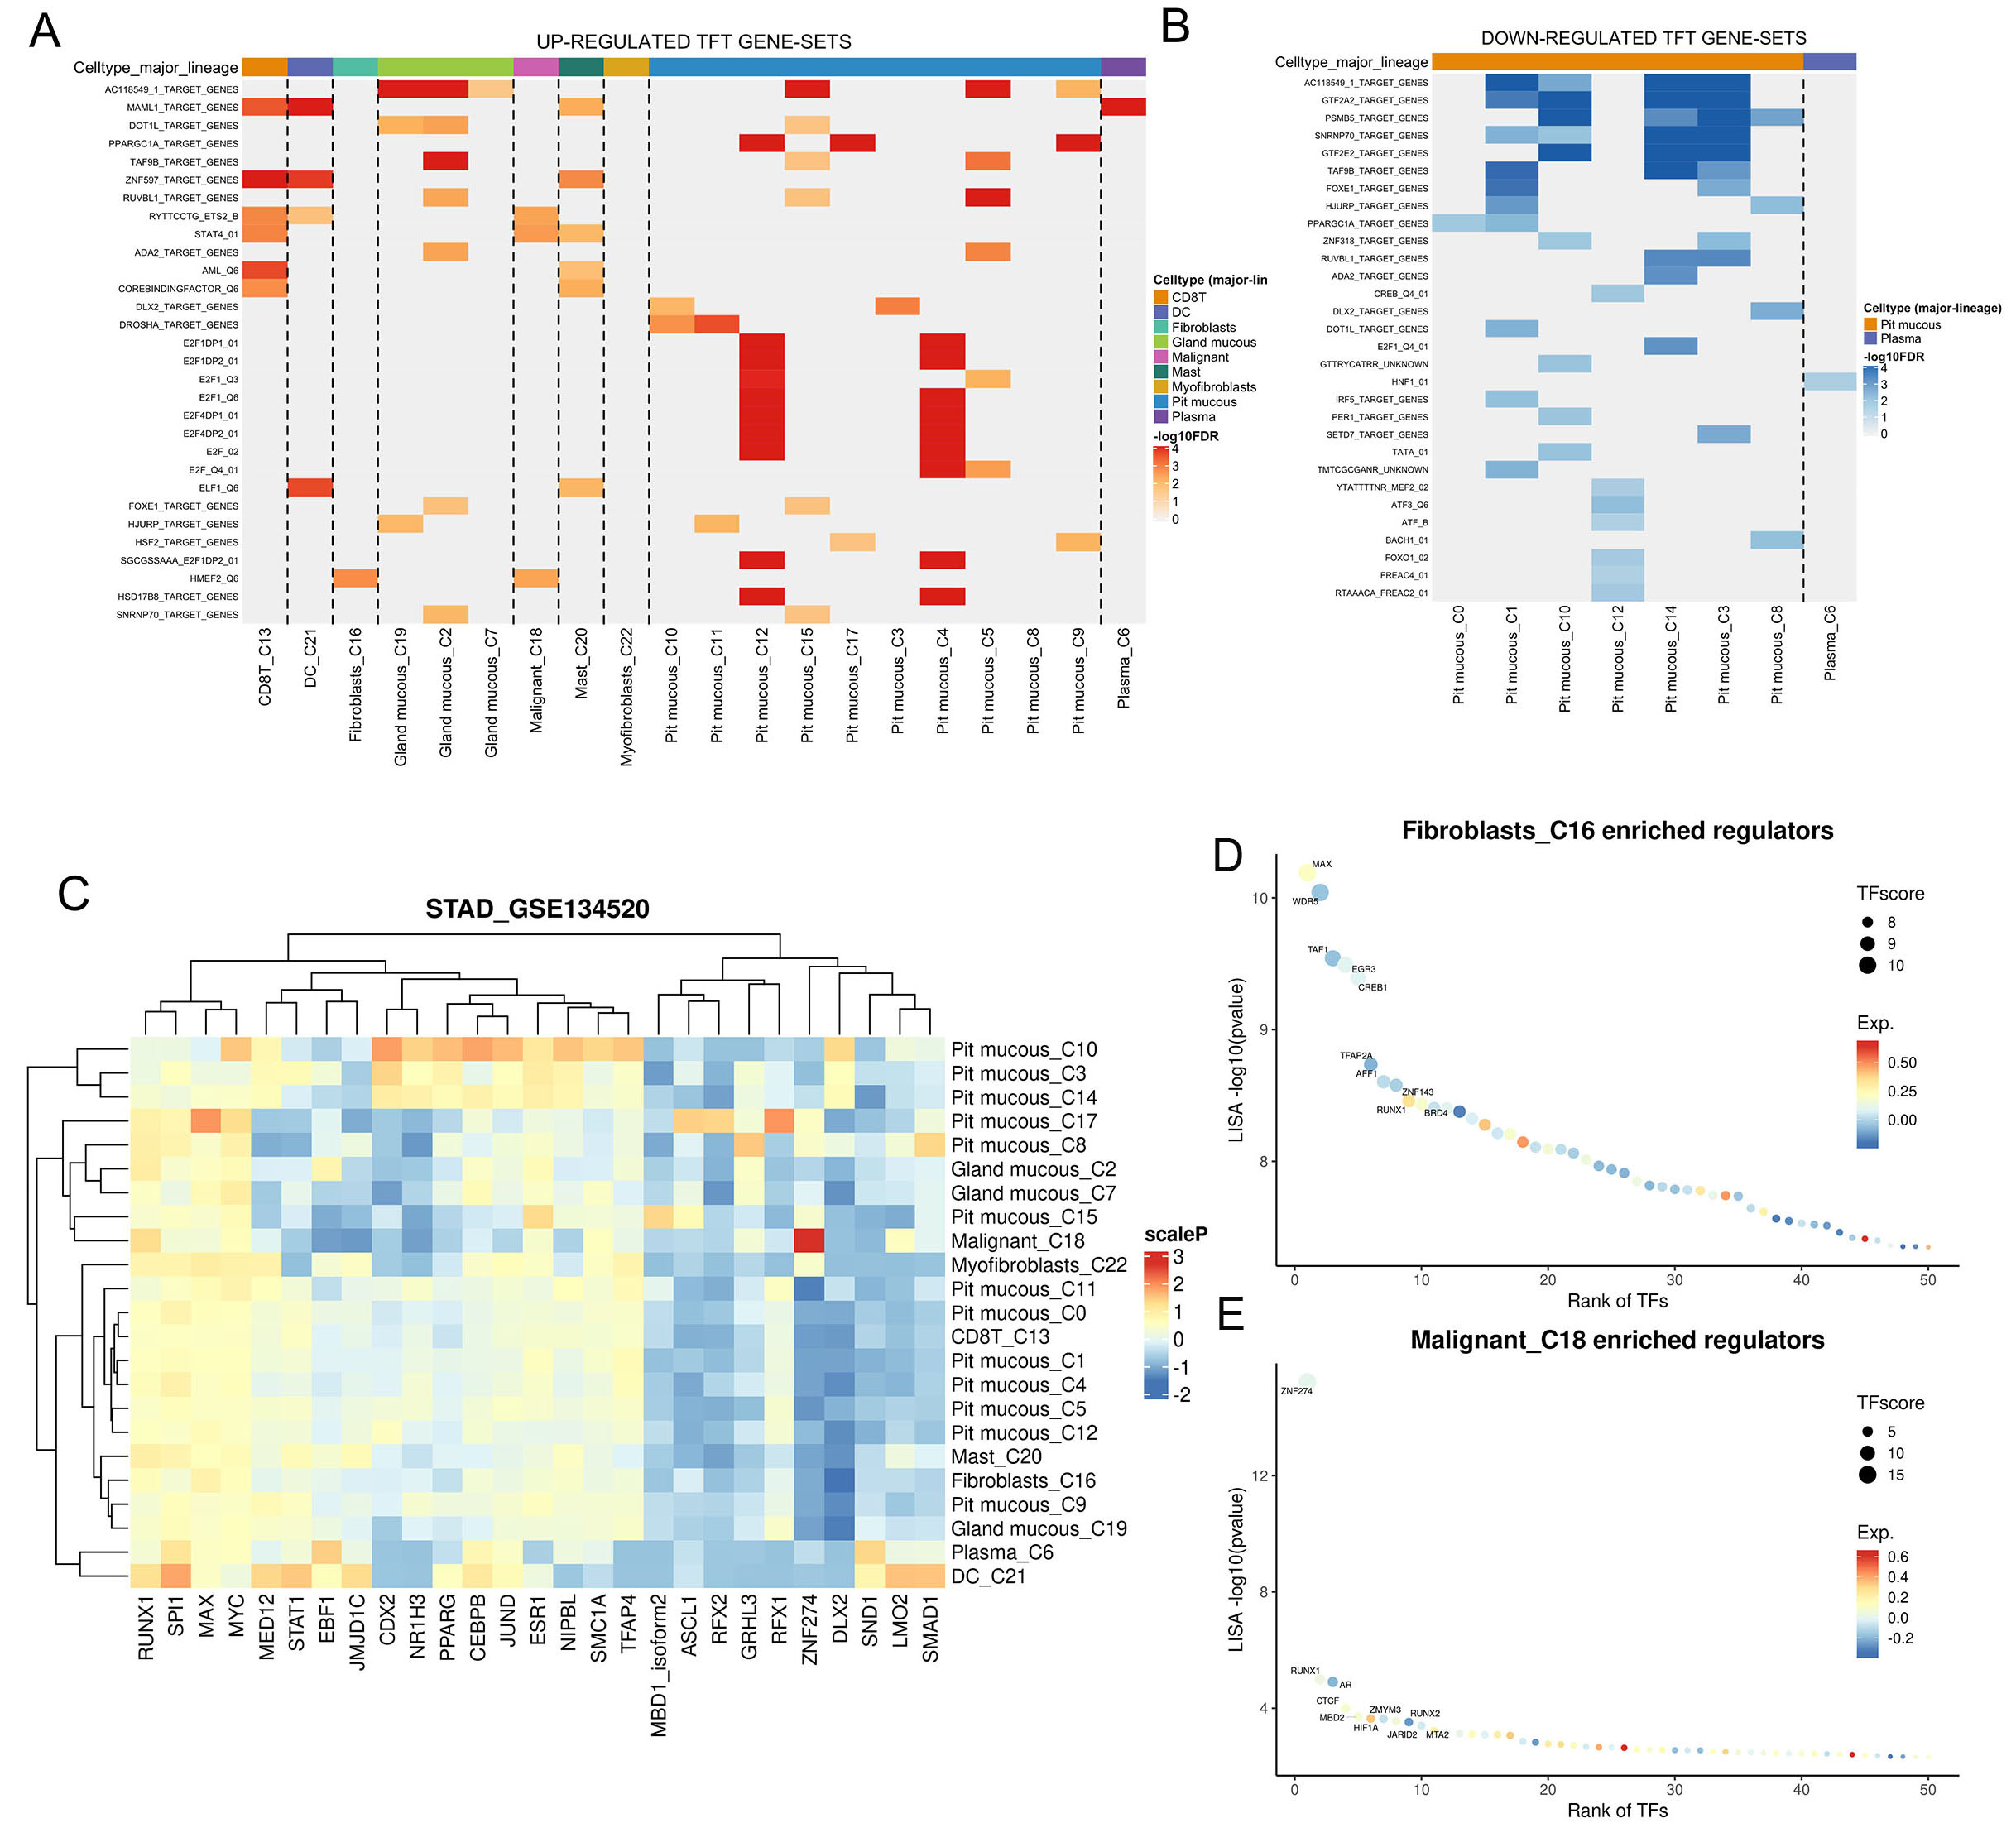
To further explore the transcriptional regulatory landscape associated with CHST14 expression and cell-cell communication in the STAD_GSE134520 dataset, we conducted transcription factor target (TFT) analysis. Heatmaps of significantly up- and downregulated TFT gene sets revealed distinct transcriptional activity across clusters and major cell types [Figure 6A and B]. Notably, fibroblasts (Cluster 16) and malignant cells (Cluster 18) exhibited prominent regulatory signatures, both characterized by strong enrichment in the MEF2-related transcriptional program, particularly the HMEF2_Q6 gene set [Figure 6A]. These shared yet distinct regulatory patterns suggest possible convergent or cooperative signaling roles of CHST14 in these two cell populations. Unsupervised hierarchical clustering of transcription factor activity further delineated unique regulatory landscapes among clusters, with Clusters 16 and 18 forming separate branches marked by strong activation of specific transcriptional programs [Figure 6C]. In Cluster 16 fibroblasts, transcriptional regulators such as RUNX1, SOX9, and MYC were enriched, while Cluster 18 malignant cells showed distinct enrichment of TFs like FOXM1, TEAD4, and SNAI1 [Figure 6D and E]. Together, these findings indicate that CHST14-expressing fibroblasts and malignant cells are governed by distinct transcriptional regulatory circuits, including MEF2-driven programs and other lineage-specific factors. These regulatory networks may contribute to their respective roles in the tumor microenvironment and underscore the potential of CHST14-associated TFs as modulators of stromal-tumor interactions. Further validation is warranted to dissect the mechanistic links between CHST14 expression and transcriptional control in STAD.
Figure 6. Transcriptional regulatory analysis of CHST14-expressing clusters in STAD_GSE134520. (A) Heatmap of upregulated TFT gene sets across cell types and clusters, showing distinct regulatory activity in fibroblasts (Cluster 16) and malignant cells (Cluster 18). (B) Heatmap of downregulated TFT gene sets, highlighting transcriptional repression patterns across clusters. (C) Hierarchical clustering of transcription factor activity scores across cell clusters, revealing unique regulatory profiles for CHST14-high clusters. (D) Dot plot of enriched transcription factors in fibroblasts (Cluster 16), with size indicating TFScore and color representing expression levels. (E) Dot plot of enriched transcription factors in malignant cells (Cluster 18), emphasizing the transcriptional regulators driving these cells.
Hallmark gene set enrichment analysis in single cells
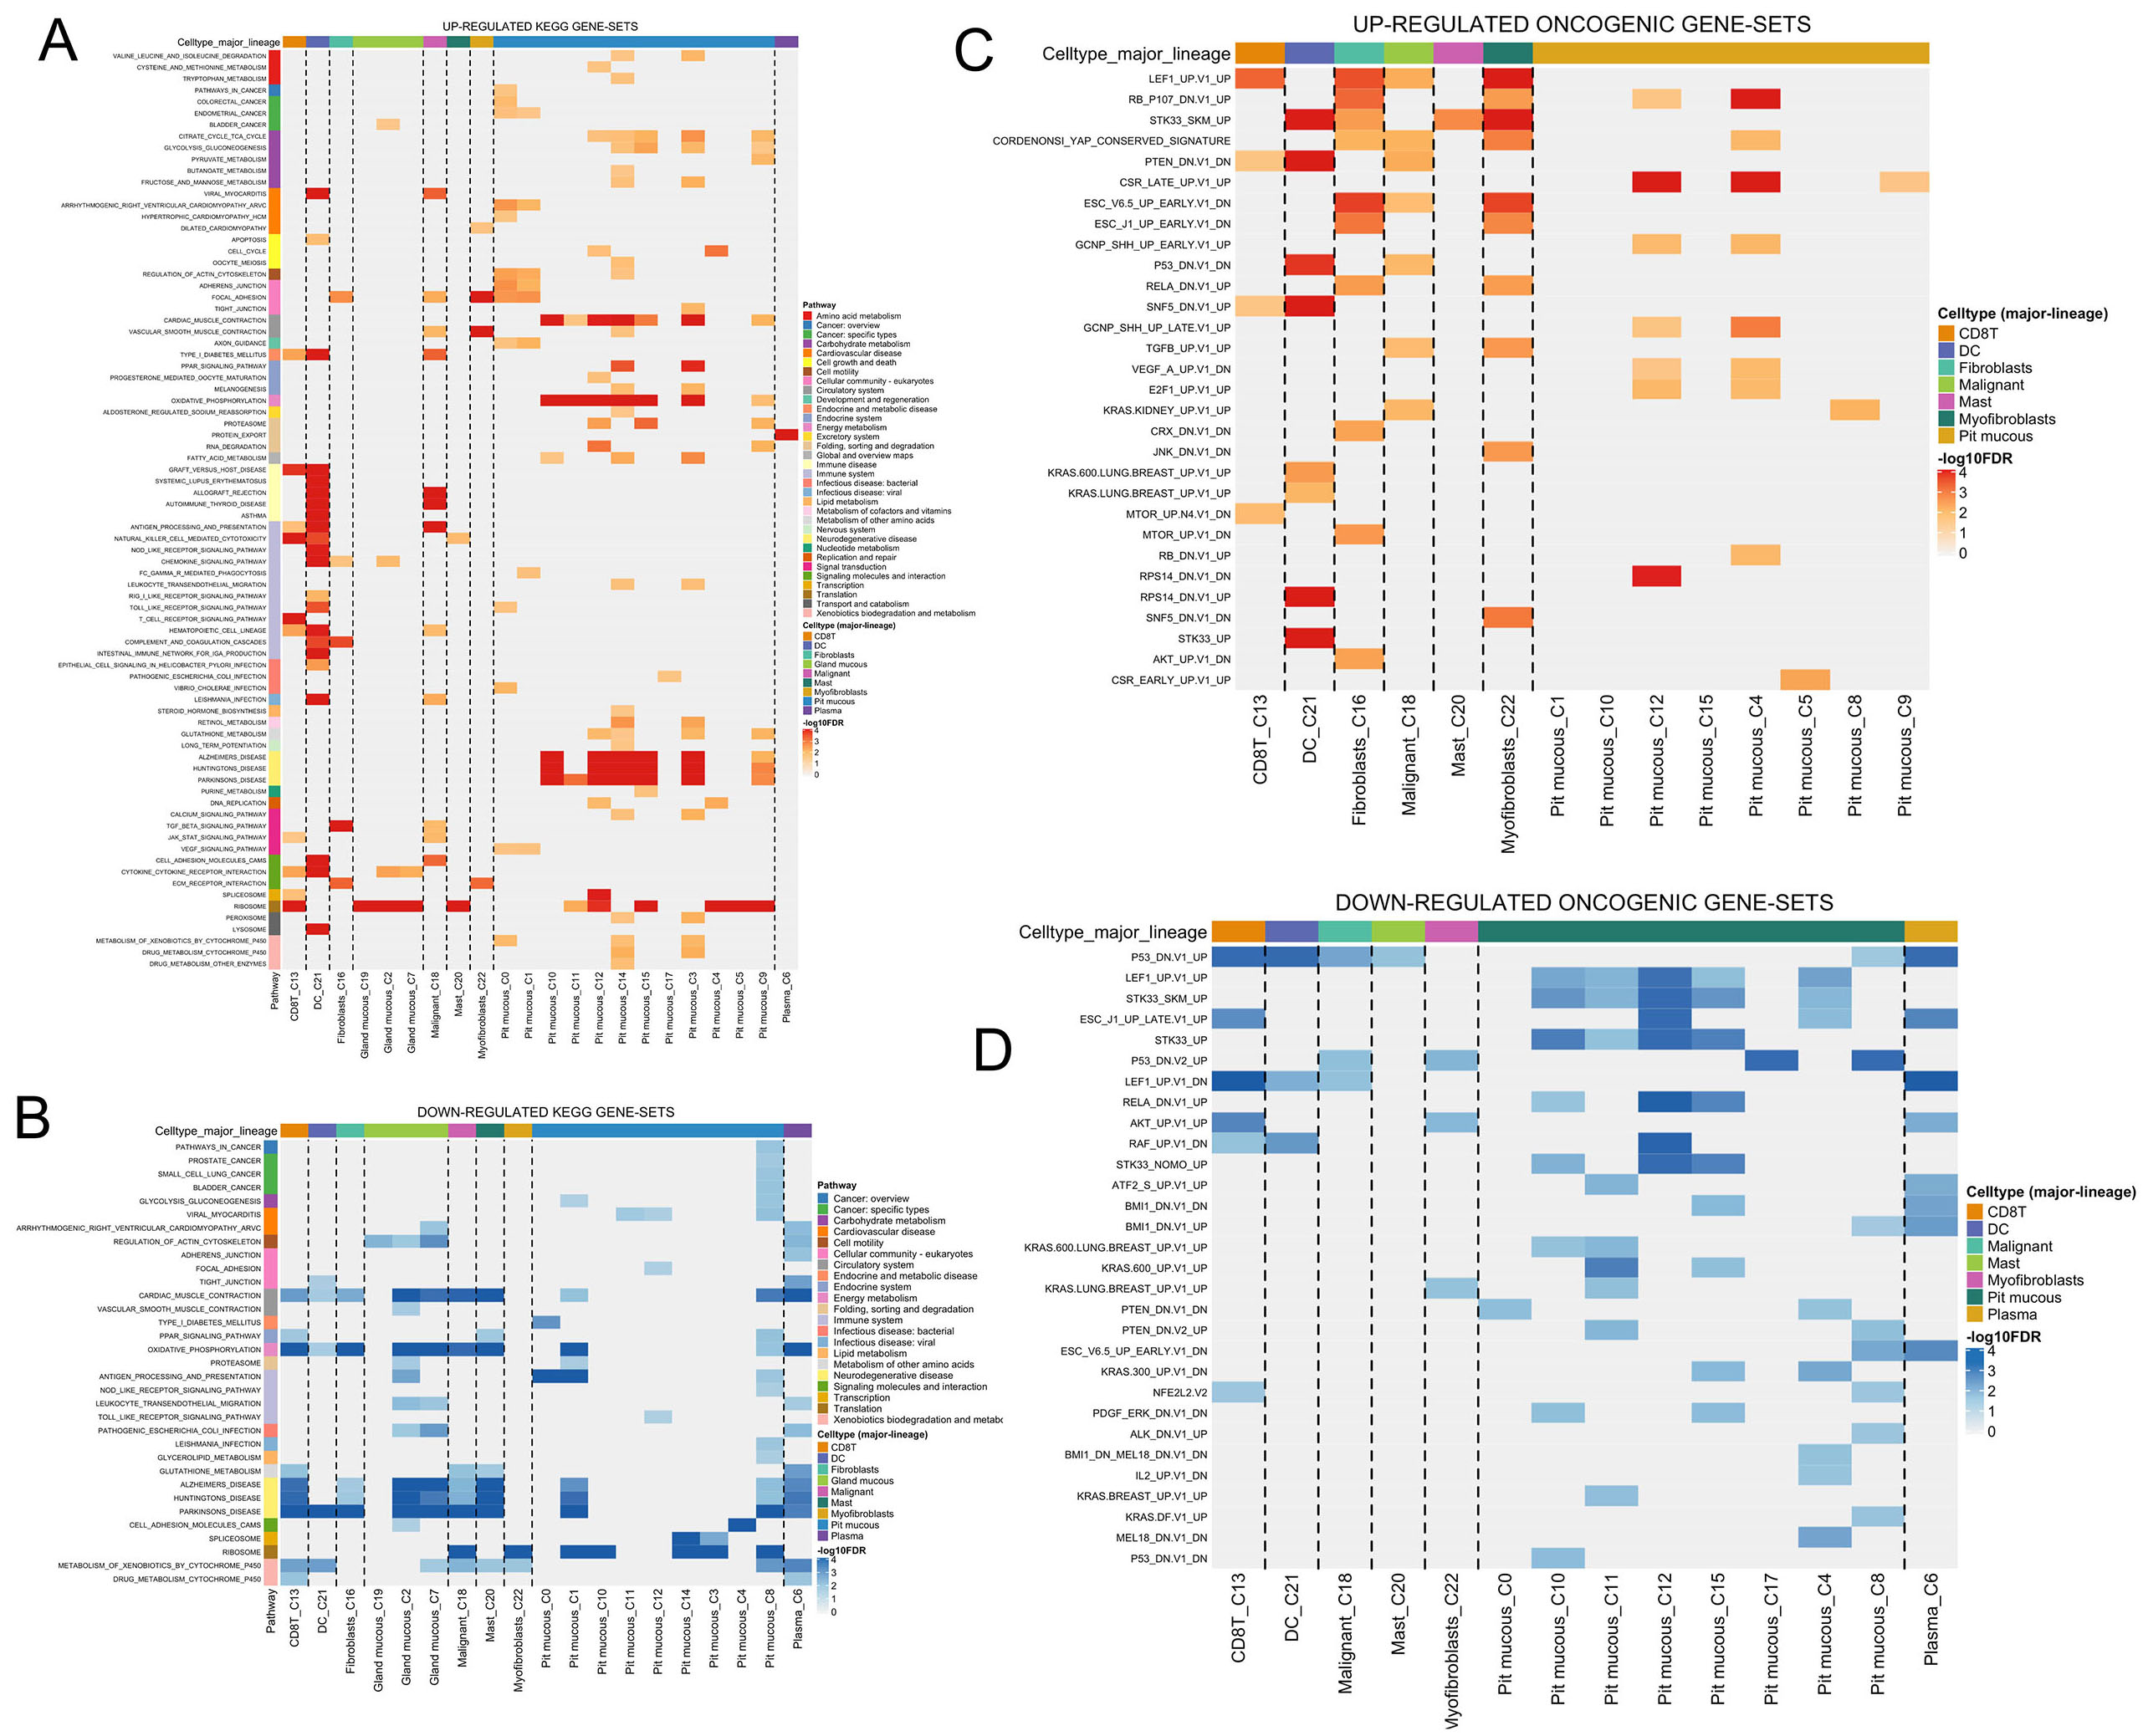
To understand the broader biological processes influenced by CHST14 expression, we performed hallmark gene set enrichment analysis across cell types and clusters in STAD_GSE134520. Heatmaps of upregulated and downregulated hallmark gene sets demonstrated distinct enrichment patterns in fibroblasts (Cluster 16) and malignant cells (Cluster 18) [Figure 7A and B]. Key upregulated hallmark pathways in CHST14-high clusters included “Epithelial-Mesenchymal Transition (EMT)”, “Hypoxia”, and “TNF-α Signaling via
Figure 7. Hallmark and Oncogenic gene set enrichment analysis in CHST14-expressing clusters of STAD_GSE134520. (A) Heatmap of upregulated hallmark gene sets across cell types and clusters, highlighting enriched pathways such as “Epithelial-Mesenchymal Transition”, “Hypoxia”, and “TNF-α Signaling via NF-κB” in CHST14-high clusters (16 and 18). (B) Heatmap of downregulated hallmark gene sets, showing reduced activity in pathways like “Oxidative Phosphorylation” and “Fatty Acid Metabolism” in CHST14-high clusters. (C) Heatmap of upregulated oncogenic gene sets across cell types and clusters, showing enrichment of pathways such as “PI3K/AKT/mTOR signaling”, “MYC targets”, and “KRAS signaling” in CHST14-high clusters (16 and 18). (D) Heatmap of downregulated oncogenic gene sets, highlighting the suppression of pathways such as “p53 signaling” and “PTEN signaling” in CHST14-high clusters.
Oncogenic gene set enrichment analysis in single cells
To investigate the oncogenic roles of CHST14, we conducted oncogenic gene set enrichment analysis across cell types and clusters in STAD_GSE134520. The heatmaps of upregulated and downregulated oncogenic gene sets revealed significant pathway activity changes in fibroblasts (Cluster 16) and malignant cells (Cluster 18) [Figure 6A and B]. Upregulated oncogenic pathways in CHST14-high clusters included “PI3K/AKT/mTOR signaling”, “MYC targets”, and “E2F targets”, which are critical for promoting cell proliferation, survival, and tumor progression [Figure 7C]. Malignant cells (Cluster 18) also demonstrated enrichment of pathways such as “KRAS signaling” and “WNT/β-catenin signaling”, emphasizing their role in tumorigenesis and metastasis. Conversely, downregulated oncogenic pathways in CHST14-high clusters included “p53 signaling”, “RB1 loss signatures”, and “PTEN signaling”, indicating potential mechanisms of tumor suppressor inactivation in these clusters [Figure 7D]. This suggests that CHST14 may be associated with the repression of tumor suppressive pathways in malignant and fibroblast-enriched clusters. These results provide further evidence of CHST14's involvement in oncogenic processes, highlighting its role in activating protumorigenic pathways and repressing tumor-suppressive mechanisms. Experimental validation of these pathways will help elucidate CHST14's contribution to tumor development and progression.
Immunologic gene set enrichment analysis in single cells
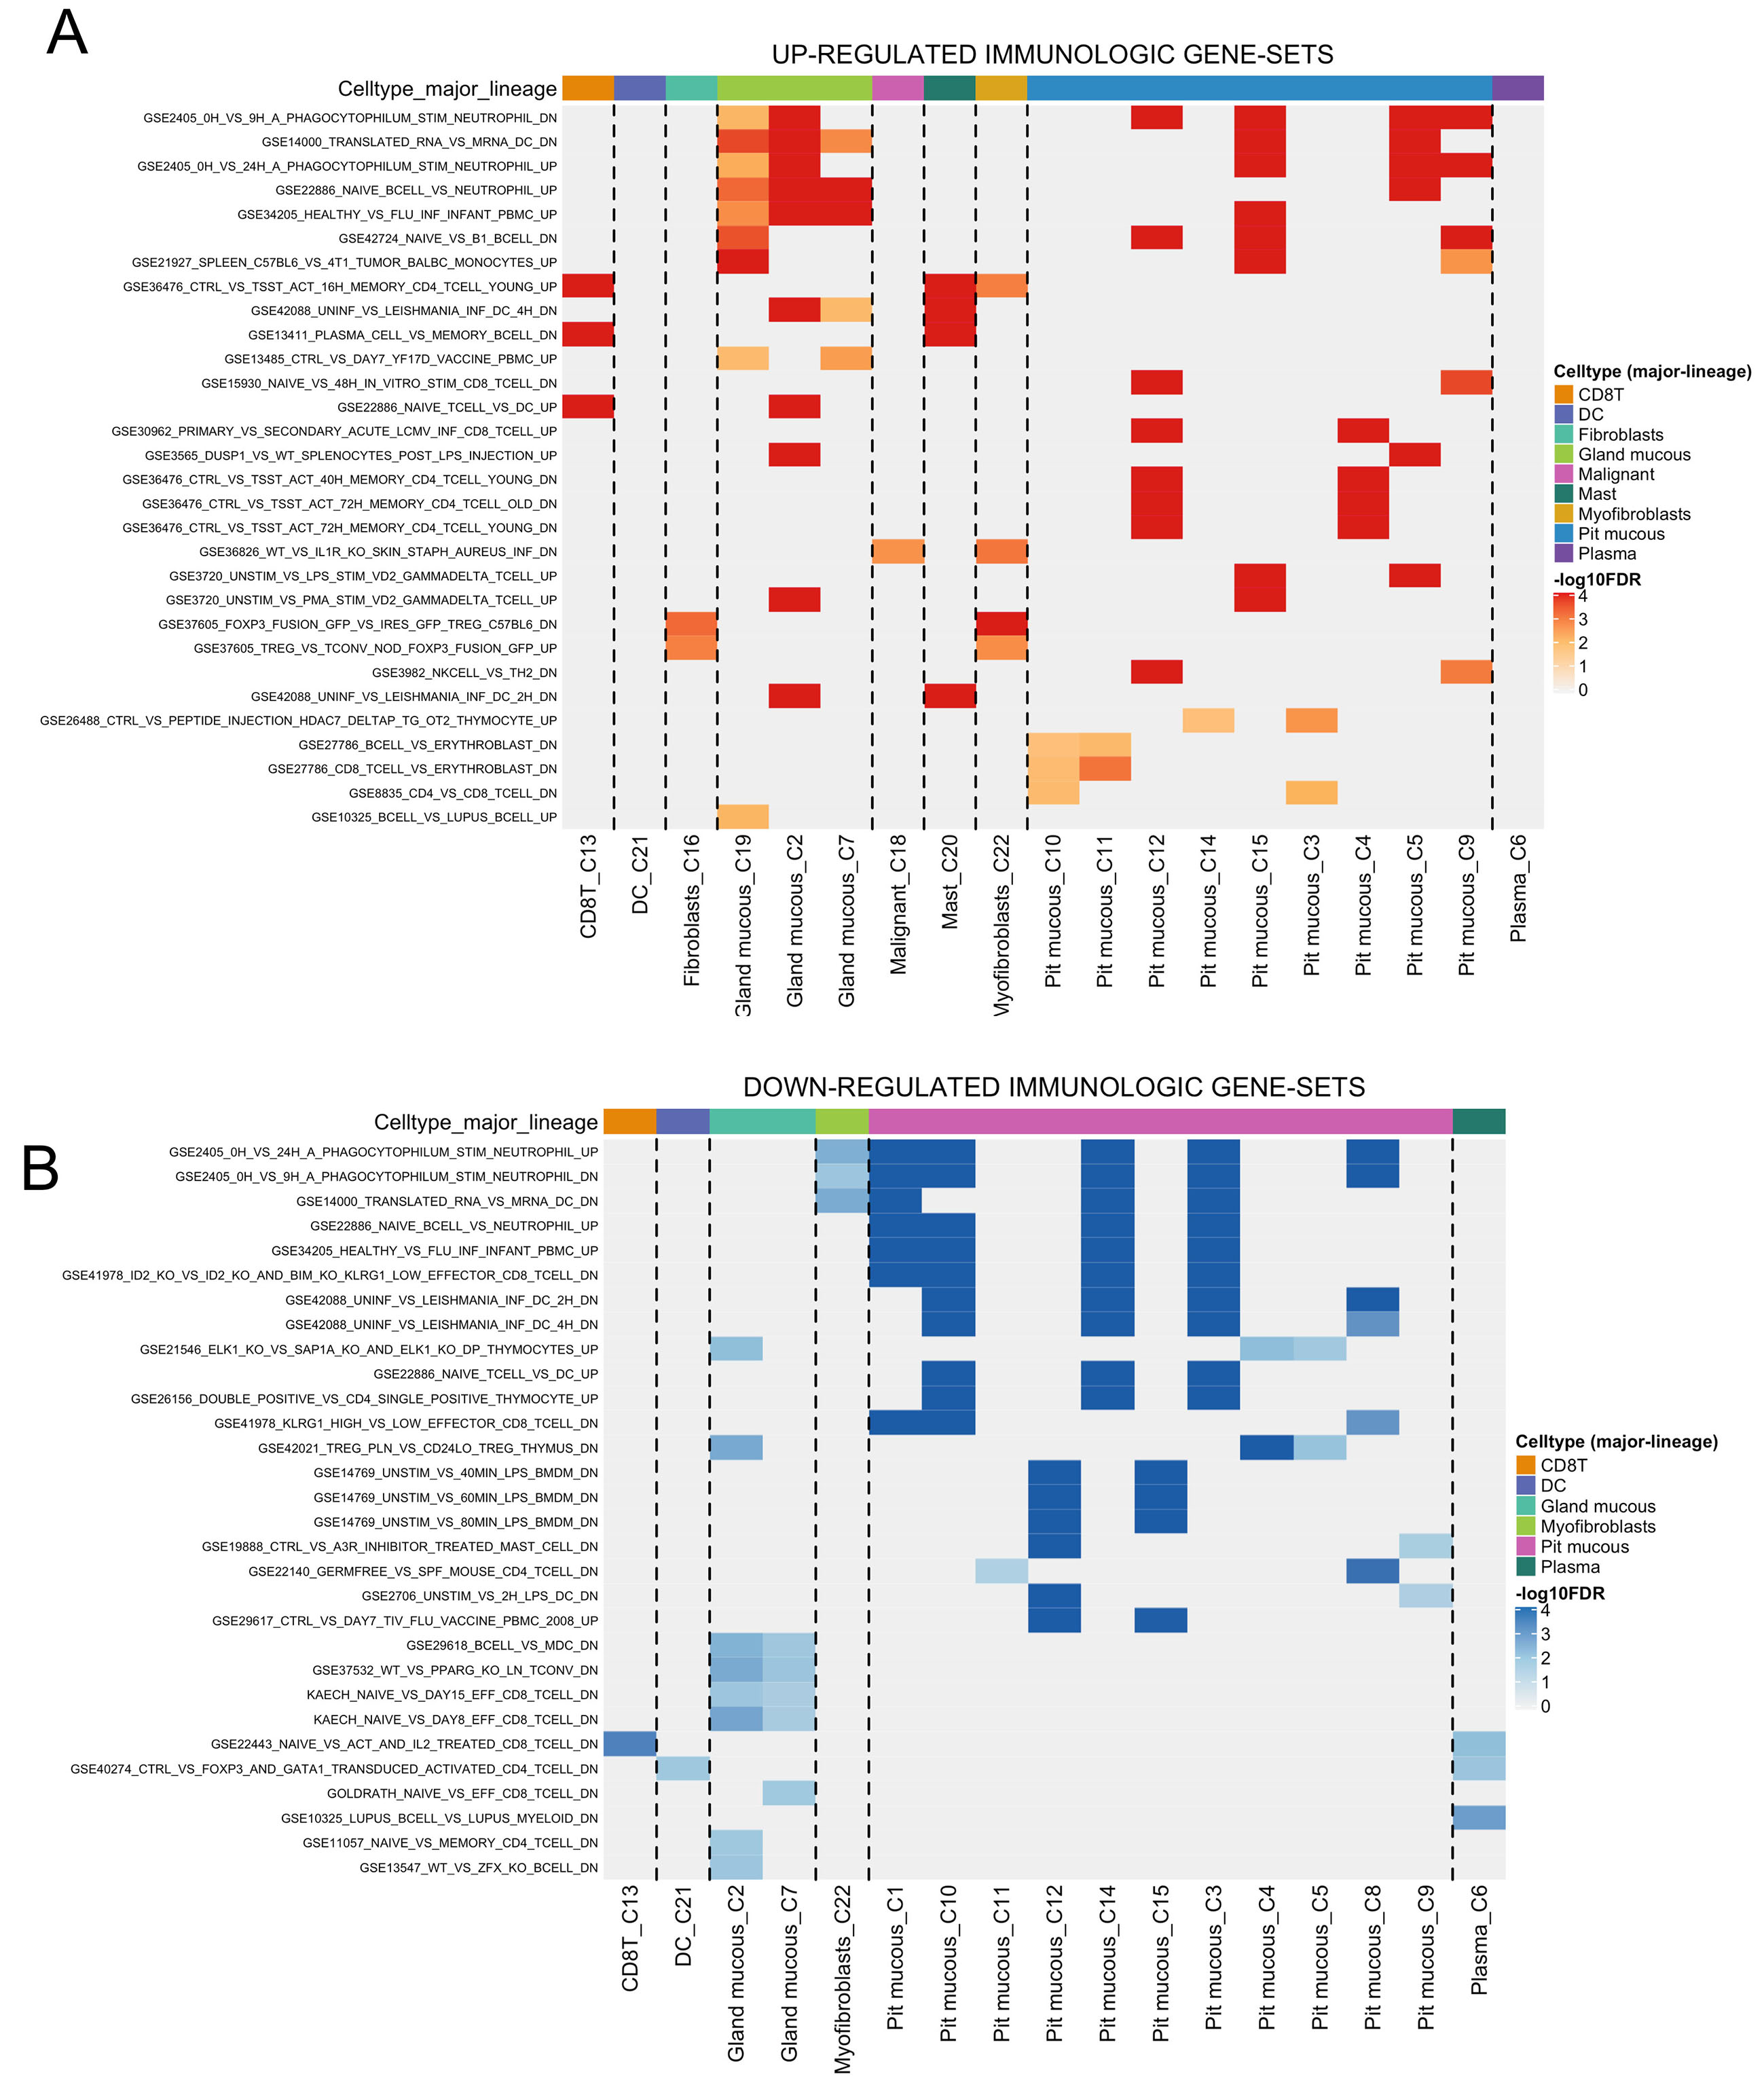
To further explore the immunological roles of CHST14, we performed immunologic gene set enrichment analysis across clusters in STAD_GSE134520. Heatmaps of upregulated and downregulated immunologic gene sets revealed significant alterations in immune-related processes, particularly in fibroblasts (Cluster 16) and malignant cells (Cluster 18) [Figure 8A and B]. The upregulated immunologic pathways in CHST14-high clusters included “Toll-like receptor signaling”, “Type I interferon response”, and “IL-6/JAK/STAT3 signaling” [Figure 8A]. These pathways are key mediators of inflammation and immune response, suggesting an active immune interaction in these clusters. Malignant cells (Cluster 18) displayed strong enrichment of immune suppression-related pathways, indicating their role in immune evasion. Conversely, downregulated immunologic pathways in CHST14-high clusters included “T cell receptor signaling” and “Antigen presentation via MHC Class II” [Figure 8B]. This suggests a dampened adaptive immune response, potentially facilitating tumor immune escape. These findings highlight the dual role of CHST14 in modulating both pro-inflammatory and immunosuppressive processes in the tumor microenvironment. Future experimental validation is needed to clarify the precise immunological impact of CHST14 expression in cancer progression.
Figure 8. Immunologic gene set enrichment analysis of CHST14-expressing clusters in STAD_GSE134520. (A) Heatmap of upregulated immunologic gene sets, highlighting enriched pathways such as “Toll-like receptor signaling” and “IL-6/JAK/STAT3 signaling” in CHST14-high clusters (16 and 18). (B) Heatmap of downregulated immunologic gene sets, showing suppression of pathways like “T-cell receptor signaling” and “Antigen presentation via MHC Class II” in CHST14-high clusters.
GO:BP enrichment analysis in single cells
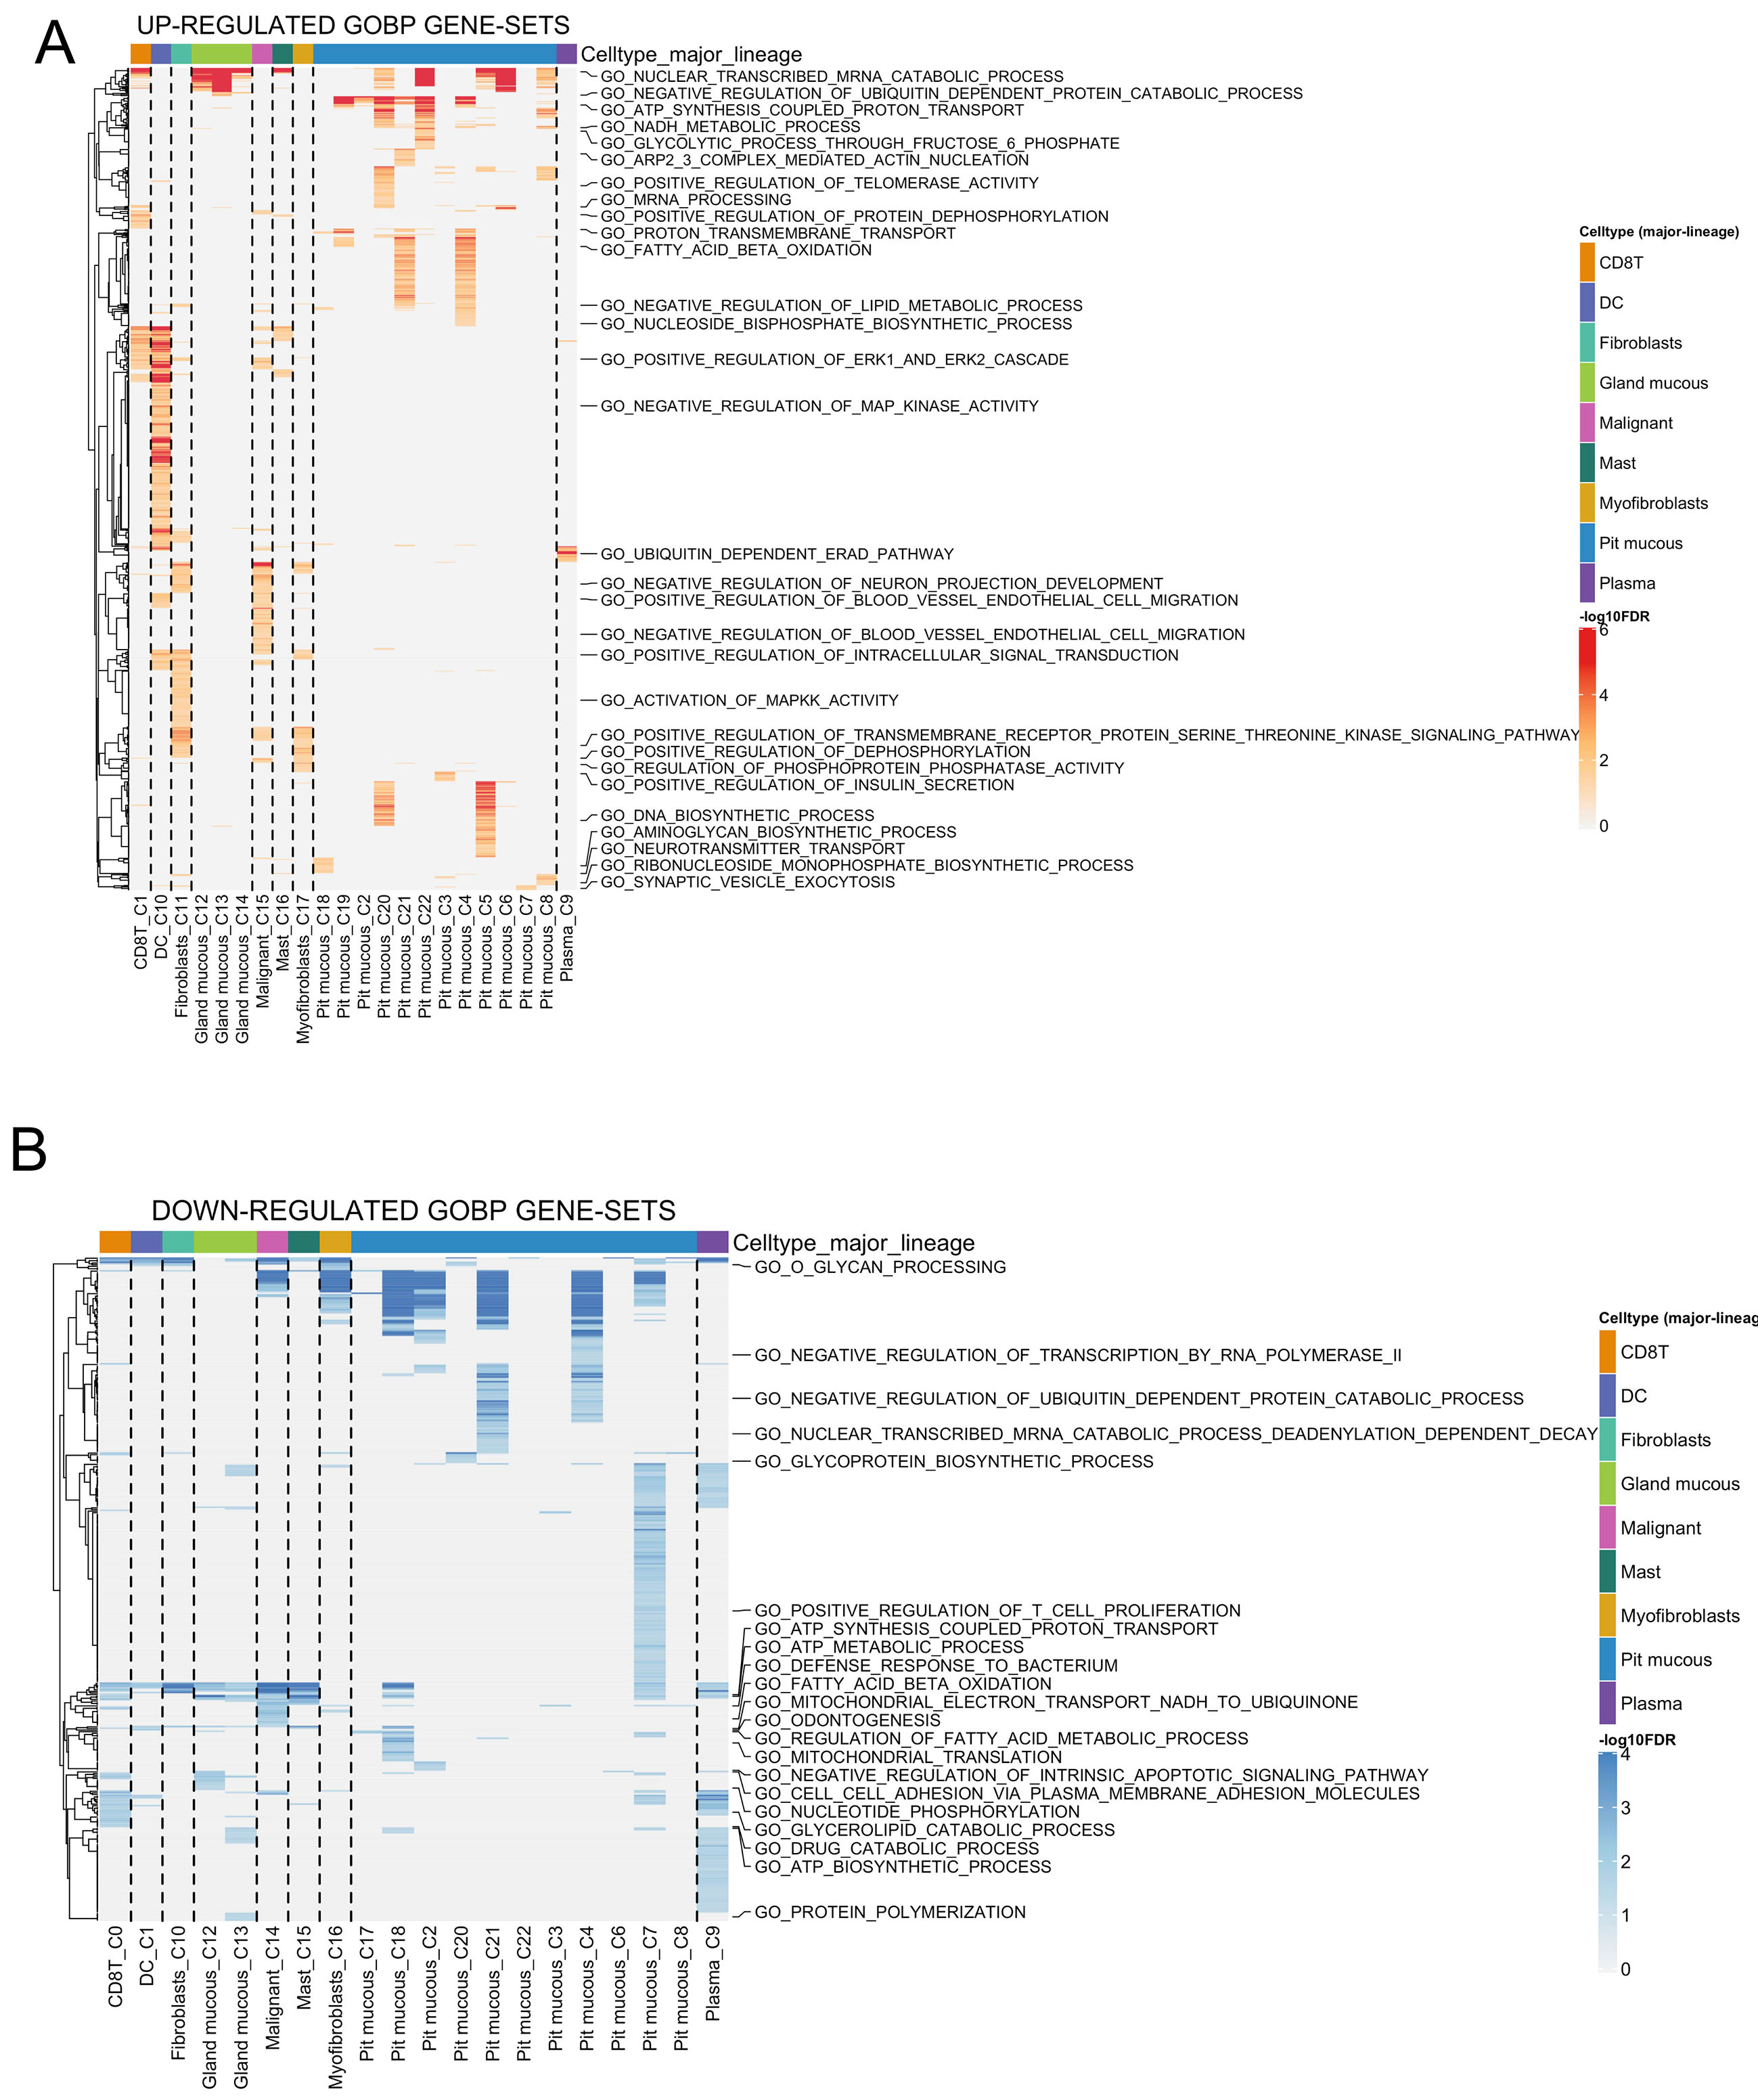
To examine the biological processes associated with CHST14 expression, we performed Gene Ontology Biological Process (GO:BP) enrichment analysis in STAD_GSE134520. Heatmaps of upregulated and downregulated GO:BP gene sets revealed significant functional distinctions among cell clusters, particularly in fibroblasts (Cluster 16) and malignant cells (Cluster 18) [Figure 7A and B]. Key upregulated GO:BP terms in CHST14-high clusters included “Negative regulation of MAPK activity”, “Ubiquitin-dependent ERAD pathway”, and “Regulation of telomerase activity” [Figure 9A]. These processes are critical for cellular stress response, protein homeostasis, and tumor cell survival, indicating the functional significance of CHST14 in the tumor microenvironment. Fibroblasts demonstrated a notable upregulation of lipid metabolism pathways, emphasizing their role in supporting tumor progression. In contrast, downregulated GO:BP terms in CHST14-high clusters included “ATP synthesis coupled proton transport”, “Regulation of fatty acid metabolic process”, and “Cell adhesion via plasma membrane adhesion molecules” [Figure 9B]. This suggests a suppression of energy metabolism and cell adhesion processes, which may contribute to enhanced tumor cell motility and immune evasion. These results indicate that CHST14 expression is linked to the modulation of critical biological processes that promote tumor progression and adaptation. Further validation studies are required to unravel the mechanistic links between these enriched pathways and CHST14 expression.
Figure 9. GO:BP enrichment analysis in CHST14-expressing clusters of STAD_GSE134520. (A) Heatmap of upregulated GO:BP gene sets across cell types and clusters, highlighting terms such as “Negative regulation of MAPK activity”, “Ubiquitin-dependent ERAD pathway”, and “Regulation of telomerase activity” in CHST14-high clusters (16 and 18). (B) Heatmap of downregulated GO:BP gene sets, showing suppression of processes like “ATP synthesis coupled proton transport” and “Cell adhesion via plasma membrane adhesion molecules” in CHST14-high clusters.
DISCUSSION
Gastric cancer is a malignant tumor with high morbidity and mortality, characterized by pronounced tumor heterogeneity and diverse histopathological subtypes. The morphological features of gastric tumors can vary greatly not only between different patients but also across different regions of the same tumor, reflecting its strong histological heterogeneity. Given the complexity of gastric cancer development and progression mechanisms, and the influence of factors such as ethnicity, pathological type, and molecular targets, the search for dominant signaling pathways and more specific targets will be the focus of research on targeted therapies for gastric cancer. Therefore, the discovery of novel biomarkers is of great significance for improving both the diagnosis and prognosis of this disease.
Our research has revealed that CHST14 is highly expressed in gastric cancer and may be a diagnostic and prognostic marker for overall survival and disease-specific survival. Its expression was assessed using combined GTEx and TCGA data, as well as TCGA paired analysis alone. Although the absolute expression values varied slightly between analyses, the overall results consistently indicated high CHST14 expression in gastric cancer, which aligns with the results of Zhou et al.[23].
Meanwhile, it was found to be a diagnostic and prognostic model for overall survival and disease-specific survival of gastric cancer patients based on single-gene prognostic model analysis, but not as a prognostic model for progression-free survival. The prognostic nomogram analysis revealed that it is still far from clinical application of its prognostic value, and therefore, further clinical data validation is needed to compensate for the limitations of this study.
Furthermore, we found for the first time that this gene may be associated with drug metabolism for gastric cancer treatment, such as Retinol metabolism and cytochrome P450. It is associated with the sensitivity of clinical drugs and may have positive or negative regulation of the metabolism of different clinical drugs. Nevertheless, the drug sensitivity prediction is based on data from cell lines and not only gastric cancer cells but also other tumor cells, so the accurate predictiveness of gastric cancer has to be further validated with independent gastric cancer clinical data. How it affects drug metabolism needs further in-depth study.
In addition, an interesting and important finding was that CHST14 may be associated with the immune microenvironment of gastric cancer, which may be of great significance in targeted therapies and immunotherapy. CHST14 expression is positively associated with B cells, CD4+ T cells, CD8+ T cells, neutrophils, macrophages, and myeloid dendritic cells. These immune cells have a different role in gastric cancer and influence immunotherapy[24,25]. Current immunotherapeutic strategies focus on enhancing T cell-mediated immunity, such as CD4+ T cells and CD8+ T cells[26]. Meanwhile, B cells are receiving increasing attention as a key player in cancer therapy. B cells promote antitumor immunity through IgA production and complement activation early in the pathogenesis, but these B cells undergo apoptosis as the cancer progresses[27]. Analysis of the gastric cancer microenvironment revealed a significant presence of stromal cells, macrophages, dendritic cells, and Tregs[28]. Macrophages can have either a pro‐inflammatory (M1-like) or protumorigenic (M2-like) role. M1 macrophages are known to produce various cytokines such as IL-12, CXCL9, and CXCL10, which help to polarize and attract TH1 cells, thereby strengthening a type 1 immune response and helping to fight tumors[29,30]. Neutrophils, being a major constituent in solid tumors, demonstrate different characteristics in different tumor atmospheres. Studies have shown that individuals with gastric cancer display notably increased neutrophil infiltration in tumors. Tumor-activated neutrophils in GC can suppress immune defense and promote disease development via the GM-CSF-PD-L1 pathway[31].
We used the R package “pRRophetic” to conduct drug resistance analysis. In the context of using the pRRophetic R package to predict drug sensitivity based on gene expression data, the following key parameters and factors are typically involved in determining drug sensitivity: (1) Gene Expression Data: The input data consist of gene expression profiles of the samples, which are used to predict the drug sensitivity. Duplicate gene expression data are summarized using the mean value. (2) Drug Response Data: The package uses precompiled drug response data from the Genomics of Drug Sensitivity in Cancer (GDSC) database, which contain IC50 values (half-maximal inhibitory concentration) for various cancer cell lines and drugs. (3) Ridge Regression: Ridge regression is the core machine learning model used by pRRophetic to estimate drug sensitivity (IC50) based on the gene expression data. Ridge regression is a linear regression method that includes a regularization term to prevent overfitting. (4) Batch Effect Adjustment: The ComBat method is used to correct batch effects, which can arise due to technical variations between different datasets or experimental conditions. This adjustment helps to standardize the data across different batches to improve prediction accuracy. (5) Tissue Type: The tissue type is taken into account during prediction, as it can significantly influence drug sensitivity. The tissue specificity of the model helps in making more accurate predictions for different types of tissues. (6) Drugs of Interest: The package enables the selection of specific drugs from the GDSC database for which the sensitivity predictions will be made. The default setup includes a wide range of chemotherapeutic agents. (7) IC50 Estimation: The primary output of the prediction process is the estimated IC50 for each sample, which represents the concentration of the drug required to inhibit cell growth by 50%. Mechanistically, the observed association between CHST14 expression and drug sensitivity may be partially explained by its involvement in metabolic reprogramming. KEGG analysis revealed that genes downregulated in CHST14-high tumors were enriched in pathways such as retinol metabolism and cytochrome P450-mediated drug metabolism, both of which are critical for detoxification and chemotherapeutic processing. Downregulation of these metabolic programs could alter drug bioavailability or enhance cellular susceptibility to DNA damage, potentially contributing to increased sensitivity to agents such as 5-fluorouracil or SN-38. Conversely, suppression of xenobiotic metabolism may also lead to resistance to drugs that rely on metabolic activation, such as doxorubicin.
Additionally, given CHST14’s correlation with immune-related pathways and immune cell infiltration, it is plausible that it may influence the tumor immune microenvironment, thereby modulating responses to immunotherapy. For example, CHST14-related regulation of ECM remodeling or chemokine signaling could impact T cell trafficking or myeloid recruitment. Taken together, these findings support the potential utility of CHST14 not only as a biomarker of tumor biology but also as a companion diagnostic marker for stratifying patients who may benefit from specific chemotherapeutic or immunotherapeutic regimens. In summary, the drug sensitivity is determined by gene expression profiles, ridge regression model, batch effect correction (via ComBat), tissue type considerations, and the predefined drug response data from the GDSC database. The IC50 value serves as the quantitative measure of the predicted drug sensitivity for each sample. Regarding drug sensitivity analysis, it is important to note that our findings are based on predictive correlations derived from public cancer cell line databases, which are not specific to gastric cancer. While these correlations suggest that CHST14 expression may be associated with sensitivity or resistance to certain chemotherapeutic agents, the data remain inferential and should be interpreted cautiously. Further in vitro and in vivo validation using gastric cancer-specific models is necessary to confirm the predictive value of CHST14 in guiding drug response.
In this study, we adopted a fold change threshold of 1.3 for gene enrichment analysis, which is relatively lower than the conventional cut-offs of 1.5 or 2. This decision was made to maximize the capture of potentially relevant genes associated with CHST14 expression in gastric cancer. Given that CHST14 may exert broad but modest regulatory effects, a stricter threshold could overlook subtle yet biologically meaningful changes in gene expression. Previous studies have shown that moderately differentially expressed genes can still play critical roles in shaping the tumor microenvironment, immune regulation, or therapeutic response, particularly in complex and heterogeneous cancers such as gastric cancer. Therefore, using a fold change cut-off of 1.3 enabled a more inclusive and exploratory approach, allowing us to uncover a wider range of candidate genes and pathways for subsequent investigation. Nevertheless, we acknowledge that the biological significance of these findings should be validated through functional studies. GO and KEGG analyses revealed a wide range of dysregulated pathways involved in both oncogenic signaling and metabolic reprogramming. Among the upregulated pathways, KEGG enrichment analysis highlighted Wnt signaling, PI3K-Akt signaling, MAPK signaling, and Rap1 signaling as prominently activated in CHST14-high tumors. These pathways are known to play critical roles in tumor progression, including cell proliferation, survival, epithelial-mesenchymal transition (EMT), and angiogenesis, suggesting that CHST14 may promote a more aggressive tumor phenotype through activation of these signaling cascades. This is consistent with our hallmark pathway analysis, which also identified EMT and TNF-α/NF-κB signaling as key upregulated processes in CHST14-high clusters. From a Gene Ontology perspective, CHST14-related upregulated genes were enriched in processes such as regulation of cell morphogenesis, cell-substrate adhesion, extracellular matrix organization, and neuron projection guidance. These findings suggest a potential role for CHST14 in remodeling the tumor microenvironment, enhancing cell motility, and possibly contributing to tumor-nerve crosstalk, which has been increasingly recognized in gastric cancer pathobiology. Conversely, the downregulated KEGG pathways were primarily associated with metabolic and detoxification processes, including fatty acid metabolism, retinol metabolism, and cytochrome P450-mediated xenobiotic metabolism. GO analysis further confirmed the suppression of lipid catabolism, digestive function, and epithelial maintenance in CHST14-high samples. This metabolic shift may reflect tumor adaptation toward anabolic metabolism and immune evasion, aligning with prior studies that link metabolic rewiring to poor prognosis in gastric cancer.
Certain signaling pathways such as NF-κB, JAK/STAT, or MAPK are known to regulate the inflammatory response. The activity of these pathways, inferred from gene expression, could potentially affect the drug sensitivity of cancer cells. Chronic inflammation is known to alter tumor microenvironments, potentially leading to drug resistance or sensitivity changes. High levels of inflammation-related gene expression may correlate with higher IC50 values (indicating resistance) for certain drugs, especially those targeting pathways involved in immune evasion or inflammation-induced survival mechanisms in cancer cells. Importantly, when we examined the differentially expressed genes in relation to drug metabolism, several genes of interest emerged that may influence chemotherapeutic efficacy or toxicity. Notably, upregulation of genes such as CYP3A4, UGT1A1, and ABCB1, which are involved in phase I and II metabolism and drug transport, suggests that CHST14 expression may indirectly modulate the pharmacokinetics of anticancer agents[25]. CYP3A4 is a major cytochrome P450 enzyme responsible for metabolizing many chemotherapeutic drugs, and its overexpression has been implicated in drug resistance[26]. Similarly, UGT1A1 is critical for glucuronidation reactions, influencing drug clearance[32], while ABCB1 encodes P-glycoprotein, a key efflux transporter associated with multidrug resistance[28]. These findings raise the possibility that CHST14-driven molecular programs may not only contribute to tumor aggressiveness via canonical signaling pathways but also affect treatment response by altering drug metabolism and transport. Future studies integrating transcriptomic data with pharmacogenomic profiling could help delineate the clinical relevance of these associations and inform personalized treatment strategies in CHST14-high gastric cancer subgroups.
Our analysis of single-cell RNA sequencing data (STAD_GSE134520) revealed that CHST14 expression is not only unevenly distributed across cell clusters but also significantly elevated in malignant cells (Cluster 18) and gland mucous cells (Cluster 16). This selective expression pattern suggests a cell type-specific functional role for CHST14 in the tumor microenvironment. The robust interactions observed between CHST14-high clusters, particularly between malignant cells and fibroblasts, highlight its potential involvement in facilitating tumor-stroma crosstalk. The interaction heatmap and network visualization underscore the complexity of these communication networks, wherein CHST14 may act as a mediator of signaling pathways that promote tumor progression and microenvironment remodeling.
These findings are consistent with previous studies linking CHST14 to extracellular matrix organization and cellular adhesion, further suggesting that CHST14 might influence the structural and signaling dynamics within the tumor microenvironment. The enrichment of transcriptional regulators such as STAT3 and MYC in CHST14-expressing clusters aligns with their known roles in promoting cell proliferation and inflammatory responses, indicating that CHST14 may participate in driving oncogenic programs. Additionally, the enriched hallmark pathways, including epithelial-mesenchymal transition (EMT) and TNF-α signaling, reinforce the hypothesis that CHST14 contributes to key tumorigenic processes such as invasion and immune modulation.
TCGA data, while foundational, are subject to biases that can impact findings. Recent reviews[29,30] highlight demographic imbalances, with an overrepresentation of European ancestry, limiting generalizability. We should note that bulk RNA-seq averages gene expression across heterogeneous cell populations, potentially obscuring contributions from rare cell types. These limitations underscore the need for complementary single-cell approaches and more diverse datasets to fully capture the complexity of cancer biology. Future experimental studies are necessary to validate these observations and to investigate the molecular mechanisms by which CHST14 mediates cell-cell interactions and influences tumor progression. For instance, functional assays to disrupt CHST14 expression or activity could help delineate its role in communication networks and provide insights into its potential as a therapeutic target in cancer treatment. In order to further explore the significance of CHST14 in gastric cancer treatment, further research is needed to gain a better understanding of its effects on drug metabolism and the tumor immune microenvironment.
Conclusions
Our research found that the protein CHST14 could be used as a diagnostic and prognostic indicator for gastric cancer. CHST14 is known to regulate drug metabolism and shape the immune microenvironment of gastric cancer, comprising B cells, CD4+ T cells and CD8+ T cells, neutrophils, macrophages, and myeloid dendritic cells.
DECLARATIONS
Acknowledgment
The authors thank Panpan Wang for his advice on study design, and Weifen Chen, Zongxiong Liu, Yaqi Yang, and Bryan Liu for their logistical support that made this work possible.
Authors’ contributions
Bioinformatic analysis, manuscript drafting and revision, conceptualization, supervision, funding acquisition, and project administration:Liu H
Conceptualization, methodology, investigation, validation, writing-original draft: Ou L
All authors reviewed the results and approved the final version of the manuscript.
Availability of data and materials
All data generated or analyzed during this study are included in this published article.
Financial support and sponsorship
None.
Conflicts of interest
Liu H is the Associate Editor of Journal of Cancer Metastasis and Treatment and is affiliated with Tianjin Yinuo Biomedical Co. Liu H was not involved in any steps of editorial processing, notably including reviewer selection, manuscript handling, or decision making. Ou L declared that there are no conflicts of interest.
Ethical approval and consent to participate
This study utilized de-identified data from The Cancer Genome Atlas (TCGA) database, which is publicly accessible. The original collection and release of these data have already been approved by the respective institutional review boards of the contributing centers, in compliance with ethical guidelines and privacy regulations. As such, no additional ethics approval was required for the secondary analysis of these publicly available, de-identified data.
Consent for publication
Not applicable.
Copyright
© The Author(s) 2025.
REFERENCES
1. Smyth EC, Nilsson M, Grabsch HI, van Grieken NC, Lordick F. Gastric cancer. Lancet. 2020;396:635-48.
2. Sung H, Ferlay J, Siegel RL, et al. Global cancer statistics 2020: GLOBOCAN estimates of incidence and mortality worldwide for 36 cancers in 185 countries. CA Cancer J Clin. 2021;71:209-49.
3. Petryszyn P, Chapelle N, Matysiak-Budnik T. Gastric cancer: where are we heading? Dig Dis. 2020;38:280-5.
4. Sonkin D, Thomas A, Teicher BA. Cancer treatments: past, present, and future. Cancer Genet. 2024;286-287:18-24.
5. Zhang Z, Liu N, Sun M. Research progress of immunotherapy for gastric cancer. Technol Cancer Res Treat. 2023;22:15330338221150555.
6. Gullo I, Carneiro F, Oliveira C, Almeida GM. Heterogeneity in gastric cancer: from pure morphology to molecular classifications. Pathobiology. 2018;85:50-63.
7. Malfait F, Syx D, Vlummens P, et al. Musculocontractural ehlers-danlos syndrome (former EDS type VIB) and adducted thumb clubfoot syndrome (ATCS) represent a single clinical entity caused by mutations in the dermatan-4-sulfotransferase 1 encoding CHST14 gene. Hum Mutat. 2010;31:1233-9.
8. Miyake N, Kosho T, Mizumoto S, et al. Loss-of-function mutations of CHST14 in a new type of Ehlers-Danlos syndrome. Hum Mutat. 2010;31:966-74.
9. Janecke AR, Baenziger JU, Müller T, Dündar M. Loss of dermatan-4-sulfotransferase 1 (D4ST1/CHST14) function represents the first dermatan sulfate biosynthesis defect, "dermatan sulfate-deficient adducted thumb-clubfoot syndrome". Hum Mutat. 2011;32:484-5.
10. Mendoza-Londono R, Chitayat D, Kahr WH, et al. Extracellular matrix and platelet function in patients with musculocontractural Ehlers-Danlos syndrome caused by mutations in the CHST14 gene. Am J Med Genet A. 2012;158A:1344-54.
11. Kosho T. CHST14/D4ST1 deficiency: New form of Ehlers-Danlos syndrome. Pediatr Int. 2016;58:88-99.
12. Mizumoto S, Kosho T, Hatamochi A, et al. Defect in dermatan sulfate in urine of patients with Ehlers-Danlos syndrome caused by a CHST14/D4ST1 deficiency. Clin Biochem. 2017;50:670-7.
13. Sandal S, Kaur A, Panigrahi I. Novel mutation in the CHST14 gene causing musculocontractural type of Ehlers-Danlos syndrome. BMJ Case Rep. 2018;2018:bcr-2018.
14. Malfait F, Francomano C, Byers P, et al. The 2017 international classification of the Ehlers-Danlos syndromes. Am J Med Genet C Semin Med Genet. 2017;175:8-26.
15. Kosho T, Mizumoto S, Watanabe T, Yoshizawa T, Miyake N, Yamada S. Recent advances in the pathophysiology of musculocontractural Ehlers-Danlos syndrome. Genes. 2019;11:43.
16. Bian S, Akyüz N, Bernreuther C, et al. Dermatan sulfotransferase Chst14/D4st1, but not chondroitin sulfotransferase Chst11/C4st1, regulates proliferation and neurogenesis of neural progenitor cells. J Cell Sci. 2011;124:4051-63.
17. Zavros Y, Merchant JL. The immune microenvironment in gastric adenocarcinoma. Nat Rev Gastroenterol Hepatol. 2022;19:451-67.
18. Uppal A, Dehal A, Chang SC, et al. The immune microenvironment impacts survival in western patients with gastric adenocarcinoma. J Gastrointest Surg. 2020;24:28-38.
19. Wang B, Zhang Z, Liu W, Tan B. Targeting regulatory T cells in gastric cancer: pathogenesis, immunotherapy, and prognosis. Biomed Pharmacother. 2023;158:114180.
20. Jia L, Wang T, Zhao Y, et al. Single-cell profiling of infiltrating B cells and tertiary lymphoid structures in the TME of gastric adenocarcinomas. Oncoimmunology. 2021;10:1969767.
21. Sathe A, Grimes SM, Lau BT, et al. Single-cell genomic characterization reveals the cellular reprogramming of the gastric tumor microenvironment. Clin Cancer Res. 2020;26:2640-53.
22. Biswas SK, Mantovani A. Macrophage plasticity and interaction with lymphocyte subsets: cancer as a paradigm. Nat Immunol. 2010;11:889-96.
23. Zhou J, Zhang S, Guo C. Crosstalk between macrophages and natural killer cells in the tumor microenvironment. Int Immunopharmacol. 2021;101:108374.
24. Zhang X, Xu W. Neutrophils diminish T-cell immunity to foster gastric cancer progression: the role of GM-CSF/PD-L1/PD-1 signalling pathway. Gut. 2017;66:1878-80.
25. Iversen DB, Andersen NE, Dalgård Dunvald AC, Pottegård A, Stage TB. Drug metabolism and drug transport of the 100 most prescribed oral drugs. Basic Clin Pharmacol Toxicol. 2022;131:311-24.
26. Liu YN, Chen J, Wang J, et al. Effects of drug-drug interactions and CYP3A4 variants on alectinib metabolism. Arch Toxicol. 2023;97:2133-42.
27. Hulshof EC, Deenen MJ, Nijenhuis M, et al. Correction: dutch pharmacogenetics working group (DPWG) guideline for the gene-drug interaction between UGT1A1 and irinotecan. Eur J Hum Genet. 2023;31:1088-9.
28. Haerian BS, Roslan H, Raymond AA, et al. ABCB1 C3435T polymorphism and the risk of resistance to antiepileptic drugs in epilepsy: a systematic review and meta-analysis. Seizure. Seizure;19:339-46.
29. Liu H, Li Y, Karsidag M, Tu T, Wang P. Technical and biological biases in bulk transcriptomic data mining for cancer research. J Cancer. 2025;16:34-43.
30. Liu H, Guo Z, Wang P. Genetic expression in cancer research: challenges and complexity. Gene Rep. 24;37:102042.
31. Wang TT, Zhao YL, Peng LS, et al. Tumour-activated neutrophils in gastric cancer foster immune suppression and disease progression through GM-CSF-PD-L1 pathway. Gut. 2017;66:1900-11.
Cite This Article
How to Cite
Download Citation
Export Citation File:
Type of Import
Tips on Downloading Citation
Citation Manager File Format
Type of Import
Direct Import: When the Direct Import option is selected (the default state), a dialogue box will give you the option to Save or Open the downloaded citation data. Choosing Open will either launch your citation manager or give you a choice of applications with which to use the metadata. The Save option saves the file locally for later use.
Indirect Import: When the Indirect Import option is selected, the metadata is displayed and may be copied and pasted as needed.
About This Article
Copyright
Data & Comments
Data




Comments
Comments must be written in English. Spam, offensive content, impersonation, and private information will not be permitted. If any comment is reported and identified as inappropriate content by OAE staff, the comment will be removed without notice. If you have any queries or need any help, please contact us at [email protected].