


fig6
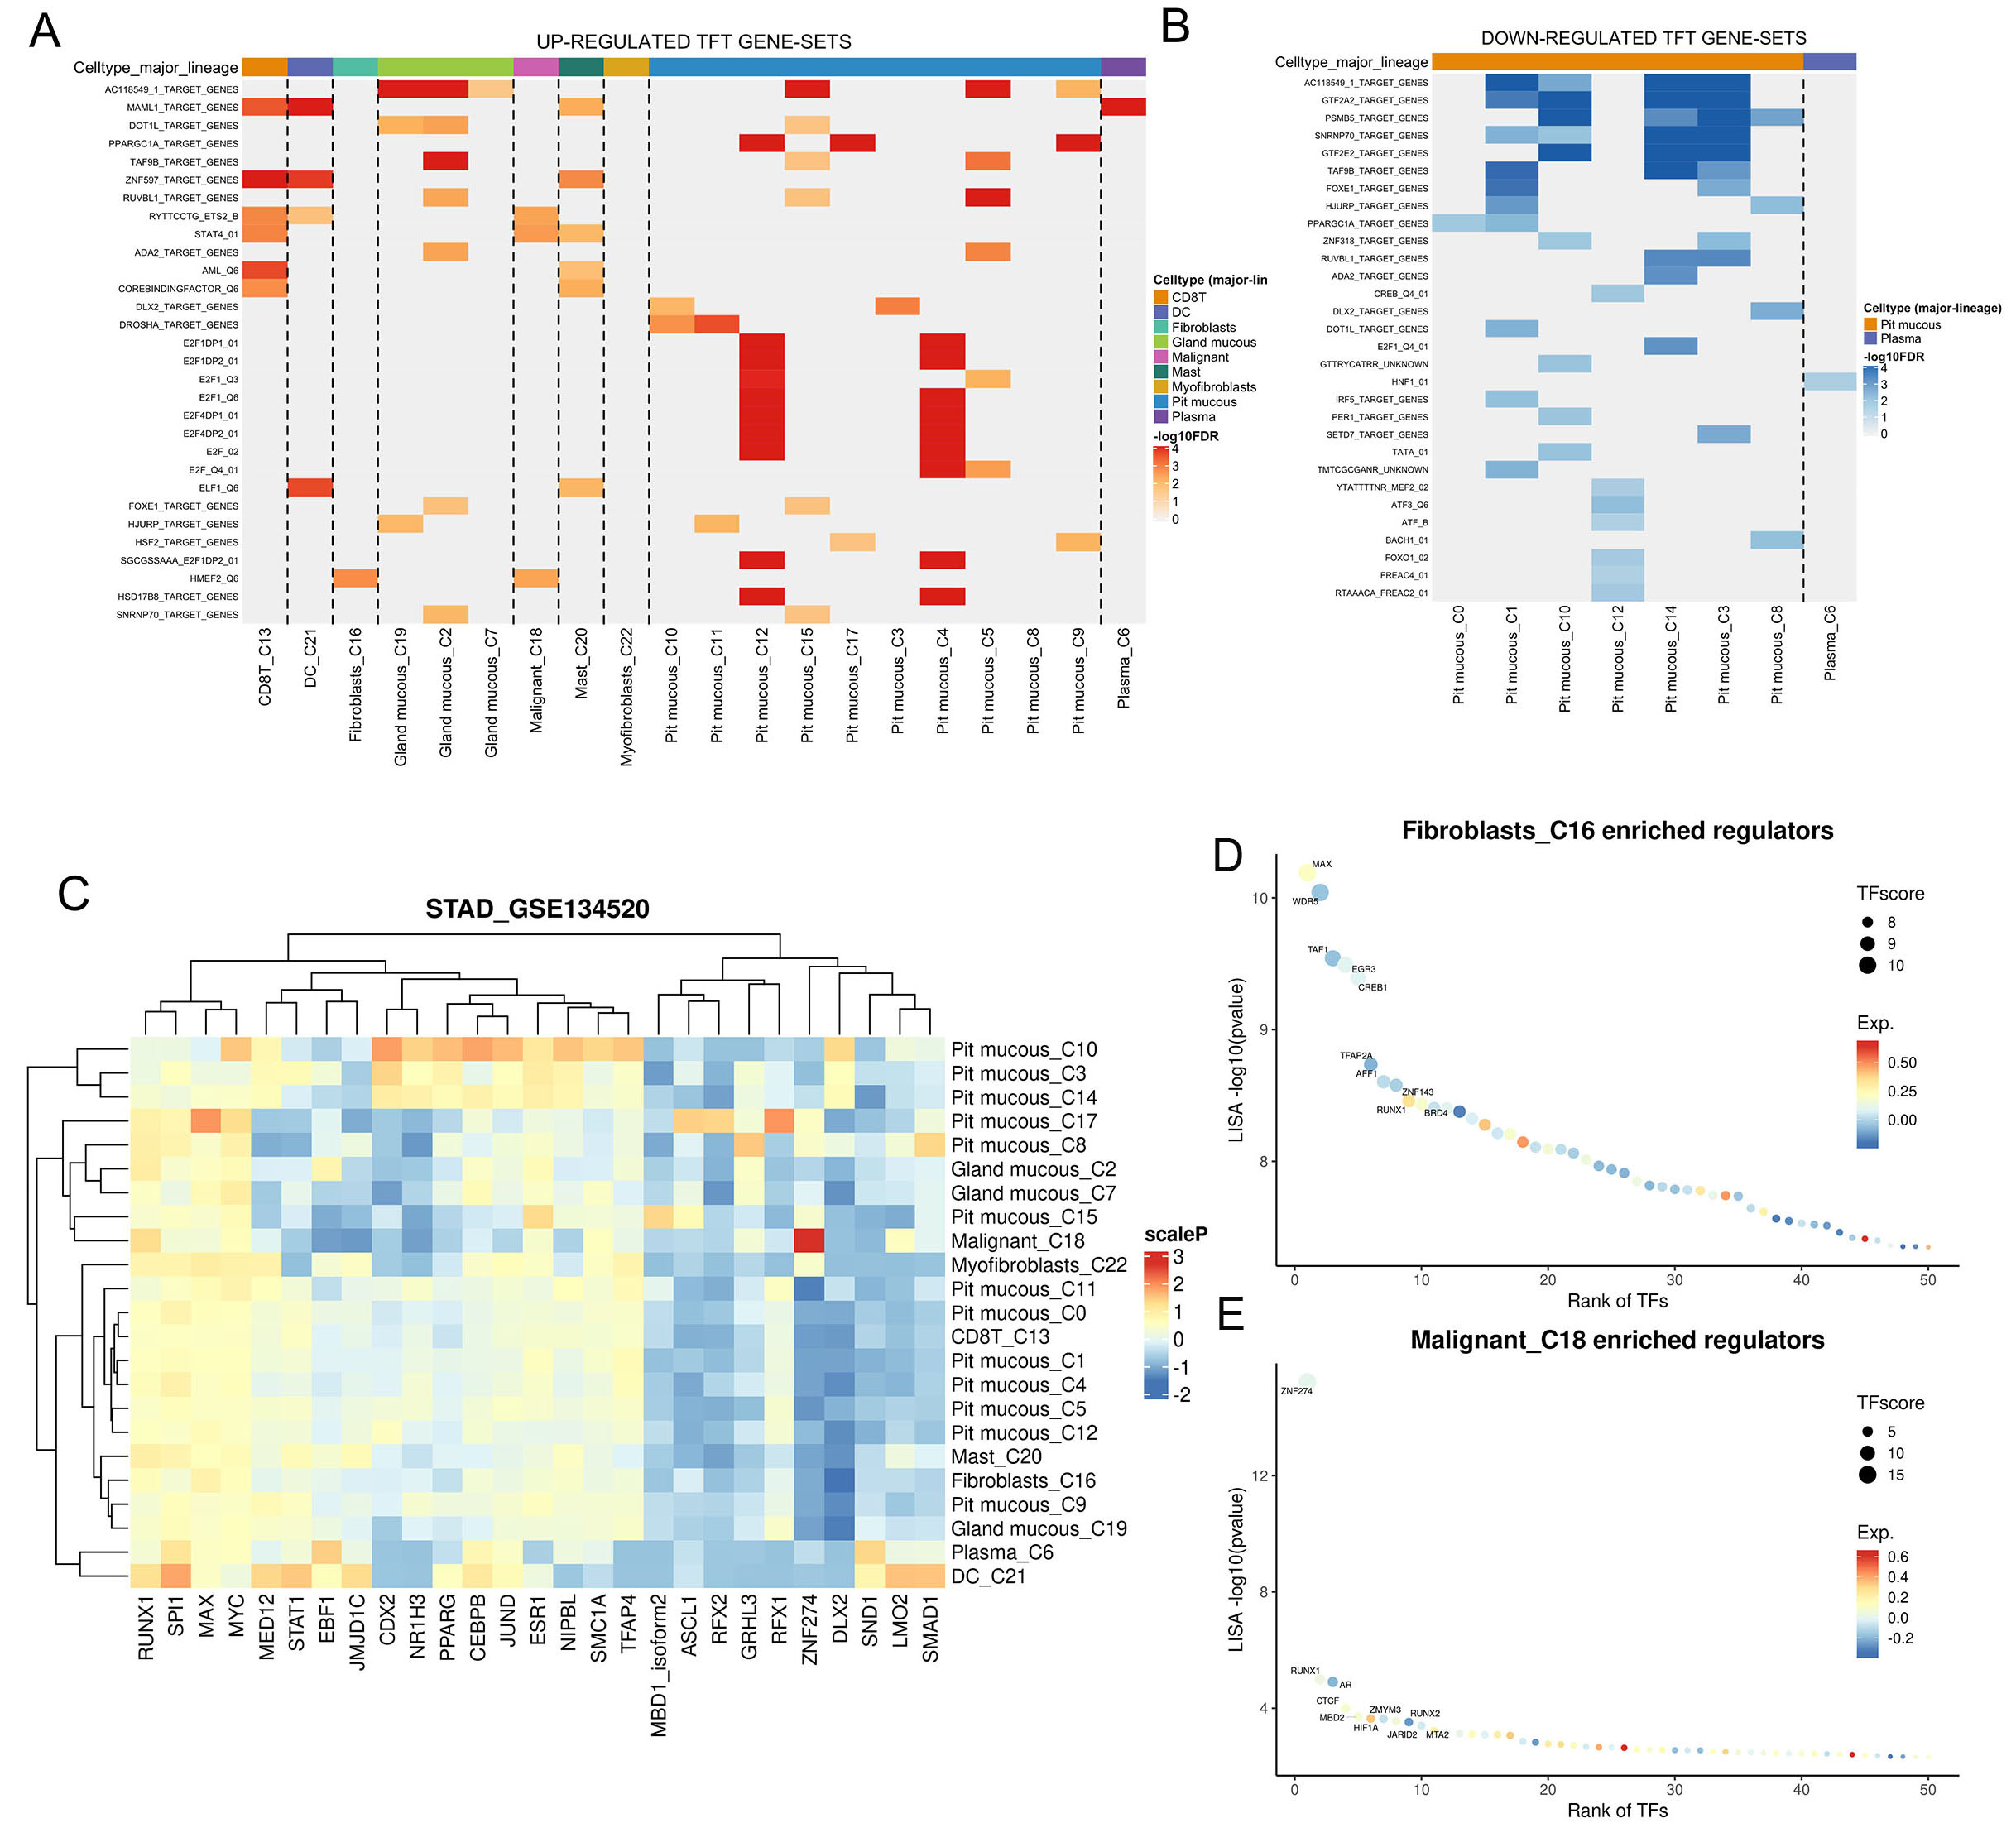
Figure 6. Transcriptional regulatory analysis of CHST14-expressing clusters in STAD_GSE134520. (A) Heatmap of upregulated TFT gene sets across cell types and clusters, showing distinct regulatory activity in fibroblasts (Cluster 16) and malignant cells (Cluster 18). (B) Heatmap of downregulated TFT gene sets, highlighting transcriptional repression patterns across clusters. (C) Hierarchical clustering of transcription factor activity scores across cell clusters, revealing unique regulatory profiles for CHST14-high clusters. (D) Dot plot of enriched transcription factors in fibroblasts (Cluster 16), with size indicating TFScore and color representing expression levels. (E) Dot plot of enriched transcription factors in malignant cells (Cluster 18), emphasizing the transcriptional regulators driving these cells.


