


fig5
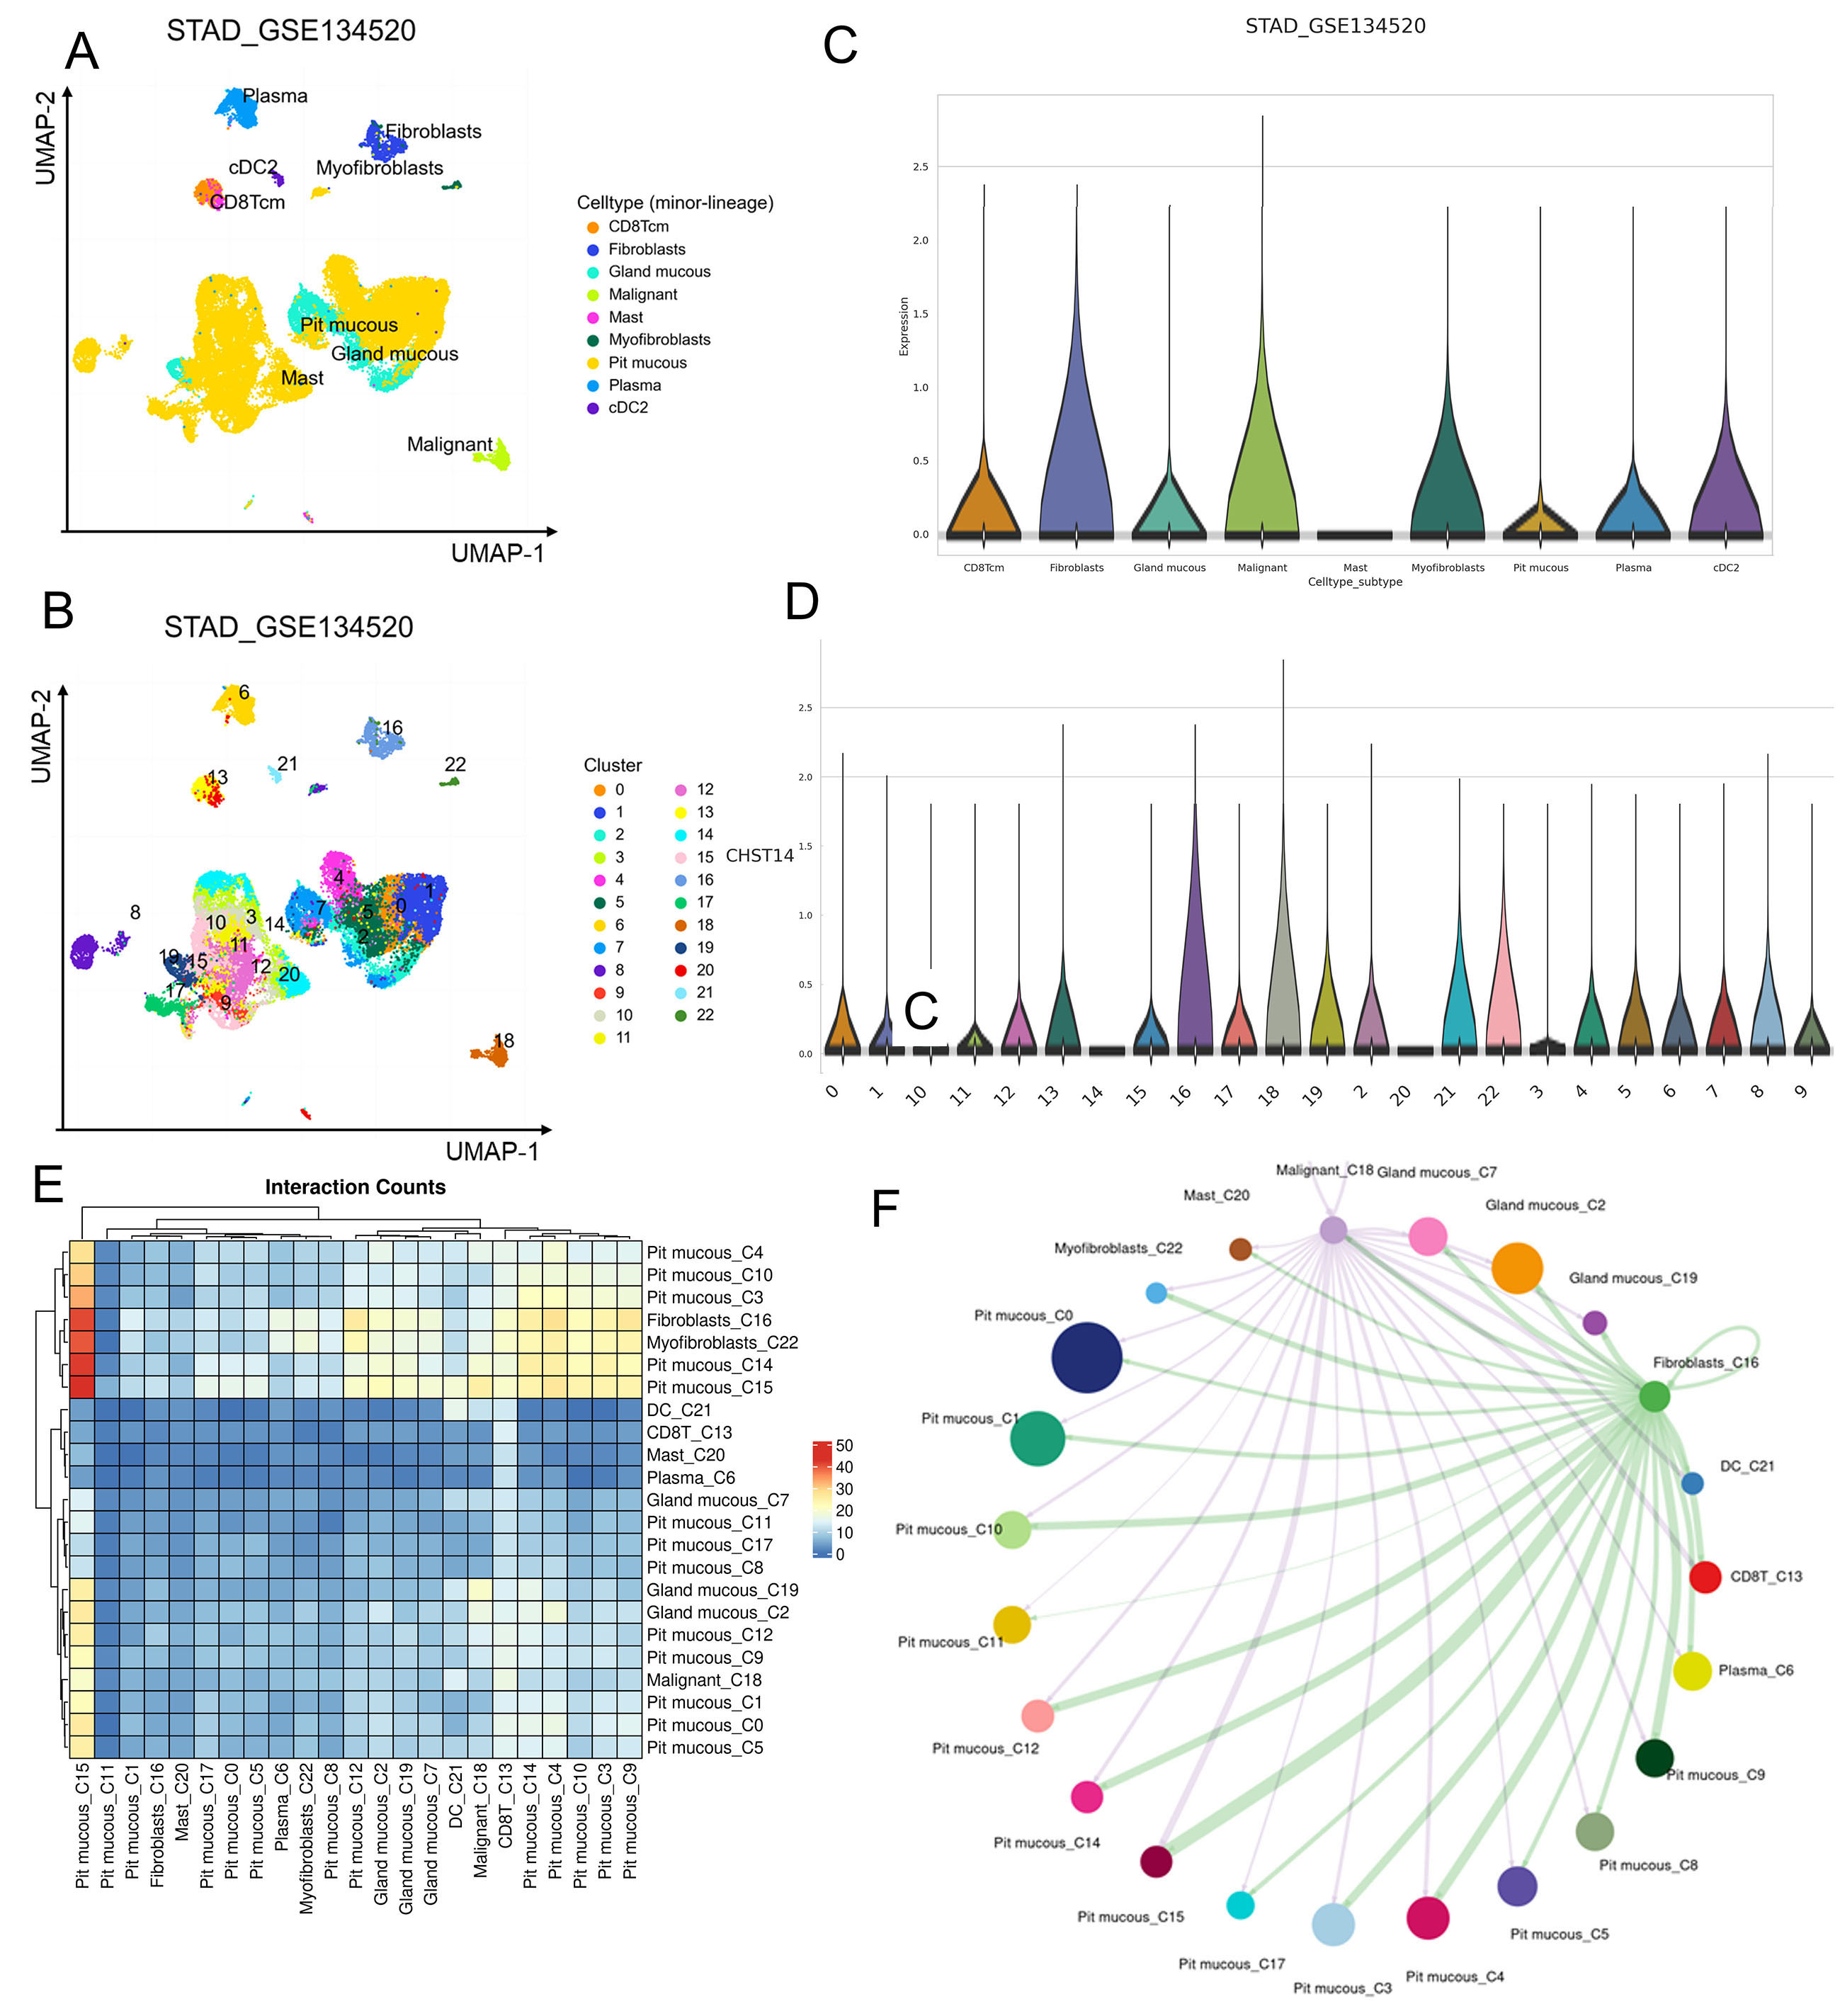
Figure 5. Expression of CHST14 and cell-cell interaction in STAD_GSE134520. (A) UMAP plot of cell clusters colored by cell type, showing the distribution of CHST14 expression across minor lineages. (C) Violin plot of CHST14 expression across cell subtypes, highlighting elevated expression in malignant cells and gland mucous cells. (B) UMAP plot of cell clusters colored by cluster IDs, identifying CHST14-high clusters (16 and 18). (D) Violin plot of CHST14 expression across clusters, indicating significantly higher expression in Clusters 16 and 18. (E) Heatmap of interaction counts between cell clusters, with higher interaction frequency observed in CHST14-expressing clusters. (F) Network diagram illustrating cell-cell communication, highlighting key interactions involving Clusters 16 and 18. UMAP: Uniform manifold approximation and projection.


