



Urinary extracellular vesicles detect altered renal circulation in human obesity
 0
0 Abstract
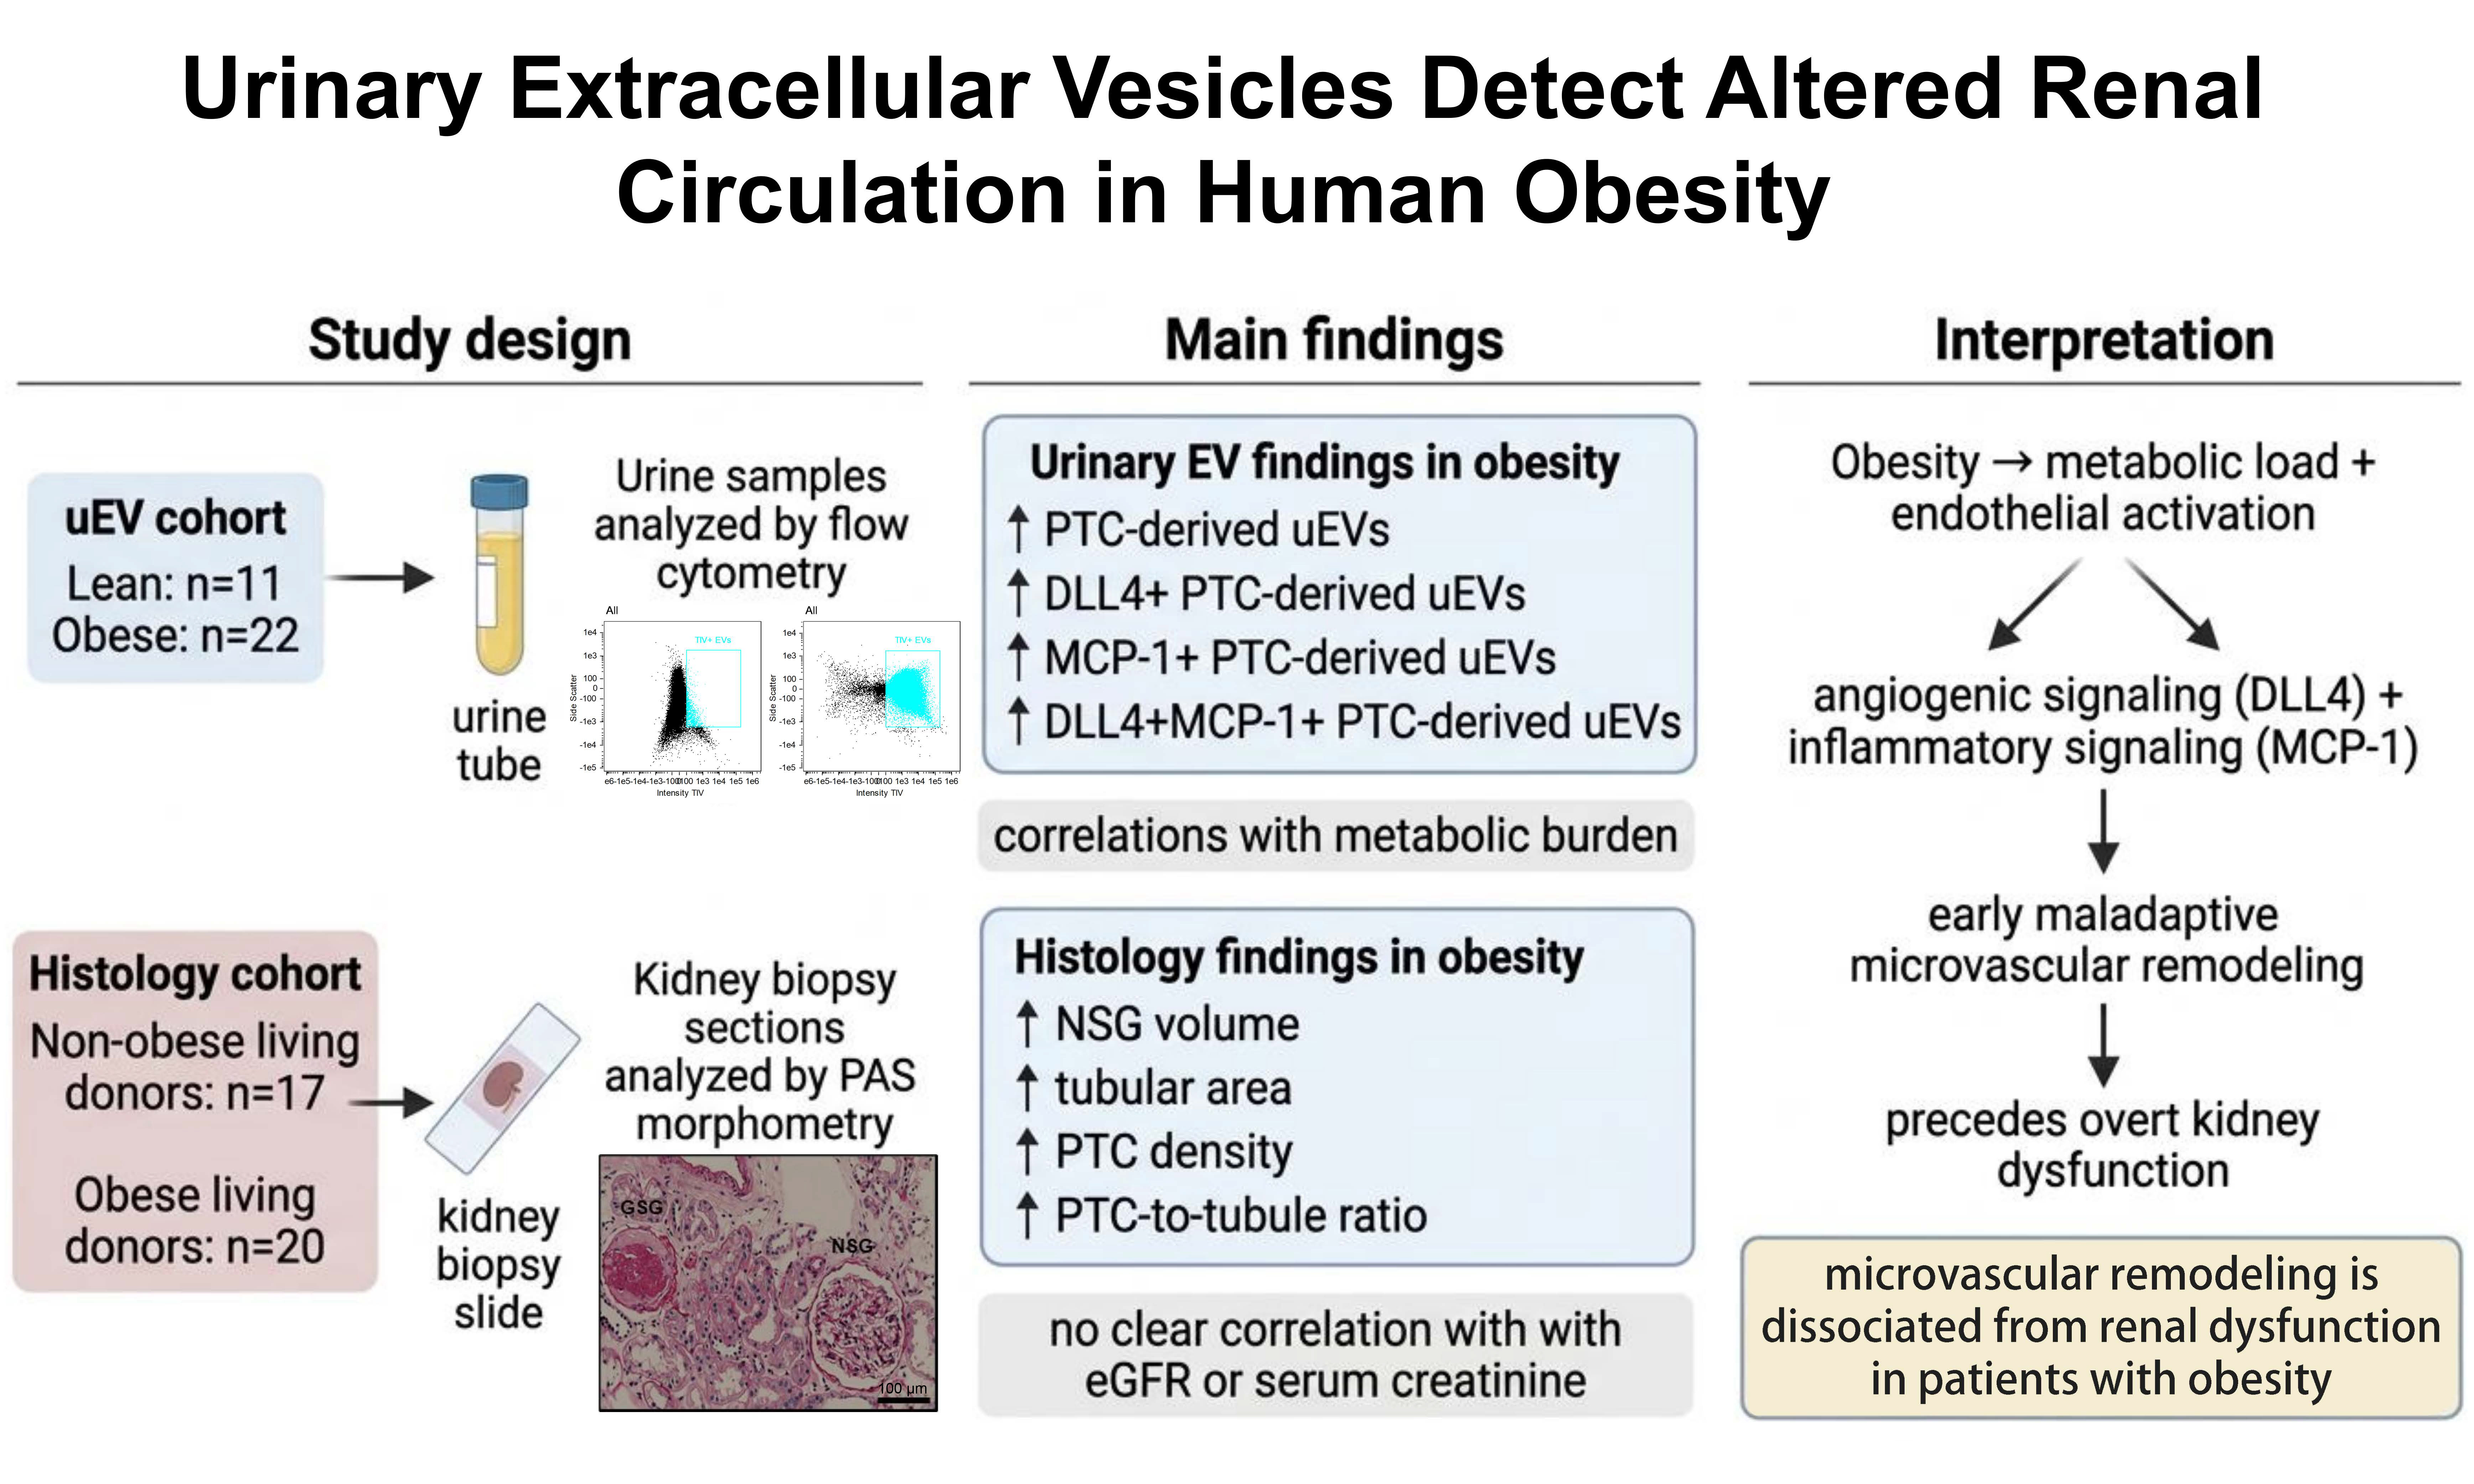
Aim: Obesity may induce renal microvascular injury, particularly in peritubular capillaries (PTCs). Early detection of these changes may help patient management. We tested the hypothesis that levels of PTC-derived urinary extracellular vesicles (uEVs) reflecting early renal microvascular alterations would be elevated in obese individuals with preserved kidney function.
Methods: Urinary samples were collected from 22 obese and 11 lean subjects. uEVs were characterized using flow cytometry for markers of PTC (cluster of differentiation 31 [CD31], plasmalemma vesicle-associated protein [PLVAP], and cluster of differentiation 144 [CD144]), angiogenesis (delta-like-ligand-4 [DLL4]), and inflammation (monocyte chemoattractant protein-1 [MCP-1]). For confirmation, PTC density was quantified and correlated with clinical parameters in kidney biopsies from additional matched groups.
Results: Obese individuals had higher body mass index (BMI), glucose, insulin, urinary protein, and urinary MCP-1 levels than lean controls (P < 0.05), indicating metabolic and inflammatory changes, despite no significant difference in serum creatinine or estimated glomerular filtration rate (eGFR). They also exhibited elevated levels of CD31-/PLVAP+/CD144- PTC-derived uEVs expressing DLL4+ and/or MCP-1+ (P < 0.05 each). Levels of angiogenic PTC-derived DLL4+ uEVs correlated with BMI and systemic insulin, vascular endothelial growth factor-A, and angiopoietin-2 levels in our cohorts, whereas MCP-1+ uEVs derived from inflamed PTC correlated with BMI, glucose, blood pressure, and urinary neutrophil gelatinase-associated lipocalin. PTC density was also increased in kidney biopsies from obese individuals, correlating with BMI and glucose.
Conclusion: DLL4+/MCP-1+ PTC-derived uEVs levels reflecting early renal microvascular changes are elevated in obese individuals, despite preserved kidney function. These findings may indicate that microvascular remodeling is dissociated from renal dysfunction in patients with obesity.
Keywords
INTRODUCTION
The global prevalence of obesity continues to rise, posing a substantial risk for metabolic and cardiovascular diseases, including chronic kidney disease (CKD)[1]. A critical complication of obesity is the disruption of the renal microcirculation, particularly involving damage to the peritubular capillaries (PTCs), which are integral to maintaining renal function. PTCs regulate blood flow, facilitate nutrient exchange, and support tubular function by providing oxygen and removing metabolic waste. However, in obese individuals, increased hemodynamic stress and chronic low-grade inflammation may lead to PTC dysfunction, contributing to the progression of kidney injury and CKD[2]. PTC loss and rarefaction have been implicated as central mechanisms in renal damage in long-term obesity and CKD, where diminished capillary density impairs oxygen delivery, leading to tissue hypoxia and fibrosis[3]. Pertinently, in the early stages of inflammatory renal disease, microvascular loss might be preceded by proliferation of abnormal immature microvessels, confirmed by an elevated fraction of integrin-ß-3+ vessels, implying increased renal angiogenic activity[4,5].
Despite the well-recognized association between obesity and renal microvascular damage, effective non-invasive methods to evaluate microvascular integrity in these patients are lacking. Traditional approaches, including kidney biopsy, while informative, are invasive and limited in their ability to detect early microvascular changes[6]. This void creates a critical need for non-invasive biomarkers that can detect early microvascular alterations in the kidneys of obese individuals, facilitating earlier intervention and potentially improving clinical outcomes.
Most cells in multicellular organisms release nanometer-sized extracellular vesicles (EVs), particularly under stress conditions, which can be characterized by their surface markers or cargo. Urinary EVs (uEVs) are released mostly by kidney and urinary tract cells and carry proteins, lipids, and RNAs reflective of the physiological and pathological states of their parent cells[7]. They have emerged as a promising non-invasive tool for assessing renal health, as their molecular content changes in response to inflammation, fibrosis, and endothelial dysfunction[8]. Previous studies have demonstrated that uEVs also contain specific microRNAs (miRNAs) and proteins that reflect podocyte injury, tubular cell alterations, and endothelial cell dysfunction in patients[9,10]. Hence, uEVs may serve as non-invasive biomarkers in kidney conditions affecting microvascular integrity. However, their ability to shed light on microvascular remodeling in obesity remains unclear.
In this study, we hypothesized that altered levels of PTC-derived uEVs, identified by CD31-/CD144-/PLVAP+ (plasmalemma vesicle-associated protein) markers[11,12], may distinguish obese patients with early kidney dysfunction from healthy individuals. We aimed to identify specific subsets of uEVs that bear markers reflecting microvascular inflammation and remodeling as indices of early renal microvascular disease in obesity.
METHODS
Patient selection
This study was approved by the Institutional Review Board of the Mayo Clinic (IRB18-005076) and informed, written consent was obtained from each patient. We prospectively enrolled 22 obese patients ≥ 18 years of age with body mass index (BMI) ≥ 30kg/m2 undergoing weight-loss surgery between October 2022 and November 2023. Exclusion criteria included serum creatinine > 2.5mg/dL, diabetes mellitus, recent cardiovascular events (myocardial infarction, stroke or congestive heart failure) within the past 6 months, pregnancy and kidney transplant.
The non-obese (‘lean’) group consisted of 11 healthy kidney donors with BMI ≤ 30kg/m2, matched to the obese group by age, who were undergoing live donor nephrectomy. Inclusion criteria were age 18-80 years, BMI ≤ 30kg/m2, and ability to provide informed consent. Exclusion criteria included pregnancy, chronic inflammatory diseases, active malignancy, recent stroke or myocardial infarction, solid organ transplant, use of immunosuppressive drugs (including prednisone > 10 mg/day), senolytic supplements, therapeutic anticoagulants, or inability to comply with the study protocol. All samples were collected prior to surgery.
For histological studies, we identified 20 obese and 17 non-obese living kidney donors who underwent an intraoperative biopsy of the renal cortex during transplant surgery. The formalin-fixed paraffin-embedded tissue specimens were cut into 5µm sections and stained with periodic acid-Schiff (PAS) and trichrome.
Humoral measurements
Blood samples from the antecubital vein and spot urine samples were collected and stored at -80 °C until analysis. Plasma interleukin (IL) levels, including IL-1α, IL-1β, and IL-18 levels were measured using Luminex (Cat#HCYTA-60K, Millipore, Burlington, MA) following the manufacturer’s protocol[10]. Urinary protein concentration was determined via the Bradford protein assay (Cat#23200, ThermoFisher, Waltham, MA). The following biomarkers were quantified via enzyme-linked immunosorbent assay (ELISA) using commercially available kits: urinary neutrophil gelatinase-associated lipocalin (NGAL; Cat#KIT 036, ThermoFisher), urinary kidney injury molecule-1 (KIM-1; Cat#DKM100, R&D, Minneapolis, MN), urinary tumor necrosis factor-alpha (TNF-α; Cat#RAB0476, Sigma-Aldrich), urinary monocyte chemoattractant protein-1 (MCP-1; Cat#DCP00, R&D Systems), serum insulin (Cat#RAB0327, Sigma-Aldrich, St. Louis, MO), plasma angiopoietin-2 (Cat#KHC1641, ThermoFisher), and plasma vascular endothelial growth factor-A (VEGF-A; Cat#KHG0111, ThermoFisher). All assays were performed according to the manufacturers' instructions. Serum creatinine and glucose levels were measured using standard procedures, with creatinine-based estimated glomerular filtration rate (eGFR) calculated by the chronic kidney disease epidemiology collaboration (CKD-EPI) formula[13].
EVs isolation and analysis
EVs were isolated from urine using Total Exosome Isolation reagent (Invitrogen, Waltham, MA) as previously described[10,11]. Urine samples were collected and stored at -80 °C under standardized pre-analytical conditions until analysis. Briefly, thawed urine samples (1,000 μL) were centrifuged at 2,000 g for 30 min at 4 °C to remove cells and debris. Supernatants (800 μL) were mixed with 1 volume of the Total Exosome Isolation reagent and incubated for 1h at room temperature. After incubation, samples were centrifuged at 10,000 g for 1 h at 4 °C. Pelleted exosomes were resuspended in EV buffer [2M sucrose and 500 mM 2-Morpholinoethanesulfonic Acid (MES) solution]. In accordance with the Minimal Information for Studies of Extracellular Vesicles 2018 (MISEV2018) guidelines, the isolated vesicles were further characterized for morphology by transmission electron microscopy (TEM), size by nanoparticle tracking analysis (NTA), and marker expression by flow cytometry. NTA was performed using a NanoSight NS300 instrument (Malvern Panalytical, Westborough, MA) with samples introduced at 50 μL/min. Six 30-s videos were recorded per sample, and particle size and concentration were analyzed using NTA software v3.4. For identification and specific marker detection, isolated EVs were then stained for 2 h at 37 °C with 0.5 mM Tag-it violet (TIV) (Biolegend, San Diego, CA) cell labeling solution, and with canonical EV surface marker antibodies against CD9 (Cat#312105), CD63 (Cat#353007), CD81 (Cat#349503, Biolegend), and a panel of cell-specific antibodies including PLVAP (Cat#NB100-77668, Novus, Centennial, CO), CD31 (Cat#14-0319-82, ThermoFisher), CD144 (Cat#NB600-1409, Novus), delta-like-ligand-4 (DLL4) (Cat#MA5-17069, ThermoFisher) and MCP-1(Cat#MA5-17040, ThermoFisher). EVs were quantified using a FlowSight (Amnis, Seattle, WA) imaging flow cytometry equipped with INSPIRE software, as previously described[10,11], acquiring at least 50,000 TIV+ events. EVs were characterized using flow-gating strategy including a first positive gate for TIV events followed by positive gate for PLVAP and positive or negative gate for the other antibodies [Figure 1 and Supplementary Figure 1], and expressed as a percentage of total uEVs. Flow cytometric analyses were performed blinded to group allocation. The levels of uEVs subsets were evaluated for relationship with renal parameters.
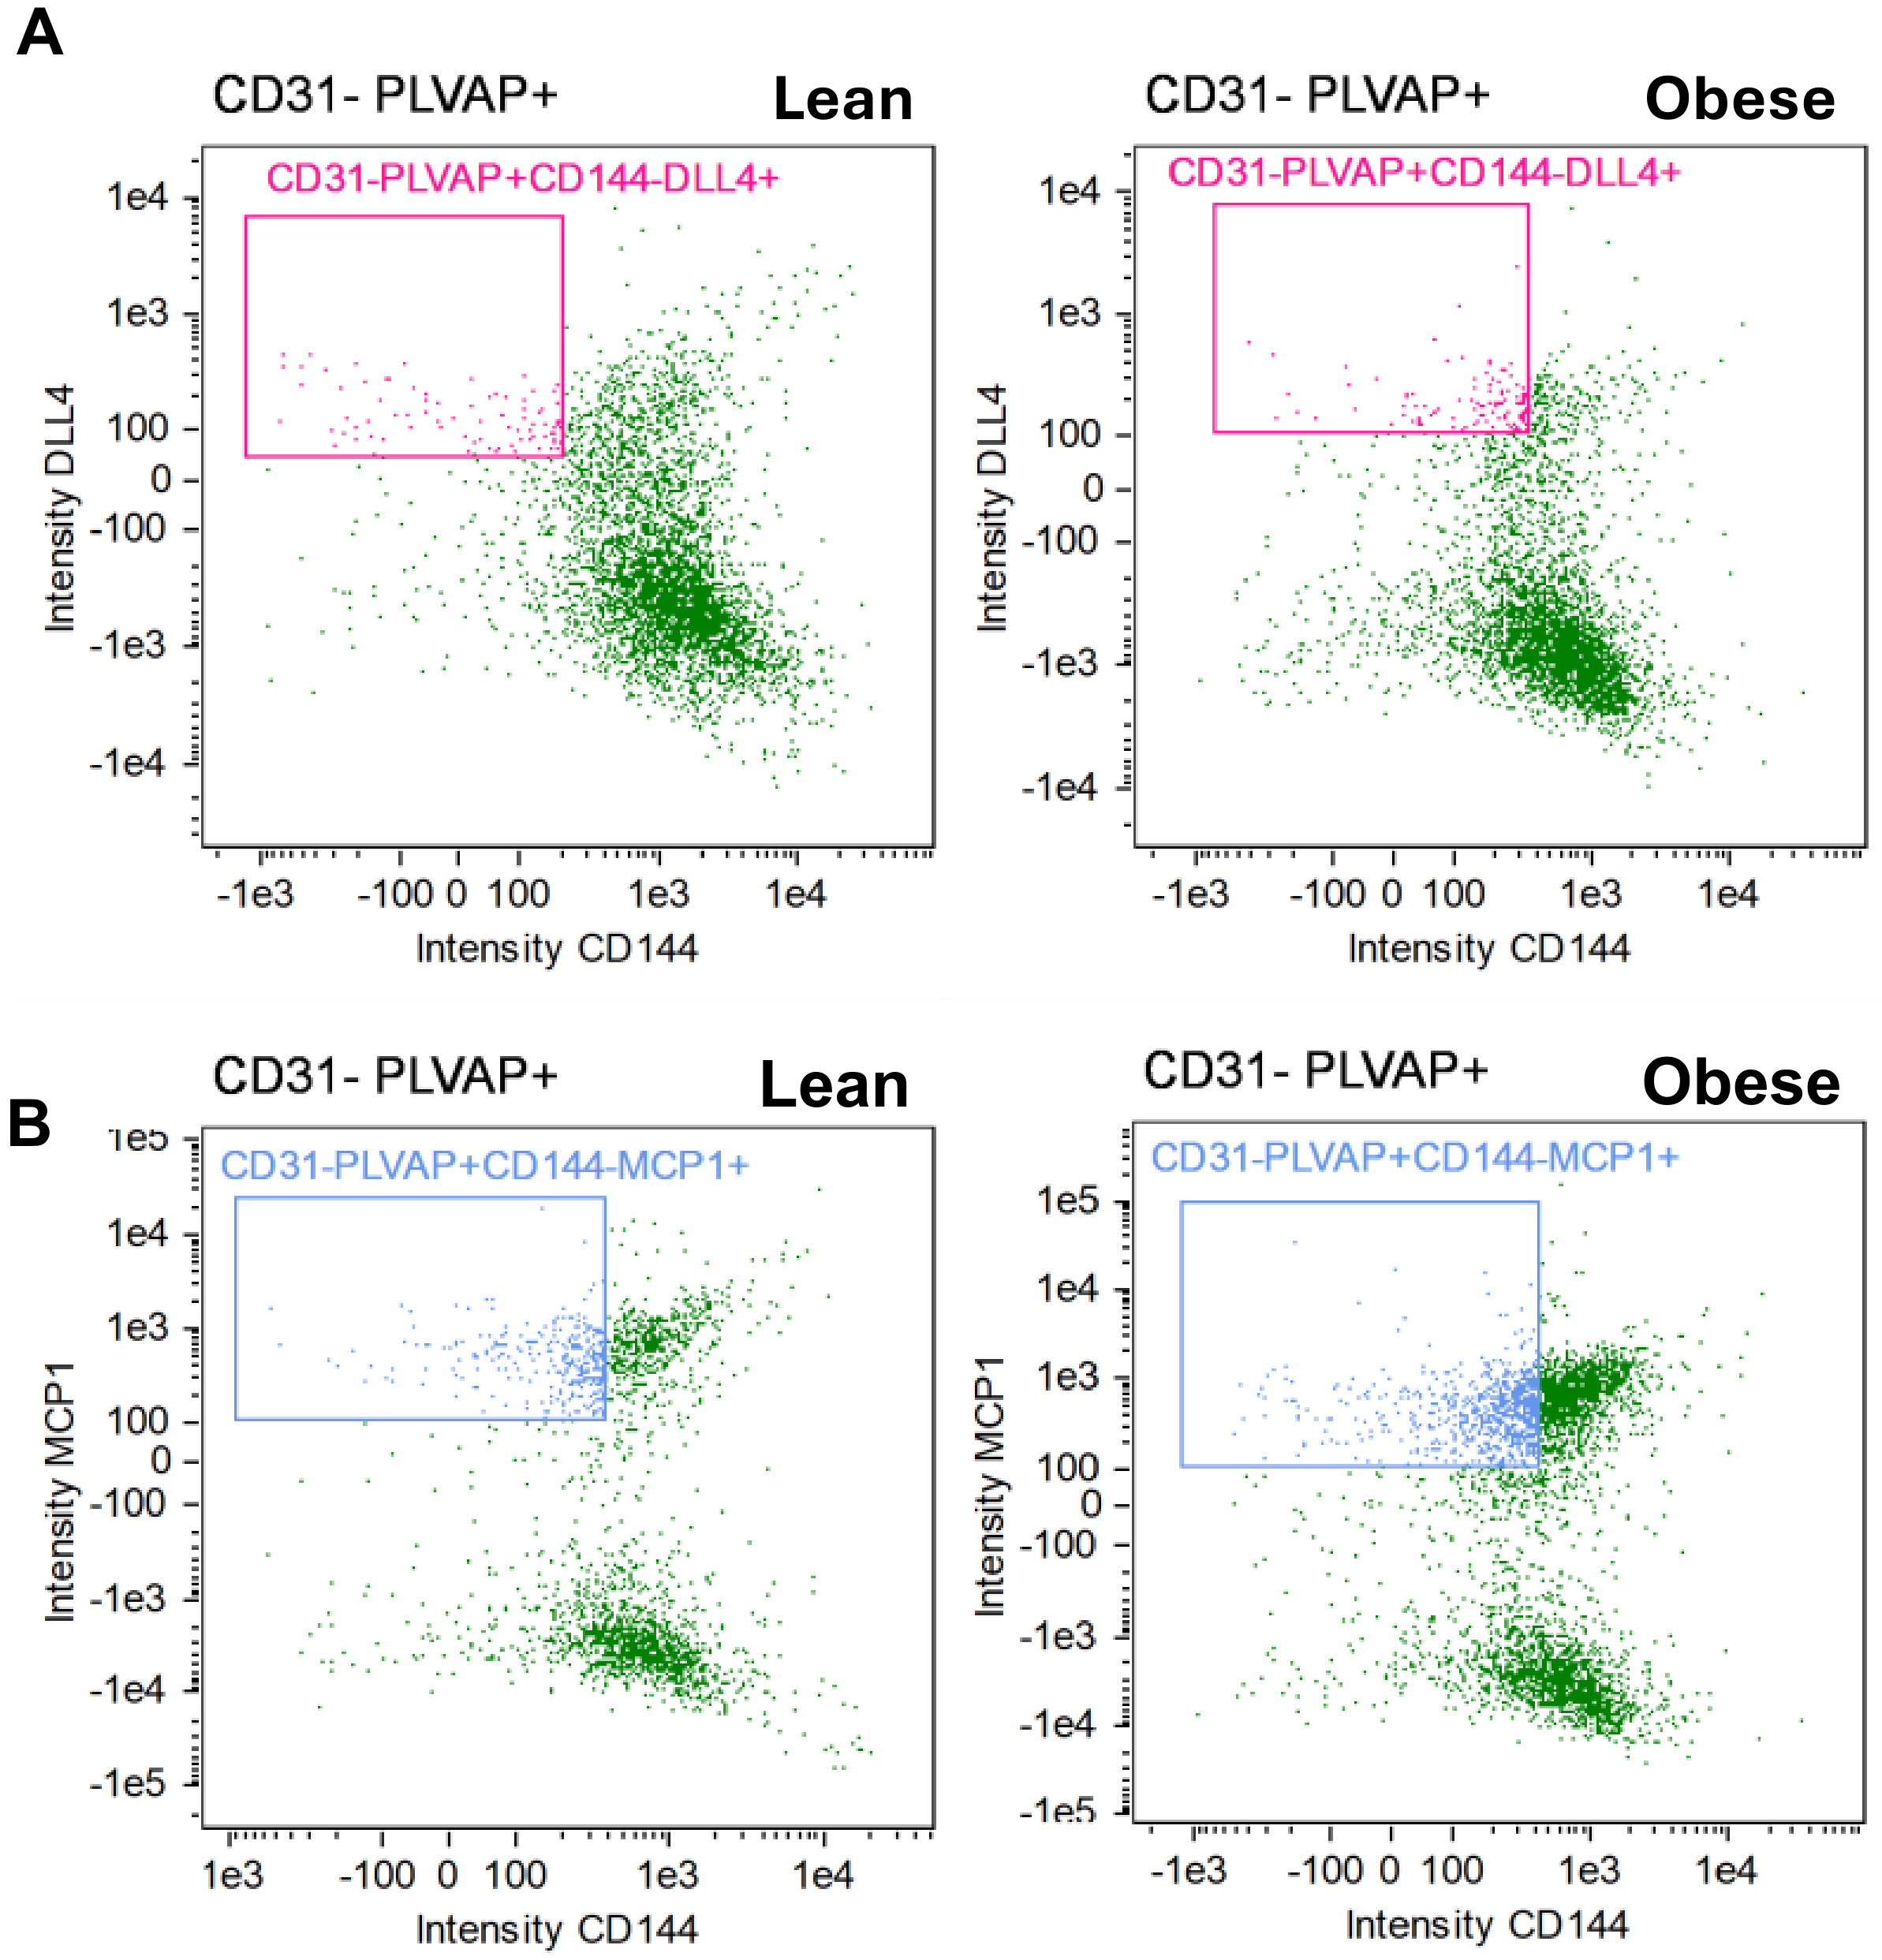
Figure 1. Flow Cytometric Strategy Demonstrating Identification of PTC-Derived uEV Subsets in Lean and Obese Individuals. The plots exhibit elevated levels of CD31-/PLVAP+/CD144-/DLL4+ (A) and CD31-/PLVAP+/CD144-/MCP-1+ (B) uEVs in obese relative to lean subjects. CD31: Cluster of differentiation 31; PLVAP: plasmalemma vesicle-associated protein; DLL4: delta-like-ligand-4; CD144: cluster of differentiation 144; MCP-1: monocyte chemoattractant protein-1; PTC: delta-like-ligand-4; uEV: urinary extracellular vesicle.
Histological analyses
Capillary density was assessed on PAS-stained sections by counting PTCs within five randomly selected 0.25mm2 fields at 400× magnification, and quantified per field. Histological assessments were performed blinded to clinical group allocation. Capillaries were identified by the presence of a lumen, red blood cells, and/or an endothelial lining[11]. Capillary density measurements typically demonstrate excellent intra-observer reliability, with intraclass correlation coefficients (ICC) between 0.88-0.95 and Cohen’s κ values within the 0.60-0.80 range. Inter-observer reliability is also strong (ICC 0.80-0.90), with moderate to large agreement (Cohen’s κ 0.40-0.80) due to borderline structures and differences in image quality[14,15].
Non-sclerotic (NSG) and globally-sclerotic (GSG) glomeruli were counted on PAS-stained sections, with glomeruli at the section edge counted as half. NSG volume was calculated from the profile area using stereologic models, allowing estimation of NSG density within the cortex[16]. Mean tubular area was measured by placing five consecutive 0.2mm2 circular regions along the cortex, manually outlining only tubules within these circles[17]. Cortical area per NSG (the inverse of NSG) describes how much cortical parenchyma is supported per intact glomeruli, with a larger value indicating reduced viable nephron density, which is linked to vascular integrity[18]. To assess the cortical area per NSG, the entire cortical region on PAS-stained sections was measured and divided by the NSG count, enabling evaluation of glomerular density relative to cortical size, which may reveal early structural adaptations to obesity-related renal stress.
Statistical analyses
Data were analyzed using Prism version 10.0.0 (GraphPad, Boston, MA). Normally distributed data were expressed as mean ± standard deviation (SD) and non-normally distributed data as median (range). Comparisons between two groups were performed using unpaired two-tailed t-test (or the Wilcoxon rank-sum test for skewed data). Spearman rank correlation analysis was used to test for association between uEVs and other variables. A post hoc power analysis was performed using G*Power 3.1.9.7 based on the observed effect sizes of the main uEV subsets. P-values < 0.05 were considered statistically significant.
RESULTS
Metabolic and renal function in lean and obese subjects
Key metabolic and renal parameters in lean and obese individuals are shown in Table 1. Obese individuals had a markedly higher BMI (P < 0.001), serum glucose (P < 0.05), and insulin levels (P < 0.01) compared to lean subjects, indicating increased adiposity and insulin resistance. Nevertheless, serum creatinine levels and eGFR were not significantly different between the groups, indicating preserved kidney function in the obese individuals. Similarly, blood pressure showed no significant differences between the groups.
Demographics of patients in the urinary extracellular vesicles (uEVs) study
| Parameter | Lean-1 | Obese-1 |
| Gender(M/F) | 4/7 | 7/15 |
| Age (yrs) | 46.82 ± 15.13 | 46.81 ± 14.70 |
| Body mass index (Kg/m2) | 25.32 ± 1.68 | 43.92 (31.00, 58.50) *** |
| Systolic blood pressure (mmHg) | 112.45 ± 8.78 | 120.67 ± 11.68 |
| Diastolic blood Pressure (mmHg) | 71.64 ± 8.62 | 71.55 ± 11.73 |
| Mean arterial pressure (mmHg) | 85.24 ± 7.83 | 87.92 ± 9.80 |
| Glucose (mg/dL) | 99.91 ± 7.52 | 106.41 ± 19.45 * |
| Serum Insulin (mU/ L) | 4.52 (2.06, 24.83) | 13.84 (2.66, 50.22) ** |
| Serum creatinine (mg/dl) | 0.87 ± 0.16 | 0.79 (0.60, 3.90) |
| eGFR(ml/min/1.73m2) | 90.27 ± 9.21 | 97.10 ± 15.61 |
| Plasma IL-1α (pg/mL) | 23.97 ± 10.91 | 15.85 (6.09, 100.16) |
| Plasma IL-1β (pg/mL) | 56.12 ± 20.83 | 40.27 (13.62, 140.99) |
| Plasma IL-18 (pg/mL) | 50.80 ± 32.79 | 40.09 (18.70, 92.76) |
| Plasma Angiopoietin-2 (pg/mL) | 328.50 ± 126.26 | 339.76 ± 105.44 |
| Plasma VEGF-A (pg/mL) | 71.15 (30.42, 396.56) | 101.51 (27.16, 647.47) |
| Urinary protein (µg/mL) | 26.97 ± 18.02 | 65.91 (9.38, 188.56) * |
| Urinary KIM-1 (ng/mL) | 0.43 (0.10, 2.41) | 0.78 (0.15, 5.07) |
| Urinary MCP-1 (pg/mL) | 132.58 ± 121.18 | 211.37 ± 181.68 * |
| Urinary NGAL (ng/mL) | 11.39 (1.15, 145.06) | 21.37 (0.89, 353.58) |
| Urinary TNF-α (pg/mL) | 38.88 (22.17, 203.09) | 99.56 (13.12, 817.78) |
Urinary protein levels were only slightly elevated in the obese group, indicating that glomerular changes were subtle. However, urinary MCP-1 level (but not other markers) was elevated in obese individuals, reflecting increased inflammatory activity in the renal microenvironment.
Increased angiogenic and inflammatory PTC-derived uEVs in obese individuals
The isolated uEVs were verified to meet MISEV2018 criteria for morphology, size, and marker expression [Supplementary Figure 2A-C]. TEM revealed vesicles with a round or cup-shaped morphology and diameters consistent with exosomes. Flow cytometry confirmed strong surface expression of canonical EV markers CD9, CD63, and CD81. Compared to lean individuals, obese individuals did not significantly differ in the concentration or size of total uEVs. Nevertheless, the fraction of CD31-/PLVAP+/CD144- uEVs was significantly elevated in the obese group [Table 2], suggesting increased overall shedding of PTC-derived uEVs. Additionally, the fraction of CD31-/PLVAP+/CD144-/DLL4+ uEVs was elevated in the obese group [Table 2, Figure 1A and 2A], suggesting heightened angiogenic activity in their renal microcirculation. Similarly, CD31-/PLVAP+/CD144-/MCP-1+ uEVs were more abundant in the obese than in the lean group [Table 2, Figure 1B and 3A], indicating increased inflammation in their parent endothelial cells. Furthermore, uEVs co-expressing both angiogenic and inflammatory markers (CD31-/PLVAP+/CD144-/DLL4+/MCP-1+) were also more frequent in obese individuals [Table 2 and Figure 4A].
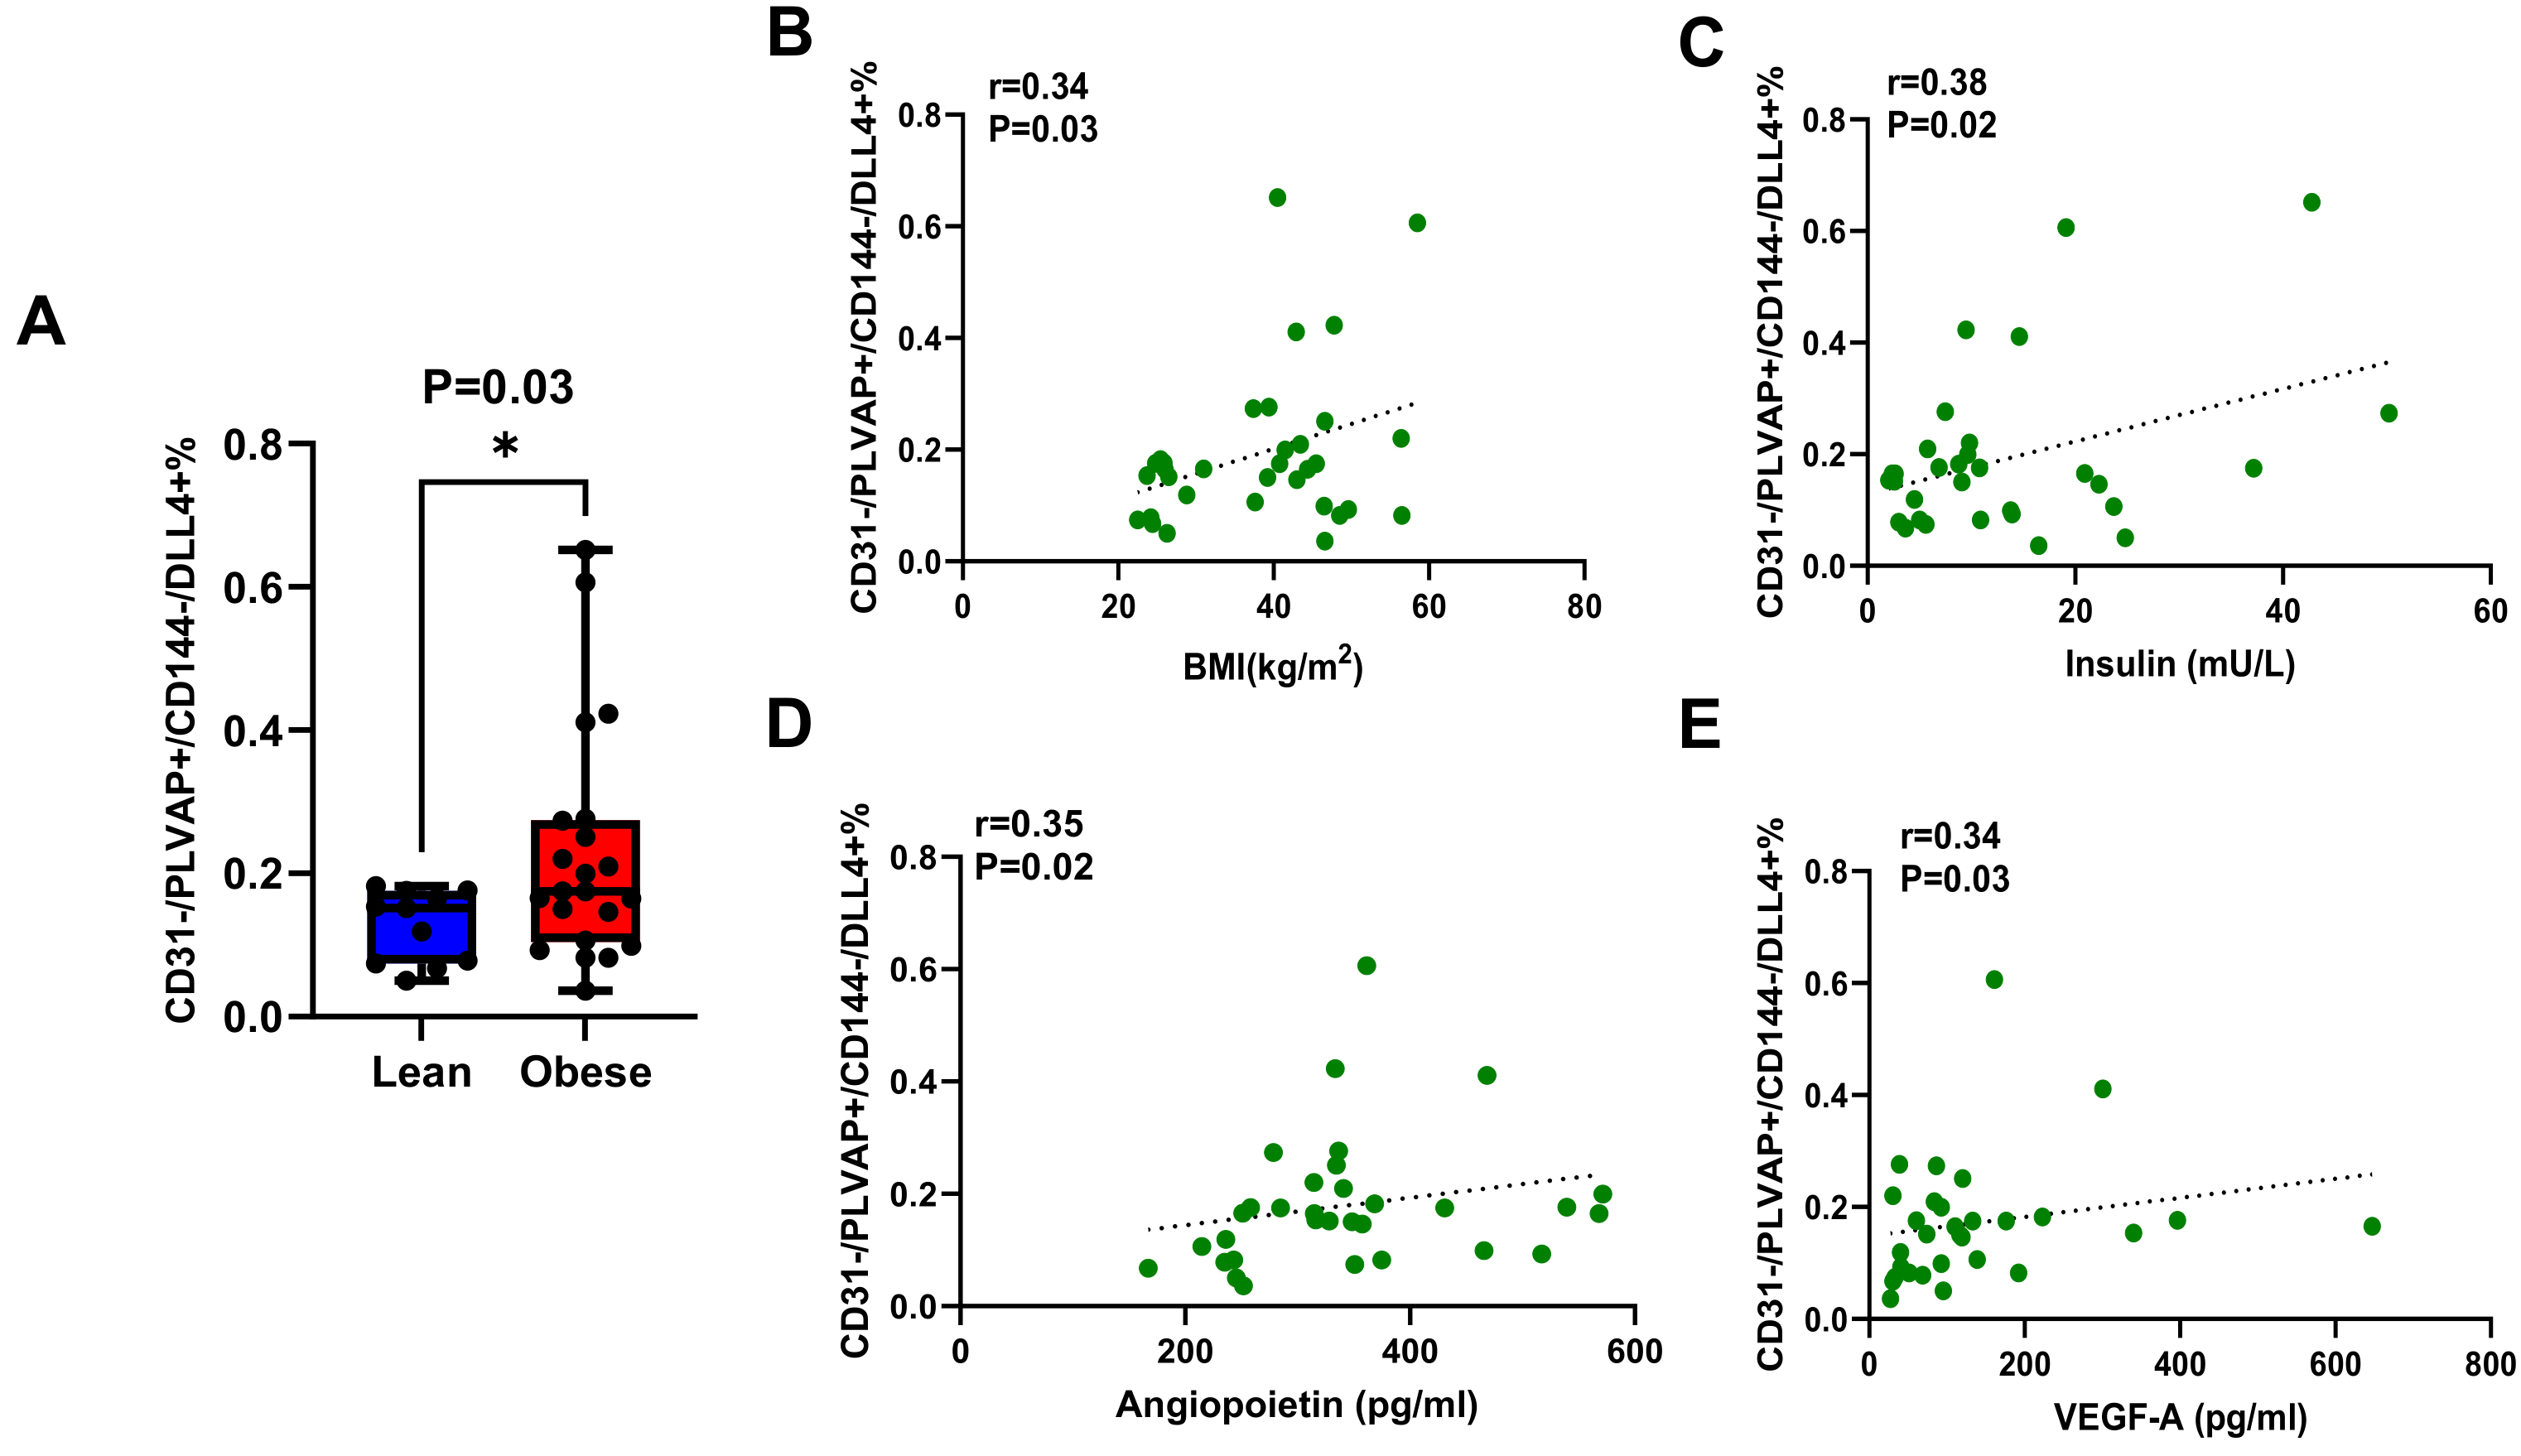
Figure 2. Characterization of CD31-/PLVAP+/CD144-/DLL4+ uEVs in Lean and Obese Individuals. (A) The CD31-/PLVAP+/CD144-/DLL4+ uEVs fractions were elevated in obese vs. lean individuals, *P < 0.05, t-test; (B-E) Correlations between CD31-/PLVAP+/CD144-/DLL4+ uEV levels and BMI, insulin, angiopoietin-2, and VEGF-A, respectively. CD31: Cluster of differentiation 31; PLVAP: plasmalemma vesicle-associated protein; CD144: cluster of differentiation 144; DLL4: delta-like-ligand-4; VEGF-A: vascular endothelial growth factor-A; uEV: urinary extracellular vesicle; BMI: body mass index.
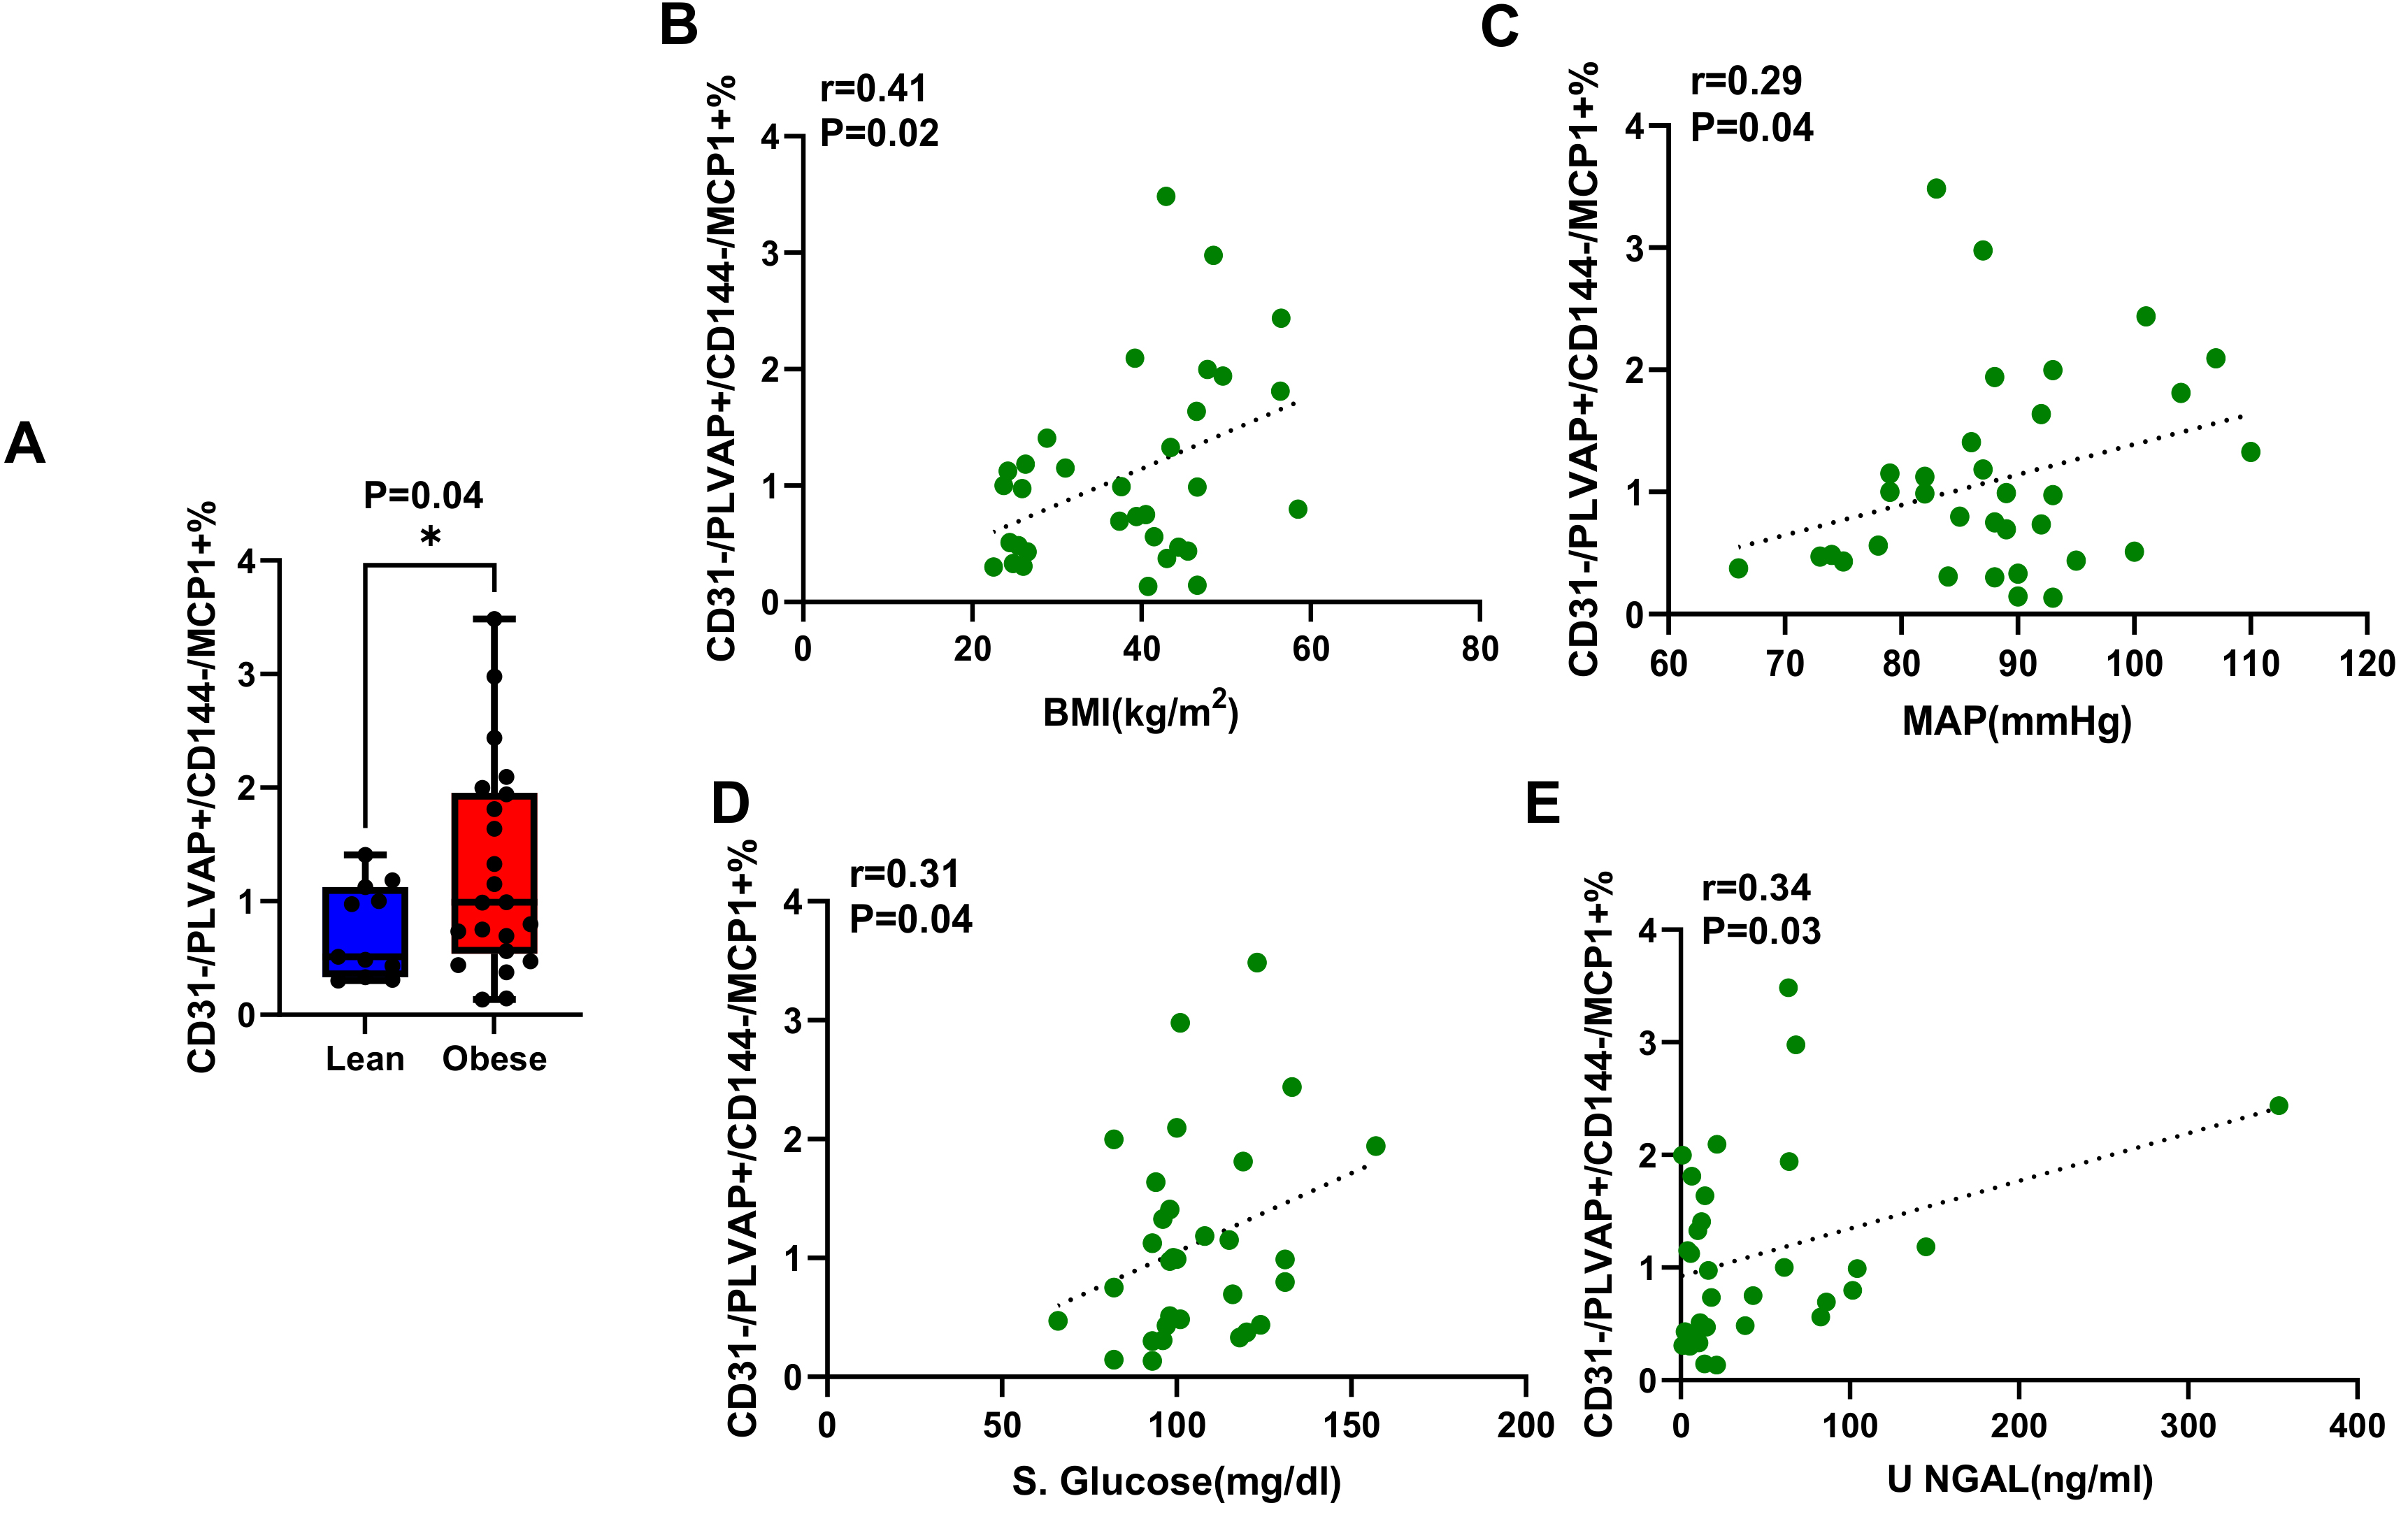
Figure 3. Characterization of CD31-/PLVAP+/CD144-/MCP-1+ uEVs in Lean and Obese Individuals. (A) Levels of CD31-/PLVAP+/CD144-/MCP-1+ uEVs fractions were elevated in obese vs. lean individuals, *P < 0.05, t-test; (B-E) Correlations of CD31-/PLVAP+/CD144-/MCP-1+ uEV levels with BMI, MAP, blood glucose, and urinary NGAL, respectively. CD31: Cluster of differentiation 31; PLVAP: plasmalemma vesicle-associated protein; CD144: cluster of differentiation 144; MCP-1: monocyte chemoattractant protein-1; uEV: urinary extracellular vesicle; BMI: body mass index; MAP: mean arterial pressure; NGAL: neutrophil gelatinase-associated lipocalin.
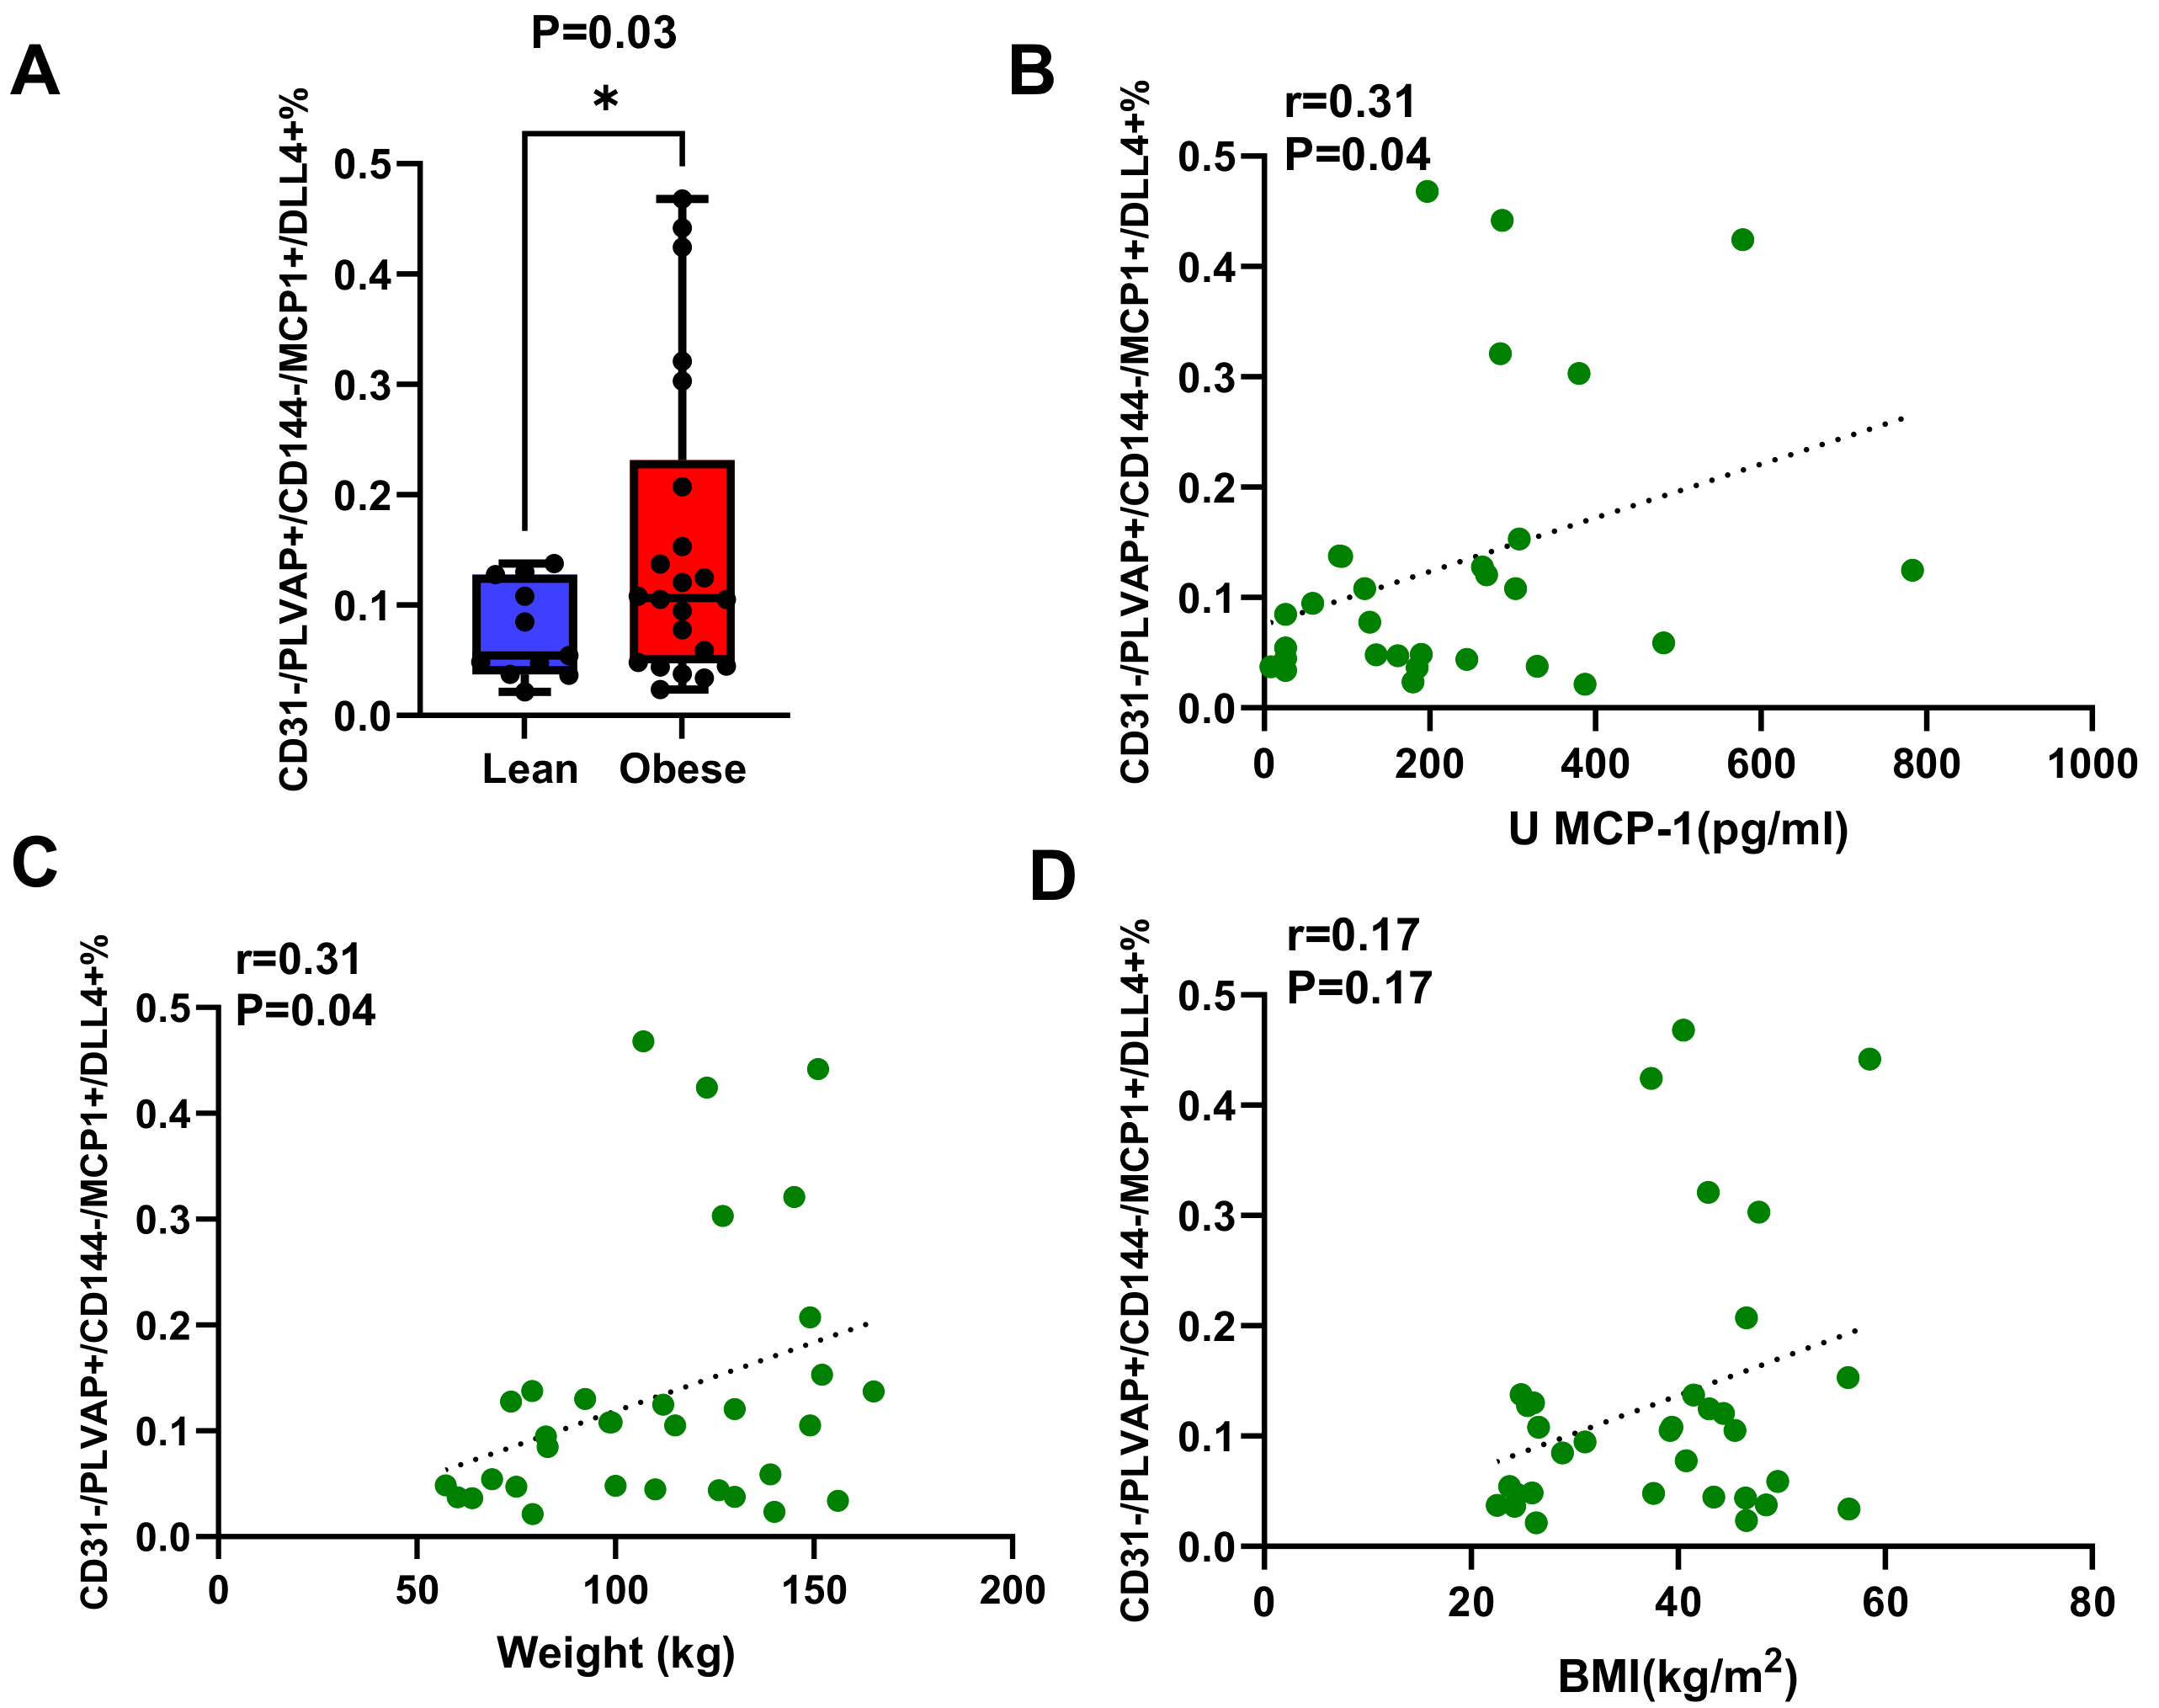
Figure 4. Combined Inflammatory and Angiogenic Signaling in PTC-Derived uEVs. CD31-/PLVAP+/CD144-/DLL4+/MCP-1+ uEV levels are elevated in the obese compared to lean subjects, * P < 0.05, t-test. (A). Direct correlations were observed between CD31-/PLVAP+/CD144-/DLL4+/MCP-1+ uEV and urinary MCP-1 levels (B) and body weight (C); but not with BMI (D). CD31: cluster of differentiation 31; PLVAP: plasmalemma vesicle-associated protein; CD144: cluster of differentiation 144; MCP-1: monocyte chemoattractant protein-1; DLL4: delta-like-ligand-4; BMI: body mass index; PTC: peritubular capillary; uEV: urinary extracellular vesicle.
Characteristics of uEVs (mean ± SD) in lean and obese individuals
| Parameter | Lean | Obese |
| Concentration (× 109) | 1.29 ± 1.15 | 1.73 ± 1.87 |
| Size (nm) | 141.14 ± 32.10 | 139.99 ± 32.97 |
| Fraction of subgroups (%) | ||
| CD31-/PLVAP+/CD144- | 2.53 ± 0.28 | 3.36 ± 0.12* |
| CD31-/PLVAP+/CD144-/DLL4+ | 0.13 ± 0.01 | 0.23 ± 0.04* |
| CD31-/PLVAP+/CD144-/MCP1+ | 0.73 ± 0.12 | 1.37 ± 0.16* |
| CD31-/PLVAP+/CD144-/MCP1+/DLL4+ | 0.08 ± 0.01 | 0.14 ± 0.03* |
The calculated effect sizes (Cohen’s d) for the fractions of CD31-/PLVAP+/CD144-/DLL4+, CD31-/PLVAP+/CD144-/MCP-1+, and CD31-/PLVAP+/CD144-/DLL4+/MCP-1+ uEVs were 1.81, 1.65, and 2.03, respectively, corresponding to powers greater than 0.95 at α=0.05. These results indicate that the study was sufficiently powered to detect the principal between-group differences.
Correlation of CD31-/PLVAP+/CD144-/DLL4+ uEVs with clinical parameters
The percentage of CD31-/PLVAP+/CD144-/DLL4+ uEVs showed a direct correlation with BMI (Figure 2B, r = 0.34, P = 0.03) and insulin levels (Figure 2C, r = 0.38, P = 0.02), linking elevated BMI and insulin resistance to increased release of angiogenic uEVs.
Additionally, significant direct correlations were observed between CD31-/PLVAP+/CD144-/DLL4+ uEVs and plasma angiopoietin levels Figure 2D, r = 0.35, P = 0.02), which is involved in vascular remodeling and stabilization, as well as with plasma VEGF-A levels (Figure 2E, r = 0.34, P = 0.03), further supporting a role for these uEVs in early microvascular adaptations in response to metabolic stress.
In contrast, no significant correlations were observed between CD31-/PLVAP+/CD144-/DLL4+ uEVs and eGFR or serum creatinine levels [Supplementary Figure 3A and B] suggesting that these uEV levels may reflect early vascular changes that are dissociated from overt changes in renal filtration function.
Correlation of CD31-/PLVAP+/CD144-/MCP-1+ uEVs with clinical parameters
The fractions of CD31-/PLVAP+/CD144-/MCP-1+ uEVs showed significant positive correlations with several clinical parameters associated with metabolic and inflammatory stress. Specifically, these uEV fractions were directly correlated with BMI (Figure 3B, r = 0.41, P = 0.02), mean arterial pressure (MAP) (Figure 3C, r = 0.29, P = 0.04), and blood glucose levels (Figure 3D, r = 0.31, P =0.04), suggesting that higher BMI, elevated blood pressure, and hyperglycemia are linked to increased levels of inflammatory uEVs. Furthermore, although urinary NGAL levels were unchanged [Table 1], they directly correlated with CD31-/PLVAP+/CD144-/MCP-1+ uEVs (Figure 3E, r = 0.34, P =0.03), suggesting that elevated uEV levels may be associated with subclinical renal injury in obese individuals. A trend for an inverse correlation with serum creatinine was also noted [Supplementary Figure 3C], but did not reach statistical significance.
The correlation of CD31-/PLVAP+/CD144-/DLL4+/MCP-1+ uEVs with inflammatory and metabolic markers
The fractions of CD31-/PLVAP+/CD144-/DLL4+/MCP-1+ double-positive uEVs showed significant direct correlations with urinary MCP-1 levels (Figure 4B, r = 0.31, P = 0.04) and body weight (Figure 4C, r = 0.31, P = 0.04), although not with BMI (Figure 4D, r = 0.17, P = 0.17). Hence, this uEV subset may be primarily linked to increased kidney inflammation in obesity.
Morphometric changes in kidneys of obese individuals
The subjects included in the kidney morphometric measurements [Table 3] were comparable to the lean and obese groups included in the uEV studies. BMI and blood glucose levels were significantly higher in the obese vs. the lean group, whereas blood pressure, serum creatinine levels, and eGFR remained similar between the groups, indicating preserved renal function in the obese individuals.
Demographics of patients in the histological study
| Parameter | Lean-2 | Obese-2 |
| Gender (M/F) | 7/10 | 7/13 |
| Body mass index (kg/m2) | 24.28 ± 0.50 | 39.94 ± 1.80*** |
| Systolic blood pressure (mmHg) | 120.12 ± 6.83 | 121.50 ± 8.84 |
| Diastolic blood pressure (mmHg) | 75.18 ± 6.71 | 71.94 ± 6.05 |
| Mean arterial pressure (mmHg) | 105.14 ± 6.30 | 104.98 ± 7.10 |
| Serum creatinine (mg/dL) | 0.88 ± 0.13 | 0.86 ± 0.12 |
| eGFR(ml/min/1.73m2) | 104.01 ± 13.70 | 108.56 ± 13.60 |
| Glucose (mg/dL) | 92.12 ± 5.83 | 100.29 ± 10.01** |
| NSG Volume × 103 (µm3) | 2.37 ± 0.75 | 3.18 ± 0.89** |
| Cortex per NSG × 10-3 | 51.72 ± 17.88 | 61.88 ± 16.05 |
| Mean tubular area | 3851.27 (2030.72, 6776.36) | 4352.57 (3152.21, 6798.44) * |
| PTC density (number/mm2) | 408.22 ± 61.39 | 528.05 ± 119.66* |
| PTC/numbers of tubules | 1.24 ± 0.35 | 2.11 ± 0.45* |
Obese individuals exhibited larger NSG volumes compared to the non-obese group [Table 3, Figure 5A and B], consistent with glomerular hypertrophy. Contrarily, GSG were very rare in both groups. Similarly, the mean tubular area was greater in the obese compared to the non-obese group, further indicating structural adaptations of the kidney to obesity.
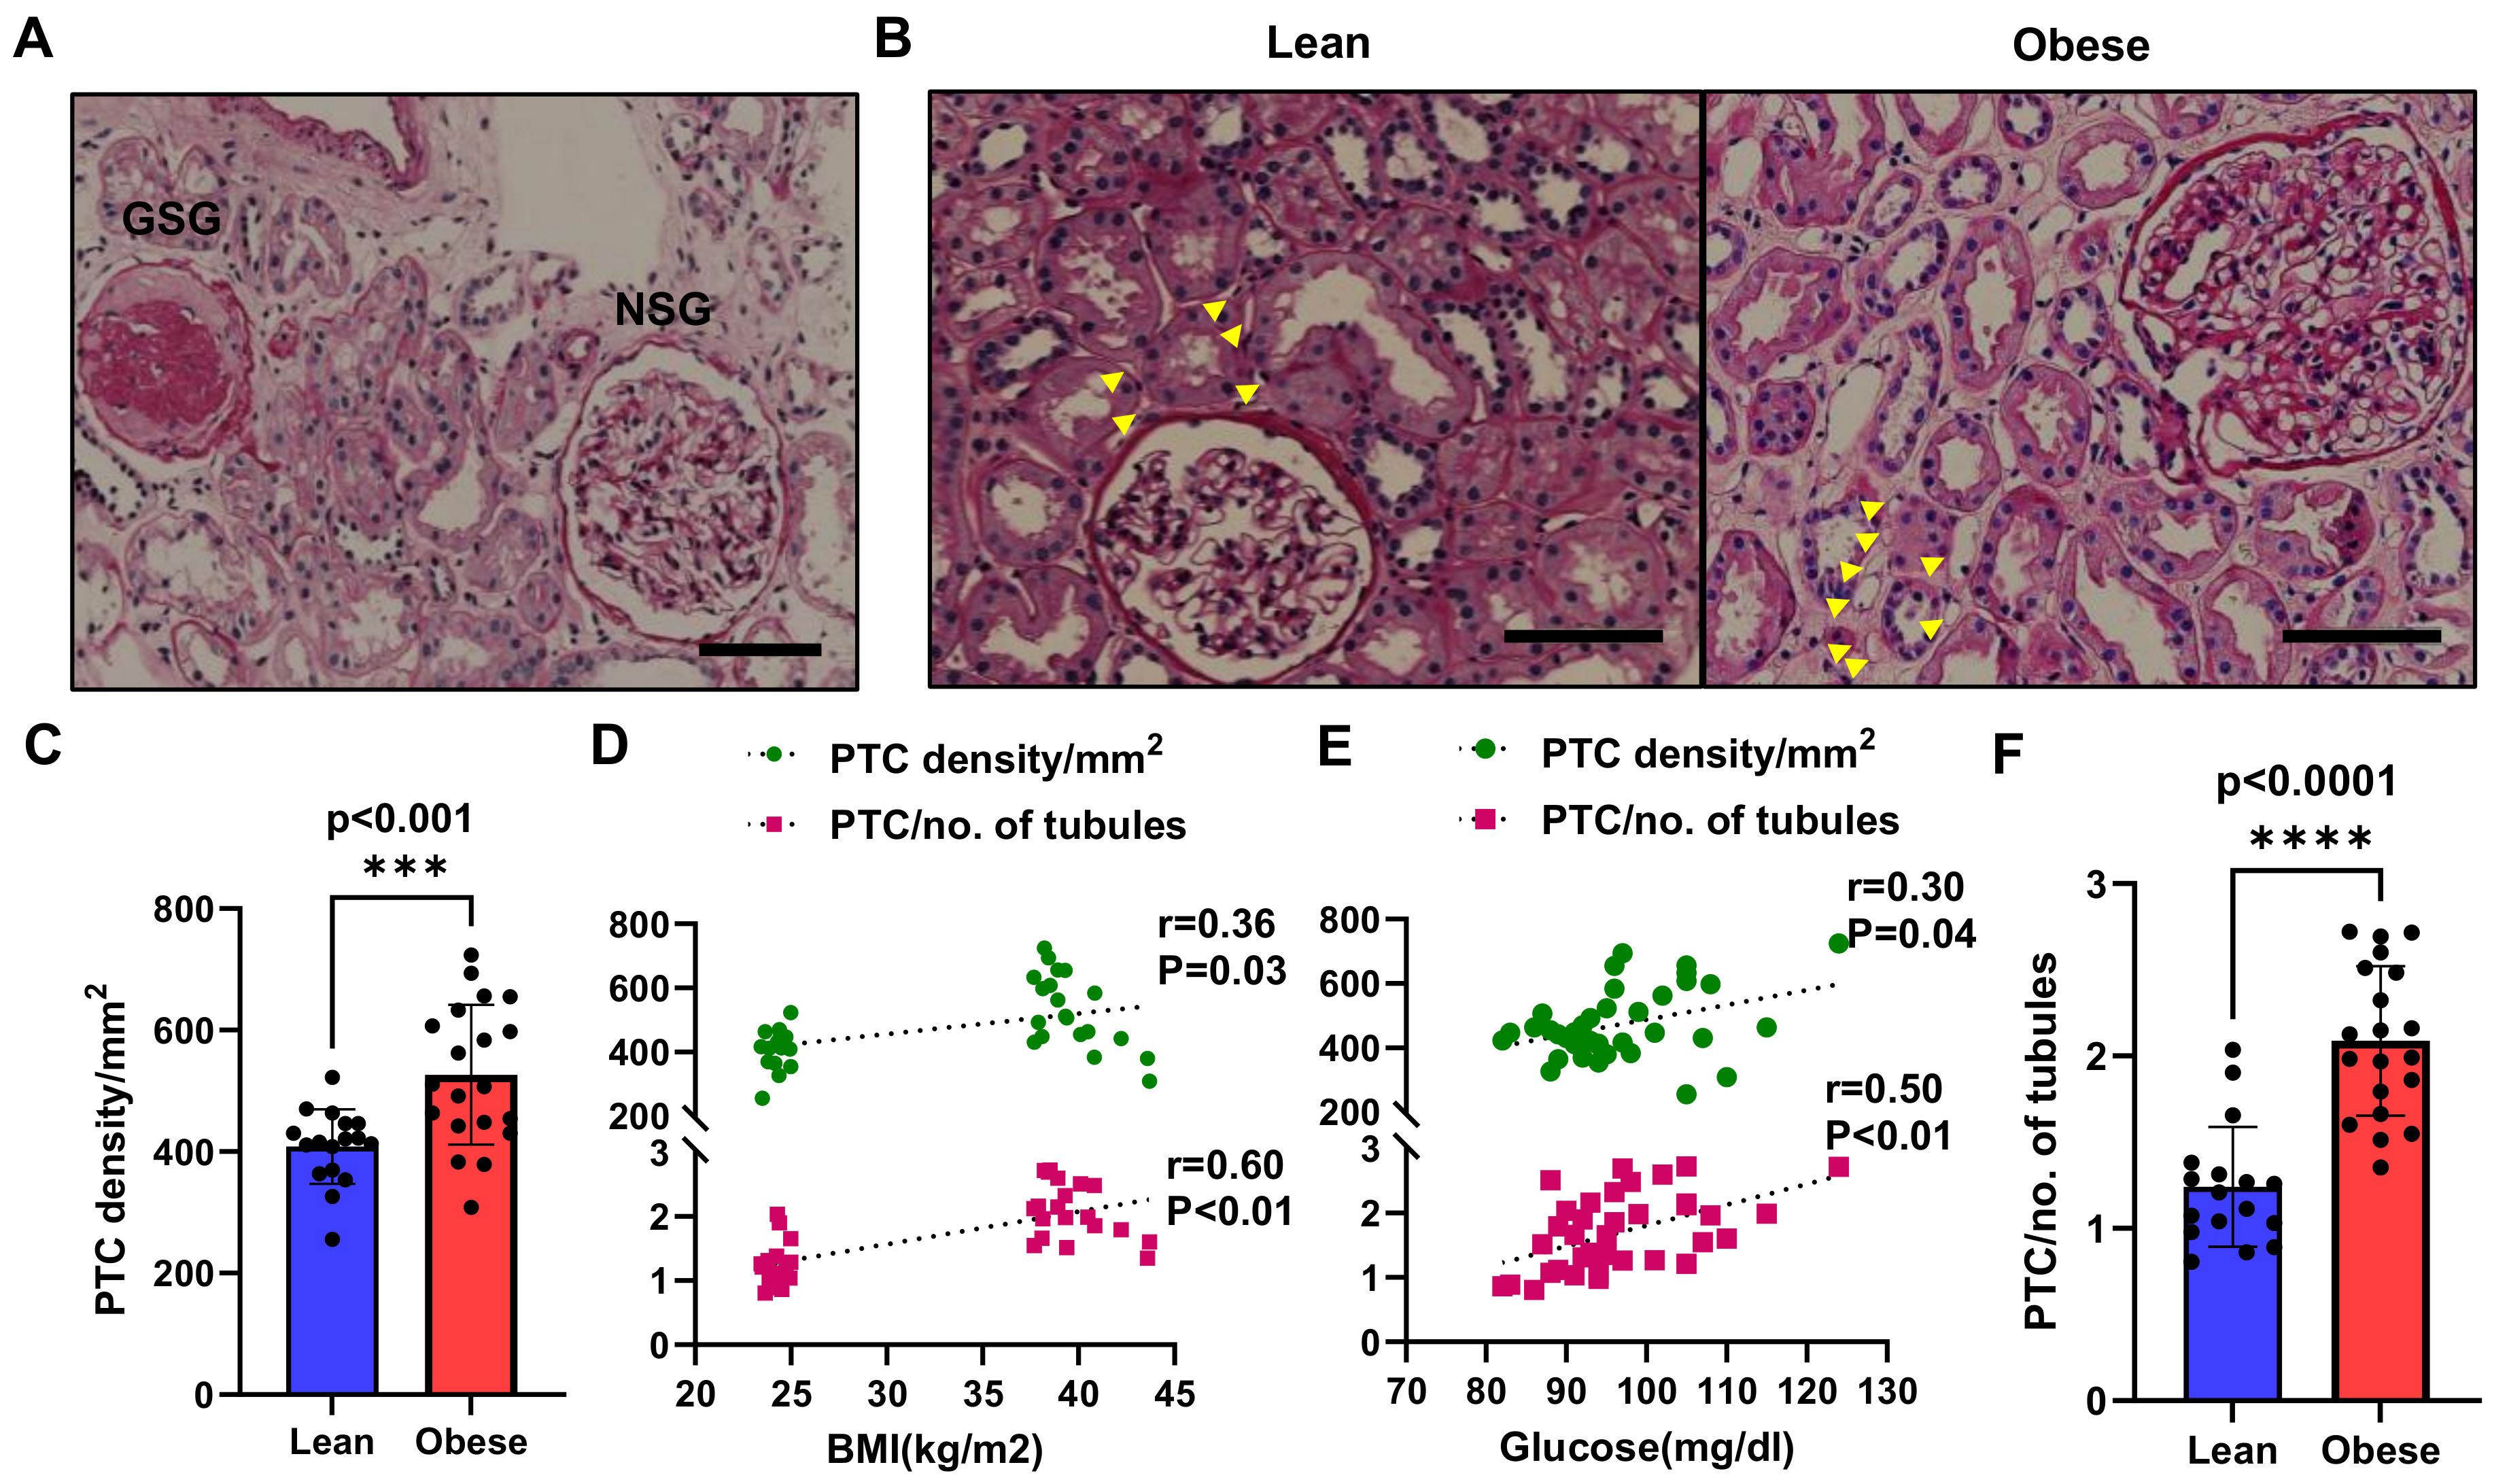
Figure 5. Kidney Morphology in ‘Lean’ and Obese Individuals. (A) Representative kidney sections displaying NSG and GSG glomeruli; (B) Representative kidney sections from Lean and Obese patients showing glomeruli and tubules, with yellow arrows indicating PTC; (C and D) PTC density and PTC-to-tubule ratio were significantly higher in the obese vs. lean group, ***P < 0.001, ****P < 0.0001, t-test, error bars represent Standard Deviation. (E and F) Direct correlation of PTC density and PTC-to-tubule ratio with BMI and glucose, suggesting a relationship with metabolic load. Black scale bars represent 100µm. NSG: Non-sclerotic; GSG: globally-sclerotic; PTC: peritubular capillary; BMI: body mass index.
PTC density (number/mm2) was significantly higher in the obese group (Figure 5C, P < 0.001), suggesting renal capillary proliferation. The PTC-to-tubule ratio was also elevated in the obese group (Figure 5D, P < 0.0001). PTC density directly correlated with BMI (Figure 5E, r = 0.36, P = 0.03) and glucose levels (Figure 5F, r = 0.50, P < 0.01), but not with serum creatinine levels (Supplementary Figure 4A, r = -0.07, P = 0.67) or eGFR (Supplementary Figure 4B, r = -0.13, P = 0.46). Similarly, the PTC-to-tubule ratio positively correlated with BMI (Figure 5E, r = 0.60, P < 0.01) and glucose (Figure 5F, r = 0.50, P < 0.01), but not with serum creatinine (Supplementary Figure 4A, r = -0.09, P = 0.59) or eGFR (Supplementary Figure 4B, r = -0.03, P = 0.86).
DISCUSSION
Our study provides noteworthy insights into the early microvascular alterations in obesity, evidenced by increased angiogenic and inflammatory activity in PTC-derived endothelial cells, occurring in the kidneys of obese individuals with relatively preserved renal function. The identification of specific uEVs, particularly those expressing angiogenic (DLL4+) and inflammatory (MCP-1+) markers, lends support to their potential role as early, non-invasive biomarkers for renal microvascular injury in obesity preceding an overt fall in kidney filtration function. Furthermore, these findings may support future directions for development of strategies to preserve the intra-renal microcirculation in patients with obesity.
We previously observed renal microvascular proliferation in experimental hypercholesterolemia, possibly secondary to kidney inflammation[4,5]. Notably, microvascular proliferation is also observed in the myocardial microcirculation and coronary vasa vasorum in early atherosclerosis, portraying microvascular proliferation as a universal early compensatory response to a noxious milieu[19,20]. However, newly formed immature microvessels are fragile (thin-walled, poorly formed, and hyperpermeable) and thus prone to regression[21], leading to microvascular loss that ultimately characterizes overt CKD. Hence, this cohort with obesity and a relatively preserved renal function, possibly transitioning from a hyperfiltration phase towards a decline in renal function, exhibits an early manifestation of renal microvascular remodeling that might permit detection of intrarenal changes. In this context, the observed increase in PTC-derived uEVs in the obese group may reflect early endothelial activation and microvascular remodeling in response to metabolic and inflammatory stress. Notably, although PTC do not face the urinary space, their EVs likely reach the urine through tubular cells. Previous studies suggested that the kidney can eliminate circulating EVs partly via PTC passage followed by tubular epithelial cell uptake and secretion into the urine[7,8,22], and a similar mechanism may be involved in excretion of PTC-EV. EVs mediate PTC-tubular cell crosstalk[23], as circulating EVs translocate from PTC through tubular basement membranes, are taken up via endocytosis[24], and released into the interstitium and tubular lumen.
The elevated levels of CD31-/PLVAP+/CD144-/DLL4+ uEVs in obese individuals suggest activation of PTC angiogenic pathways. DLL4, a key regulator of angiogenesis, controls the balance between endothelial cell proliferation and vascular maturation[25]. In the context of angiogenesis, DLL4-Notch signaling controls sprouting by restricting the excessive formation of new endothelial sprouts, thereby maintaining vascular stability[26]. Its upregulation in obesity may reflect a compensatory response to increased metabolic demands that might be partly mediated by obesity-induced renal inflammation. The amplified angiogenic signaling observed in obese individuals might also aim to support the expansion of the renal tubules that we observed or compensate for hypoxic conditions caused by microvascular injury or dysfunction[27]. Consistent with this, CD31-/PLVAP+/CD144-/DLL4+ uEV levels correlated with both VEGF-A and angiopoietin levels, further linking these uEVs to renal microvascular remodeling in obesity.
Furthermore, the significant increase in CD31-/PLVAP+/CD144-/MCP-1+ uEVs in obese individuals highlights the inflammatory state within the renal microvasculature. MCP-1 is involved in recruiting immune cells to sites of tissue injury[28], and its elevated expression in uEVs from obese individuals suggests PTC endothelial cell inflammation, potentially contributing to endothelial dysfunction and PTC damage[29]. The putative involvement of inflammation in renal microvascular remodeling is underscored by the elevated levels of MCP-1 both in the urine and on the surface of PTC-derived uEVs of patients with obesity.
The concurrent DLL4+/MCP-1+ expression in a subset of PTC-derived uEVs further supports the link between angiogenic and inflammatory dysregulation within the renal microcirculation in obesity. DLL4-mediated Notch signaling plays a central role in endothelial activation and angiogenic sprouting, and has been shown to regulate proinflammatory cytokine expression, including MCP-1[30,31]. Thus, the observed DLL4+/MCP-1+ PTC-derived uEVs may reflect a coordinated activation of these angiogenic and inflammatory pathways. This dual response could exacerbate microvascular injury and contribute to renal damage progression in obesity-related kidney disease. Overall, the increased levels of PTC-derived uEVs expressing DLL4+, MCP-1+, and DLL4+/MCP-1+ in obese individuals are consistent with early microvascular alterations in the kidney, even in the absence of overt clinical signs of kidney dysfunction, such as reduced eGFR or elevated serum creatinine. The direct correlation between body weight or BMI and uEVs carrying angiogenic and inflammatory markers reinforces the notion that obesity triggers microvascular insult in the kidneys. Increased adiposity leads to hemodynamic changes, including higher intraglomerular pressure and chronic low-grade inflammation, key drivers of microvascular remodeling[32,33].
Another important observation in our study is the increased glomerular and tubular hypertrophy in our obese patients with preserved renal function, suggesting structural adaptations of both renal tubules and glomeruli to accommodate elevated metabolic demands. Conceivably, elevated uEV levels may trail a renal hyperfiltration phase and are congruent with the small increase in urinary protein levels observed in these patients. Interestingly, PTC density and the PTC-to-tubule ratio were higher in our obese kidneys, which might appear counterintuitive given the well-established association of obesity with microvascular rarefaction[33,34]. However, studies suggest that obesity-related renal microvascular remodeling is a dynamic, biphasic process[2,35,36]. During the early phase of metabolic stress, activation of proangiogenic signaling pathways such as VEGF, inflammatory cytokines (IL-6, TNF-α), promotes transient and often dysregulated angiogenesis, leading to proliferation of immature and metabolically fragile capillaries[35,37]. This compensatory angiogenic response may temporarily enhance oxygen and nutrient delivery to hypertrophied tubules under increased metabolic load and local lipotoxic stress[36,38]. Nevertheless, as inflammation, oxidative stress, and hypoxia persist, these newly formed capillaries may lose pericyte support and regress, ultimately resulting in capillary rarefaction and interstitial fibrosis[39,40]. Thus, the elevated PTC density observed in our obese patients likely represents an early, maladaptive angiogenic phase that precedes microvascular rarefaction and functional decline. This interpretation is supported by the concomitant rise in DLL4+ and/or MCP-1+ PTC-derived uEVs, which indicate endothelial activation involving both angiogenic and inflammatory signaling. However, this sequence remains a hypothesis, given our cross-sectional observations, and will require longitudinal confirmation. Nonetheless, given the early phase of disease in our patients, preceding a fall in renal function, PTC density correlated with metabolic burden rather than with renal function.
This study has several limitations. The sample size was relatively small, and our patients were Caucasian, limiting the generalizability of the findings. In addition, the obese uEV cohort and lean controls differed in recruitment context, introducing potential selection bias beyond obesity itself. The cross-sectional design precludes conclusions about causality or disease progression over time, or prediction of future renal dysfunction, and the collection of histological and uEV samples from different individuals did not allow their direct correlation. Although post-hoc power analysis indicated adequate sensitivity to detect inter-group differences, the modest sample size still limits subgroup precision and generalizability, particularly because correlation analyses were exploratory and unadjusted for multiple comparisons or potential confounders such as age and sex. Kidney tissue MCP-1 and DLL4 immunostaining was unavailable. Furthermore, being kidney donors, the obese individuals in the histology cohort may represent a healthier subgroup than those in the uEV analysis, yet the histological findings were consistent with the uEV profiles, supporting the overall coherence of the results. Despite vesicle validation by TEM, NTA, and canonical EV markers, EV isolation was performed using a polymer-based precipitation method, which may co-isolate non-vesicular material. In addition, uEV subsets were expressed as fractions of total uEVs rather than normalized to urinary creatinine, and the CD31-/PLVAP+/CD144- phenotype, while based on prior work, may not fully exclude contributions from other endothelial or renal cell sources. Finally, detailed metabolic characterization of the obese cohort was limited and uEV-clinical correlations were modest, restricting their diagnostic application, and their functional contribution to microvascular remodeling remains to be determined.
Future research should also involve larger, longitudinal studies to validate the predictive value of uEVs at different phases of kidney disease progression in obesity. Expanding uEV profiling to include other renal cell types and investigating the therapeutic potential of targeting angiogenic and inflammatory pathways to stabilize the renal microcirculation could further clarify their role in CKD progression. Exploring the functional significance of uEVs in renal pathology through basic mechanistic studies will also be useful to advancing the clinical application of these biomarkers.
In conclusion, the significant elevation of PTC-derived uEVs expressing angiogenic and inflammatory markers in obese patients situates renal microvascular injury early in obesity, before overt kidney dysfunction is detectable by traditional measures. These findings are especially relevant given the global rise in obesity and the associated increase in CKD, making early detection critical for preventing progressive renal dysfunction. Our study highlights the promising potential of uEVs as a valuable tool for early diagnosis and as potential screening tools in obesity-related kidney disease. Further research is needed to validate these findings and explore the therapeutic implications of modulating uEV-associated and microvascular pathways to prevent or mitigate CKD in obese individuals.
DECLARATIONS
Author Contributions
Conceptualization: Lerman LO
Data curation: Zhang L, Eirin A, Fidler M
Formal analysis: Al-Saeedi M, Zhang L, Denic A, Jordan KL, Zhu X, Tang H, Yuan F
Funding acquisition: Lerman LO, Lerman A
Investigation: Al-Saeedi M, Kukla A
Methodology: Lerman LO, Zhang L, Denic A, Jordan KL, Yuan F, Zhu X, Xue A, Tang H, Eirin A, Rule, AD
Project administration: Tang H, Eirin A
Supervision: Lerman LO, Kukla A
Writing - original draft: Al-Saeedi M, Zhang L
Writing - review & editing: All authors.
Availability of data and materials
The data that support the findings of this study are available from the corresponding author upon reasonable request.
AI and AI-assisted tools statement
During the preparation of this manuscript, the AI tool ChatGPT (version 4o, released 2024-05-13) was used solely for language editing. The tool did not influence the study design, data collection, analysis, interpretation, or the scientific content of the work. All authors take full responsibility for the accuracy, integrity, and final content of the manuscript.
Financial support and sponsorship
This study was partly supported by NIH grant numbers: DK120292, DK122734, HL158691, and AG062104.
Conflicts of interest
Lerman LO is an advisor to CureSpec, RiboCure, LiveKidney Bio, and Cellergy. The other authors declare there are no conflicts of interests.
Ethical approval and consent to participate
This study was approved by the Institutional Review Board of the Mayo Clinic (IRB18-005076) and informed, written consent was obtained from each patient.
Consent for publication
Not applicable.
Copyright
© The Author(s) 2026.
Supplementary Materials
REFERENCES
1. Li N, Li Y, Cui L, et al. Association between different stages of cardiovascular-kidney-metabolic syndrome and the risk of all-cause mortality. Atherosclerosis. 2024;397:118585.
2. Paavonsalo S, Hariharan S, Lackman MH, Karaman S. Capillary rarefaction in obesity and metabolic diseases - organ-specificity and possible mechanisms. Cells. 2020;9:2683.
3. Kida Y. Peritubular capillary rarefaction: an underappreciated regulator of CKD progression. Int J Mol Sci. 2020;21:8255.
4. Bentley MD, Rodriguez-porcel M, Lerman A, et al. Enhanced renal cortical vascularization in experimental hypercholesterolemia. Kidney Int. 2002;61:1056-63.
5. Chade AR, Krier JD, Galili O, Lerman A, Lerman LO. Role of renal cortical neovascularization in experimental hypercholesterolemia. Hypertension. 2007;50:729-36.
6. Hull KL, Adenwalla SF, Topham P, Graham-brown MP. Indications and considerations for kidney biopsy: an overview of clinical considerations for the non-specialist. Clin Med. 2022;22:34-40.
7. Erdbrügger U, Blijdorp CJ, Bijnsdorp IV, et al. Urinary extracellular vesicles: a position paper by the urine task force of the international society for extracellular vesicles. J Extracellular Vesicle. 2021;10:e12093.
8. Svenningsen P, Sabaratnam R, Jensen BL. Urinary extracellular vesicles: origin, role as intercellular messengers and biomarkers; efficient sorting and potential treatment options. Acta Physiol. 2019;228:e13346.
9. Schnobrich L, Castrop H. Urinary microvesicles: a window into the kidney. Clinical Kidney Journal. 2025;18:sfaf189.
10. Zhang L, Al-saeedi M, Denic A, et al. Renal podocyte senescence in human obesity detected by urinary extracellular vesicles. eBioMedicine. 2026;124:106116.
11. Sun IO, Santelli A, Abumoawad A, et al. Loss of renal peritubular capillaries in hypertensive patients is detectable by urinary endothelial microparticle levels. Hypertension. 2018;72:1180-8.
12. Puranik AS, Leaf IA, Jensen MA, et al. Kidney-resident macrophages promote a proangiogenic environment in the normal and chronically ischemic mouse kidney. Sci Rep. 2018;8:13948.
13. Zhang B, Liang H, Yu Z, Wei F, Wu Y. Clinical implications of estimating glomerular filtration rate with different equations in heart failure patients with preserved ejection fraction. High Blood Press Cardiovasc Prev. 2024;31:205-13.
14. Dinsdale G, Moore T, O'leary N, et al. Intra-and inter-observer reliability of nailfold videocapillaroscopy - a possible outcome measure for systemic sclerosis-related microangiopathy. Microvasc Res. 2017;112:1-6.
15. Lamah M, Chaudhry H, Mortimer P, Dormandy J. Repeatability of intravital capillaroscopic measurement of capillary density. Int J Microcirc. 1996;16:23-9.
16. Van Der Weijden J, De Hoogt PA, Leufkens MME, et al. The relationship of peritubular capillary density with glomerular volume and kidney function in living kidney donors. J Nephrol. 2023;36:2111-24.
17. Issa N, Lopez CL, Denic A, et al. Kidney structural features from living donors predict graft failure in the recipient. J Am Soc Nephrol. 2020;31:415-23.
18. Asghar MS, Denic A, Mullan AF, et al. Age-based versus young-adult thresholds for nephrosclerosis on kidney biopsy and prognostic implications for CKD. J Am Soc Nephrol. 2023;34:1421-32.
19. Pellegrini D, Konst R, Van Den Oord S, et al. Features of atherosclerosis in patients with angina and no obstructive coronary artery disease. EuroIntervention. 2022;18:e397-404.
20. Owusu J, Barrett E. Early microvascular dysfunction: is the vasa vasorum a “missing link” in insulin resistance and atherosclerosis. Int J Mol Sci. 2021;22:7574.
21. Son J, Li S, Jeong W. Bioprinting vascularized constructs for clinical relevance: engineering hydrogel systems for biological maturity. Gels. 2025;11:636.
22. Oosthuyzen W, Scullion KM, Ivy JR, et al. Vasopressin regulates extracellular vesicle uptake by kidney collecting duct cells. J Am Soc Nephrol. 2016;27:3345-55.
23. Chatterjee E, Rodosthenous RS, Kujala V, et al. Circulating extracellular vesicles in human cardiorenal syndrome promote renal injury in a kidney-on-chip system. JCI Insight. 2023;8:e165172.
24. Ståhl A, Arvidsson I, Johansson KE, et al. A novel mechanism of bacterial toxin transfer within host blood cell-derived microvesicles. PLoS Pathog. 2015;11:e1004619.
25. Mohammadlou M, Salehi S, Baharlou R. Development of anti DLL4 Nanobody fused to truncated form of Pseudomonas exotoxin: as a novel immunotoxin to inhibit of cell proliferation and neovascularization. Anal Biochem. 2022;653:114776.
26. Tefft JB, Bays JL, Lammers A, Kim S, Eyckmans J, Chen CS. Notch1 and Notch3 coordinate for pericyte-induced stabilization of vasculature. Am J Physiol Cell Physiol. 2022;322:C185-96.
27. Wang R, Sun Q, Wu X, et al. Hypoxia as a double-edged sword to combat obesity and comorbidities. Cells. 2022;11:3735.
28. Liu Y, Xu K, Xiang Y, et al. Role of MCP-1 as an inflammatory biomarker in nephropathy. Front. Immunol. 2024;14:1303076.
29. Kwaifa IK, Bahari H, Yong YK, Noor SM. Endothelial dysfunction in obesity-induced inflammation: molecular mechanisms and clinical implications. Biomolecules. 2020;10:291.
30. Lin H, Fu L, Zhou X, et al. LRP1 induces anti-PD-1 resistance by modulating the DLL4-NOTCH2-CCL2 axis and redirecting M2-like macrophage polarisation in bladder cancer. Cancer Lett. 2024;593:216807.
31. Li M, Wang M, Wen Y, Zhang H, Zhao GN, Gao Q. Signaling pathways in macrophages: molecular mechanisms and therapeutic targets. MedComm. 2023;4:e349.
32. Chen Y, Dabbas W, Gangemi A, et al. Obesity management and chronic kidney disease. Semin Nephrol. 2021;41:392-402.
33. Kounatidis D, Vallianou NG, Stratigou T, Voukali M, Karampela I, Dalamaga M. The kidney in obesity: current evidence, perspectives and controversies. Curr Obes Rep. 2024;13:680-702.
34. Krishnan S, Suarez‐martinez AD, Bagher P, et al. Microvascular dysfunction and kidney disease: Challenges and opportunities? Microcirculation 2020;28:e12661.
35. Jang KW, Hur J, Lee DW, Kim SR. Metabolic syndrome, kidney-related adiposity, and kidney microcirculation: unraveling the damage. Biomedicines. 2024;12:2706.
36. Mohandes S, Doke T, Hu H, Mukhi D, Dhillon P, Susztak K. Molecular pathways that drive diabetic kidney disease. J Clin Investig. 2023;133:e165654.
37. Zhang A, Fang H, Chen J, He L, Chen Y. Role of VEGF-A and LRG1 in abnormal angiogenesis associated with diabetic nephropathy. Front. Physiol. 2020;11:1064.
38. Zhang X, Lerman LO. Obesity and renovascular disease. Am J Physiol Renal Physiol. 2015;309:F273-9.
39. Li S, Wang F, Sun D. The renal microcirculation in chronic kidney disease: novel diagnostic methods and therapeutic perspectives. Cell Biosci. 2021;11:90.
Cite This Article
 Open Access
How to Cite
Download Citation
Export Citation File:
Type of Import
Tips on Downloading Citation
Citation Manager File Format
Type of Import
Direct Import: When the Direct Import option is selected (the default state), a dialogue box will give you the option to Save or Open the downloaded citation data. Choosing Open will either launch your citation manager or give you a choice of applications with which to use the metadata. The Save option saves the file locally for later use.
Indirect Import: When the Indirect Import option is selected, the metadata is displayed and may be copied and pasted as needed.
About This Article
Copyright

Data & Comments
Data
0










Comments
Comments must be written in English. Spam, offensive content, impersonation, and private information will not be permitted. If any comment is reported and identified as inappropriate content by OAE staff, the comment will be removed without notice. If you have any queries or need any help, please contact us at [email protected].