

fig5
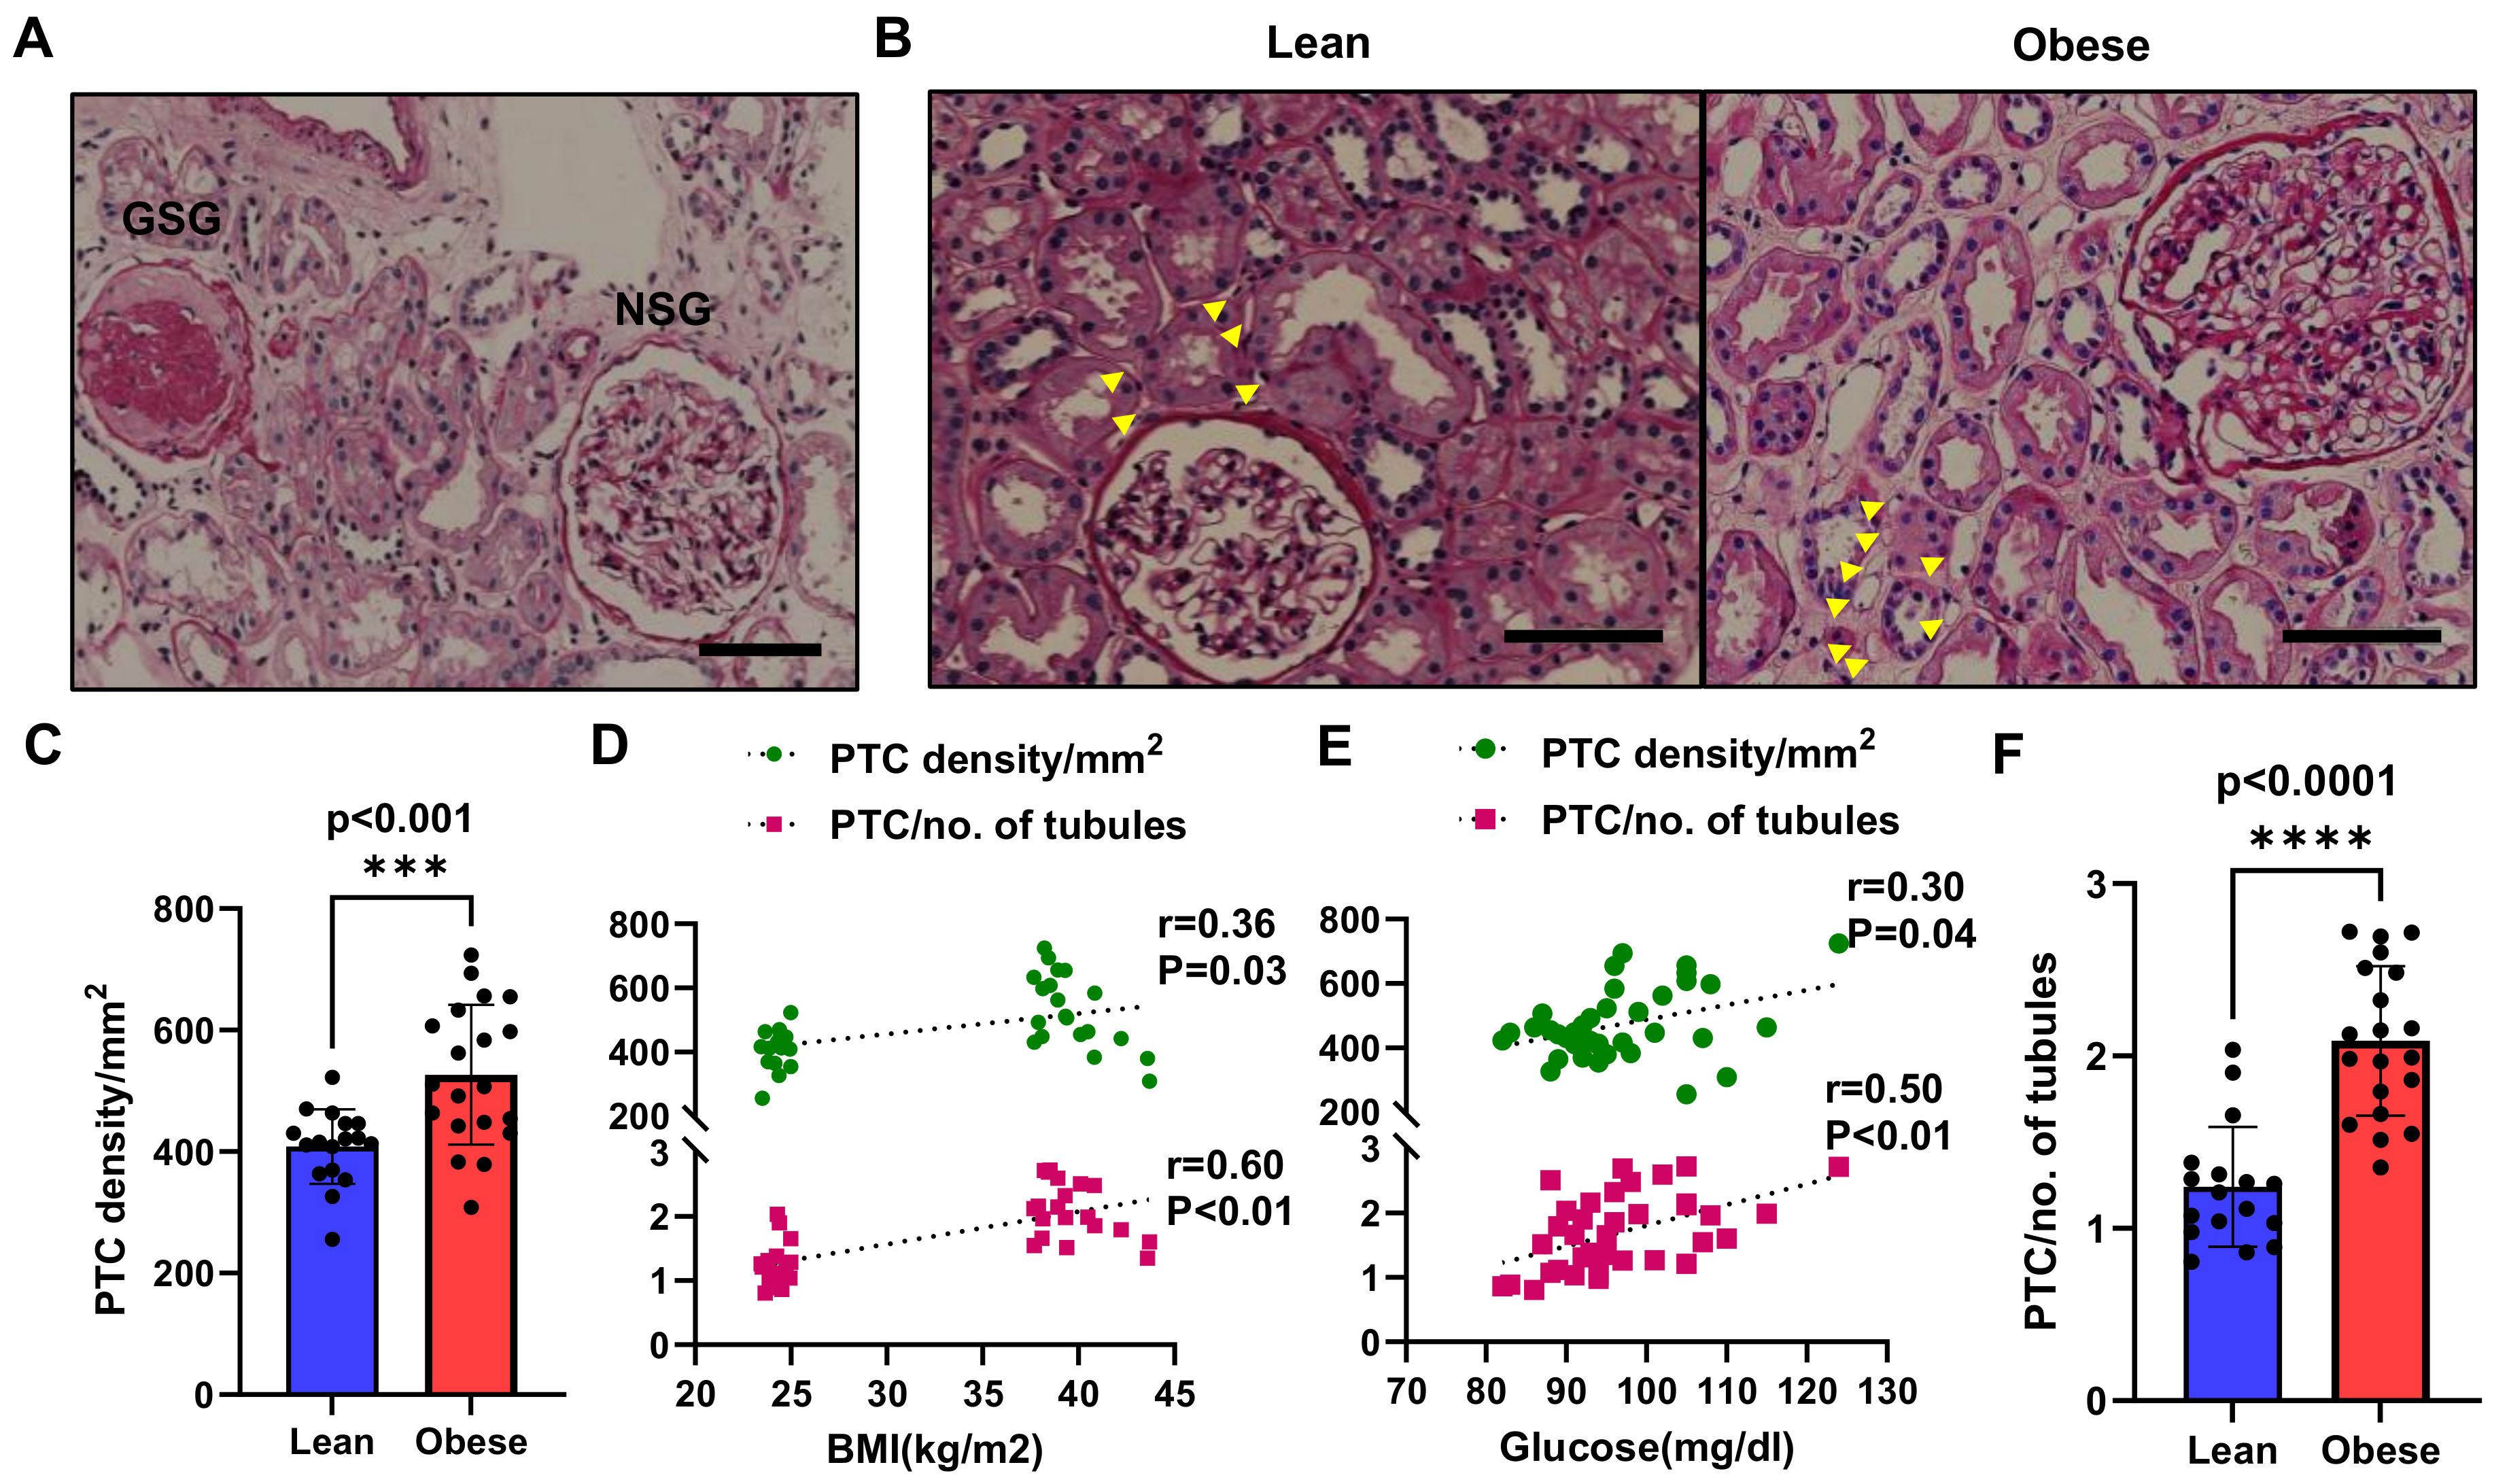
Figure 5. Kidney Morphology in ‘Lean’ and Obese Individuals. (A) Representative kidney sections displaying NSG and GSG glomeruli; (B) Representative kidney sections from Lean and Obese patients showing glomeruli and tubules, with yellow arrows indicating PTC; (C and D) PTC density and PTC-to-tubule ratio were significantly higher in the obese vs. lean group, ***P < 0.001, ****P < 0.0001, t-test, error bars represent Standard Deviation. (E and F) Direct correlation of PTC density and PTC-to-tubule ratio with BMI and glucose, suggesting a relationship with metabolic load. Black scale bars represent 100µm. NSG: Non-sclerotic; GSG: globally-sclerotic; PTC: peritubular capillary; BMI: body mass index.





