

Perinatal microbiome perturbation alters neonatal retinal angiogenesis and maternal milk metabolism
 0
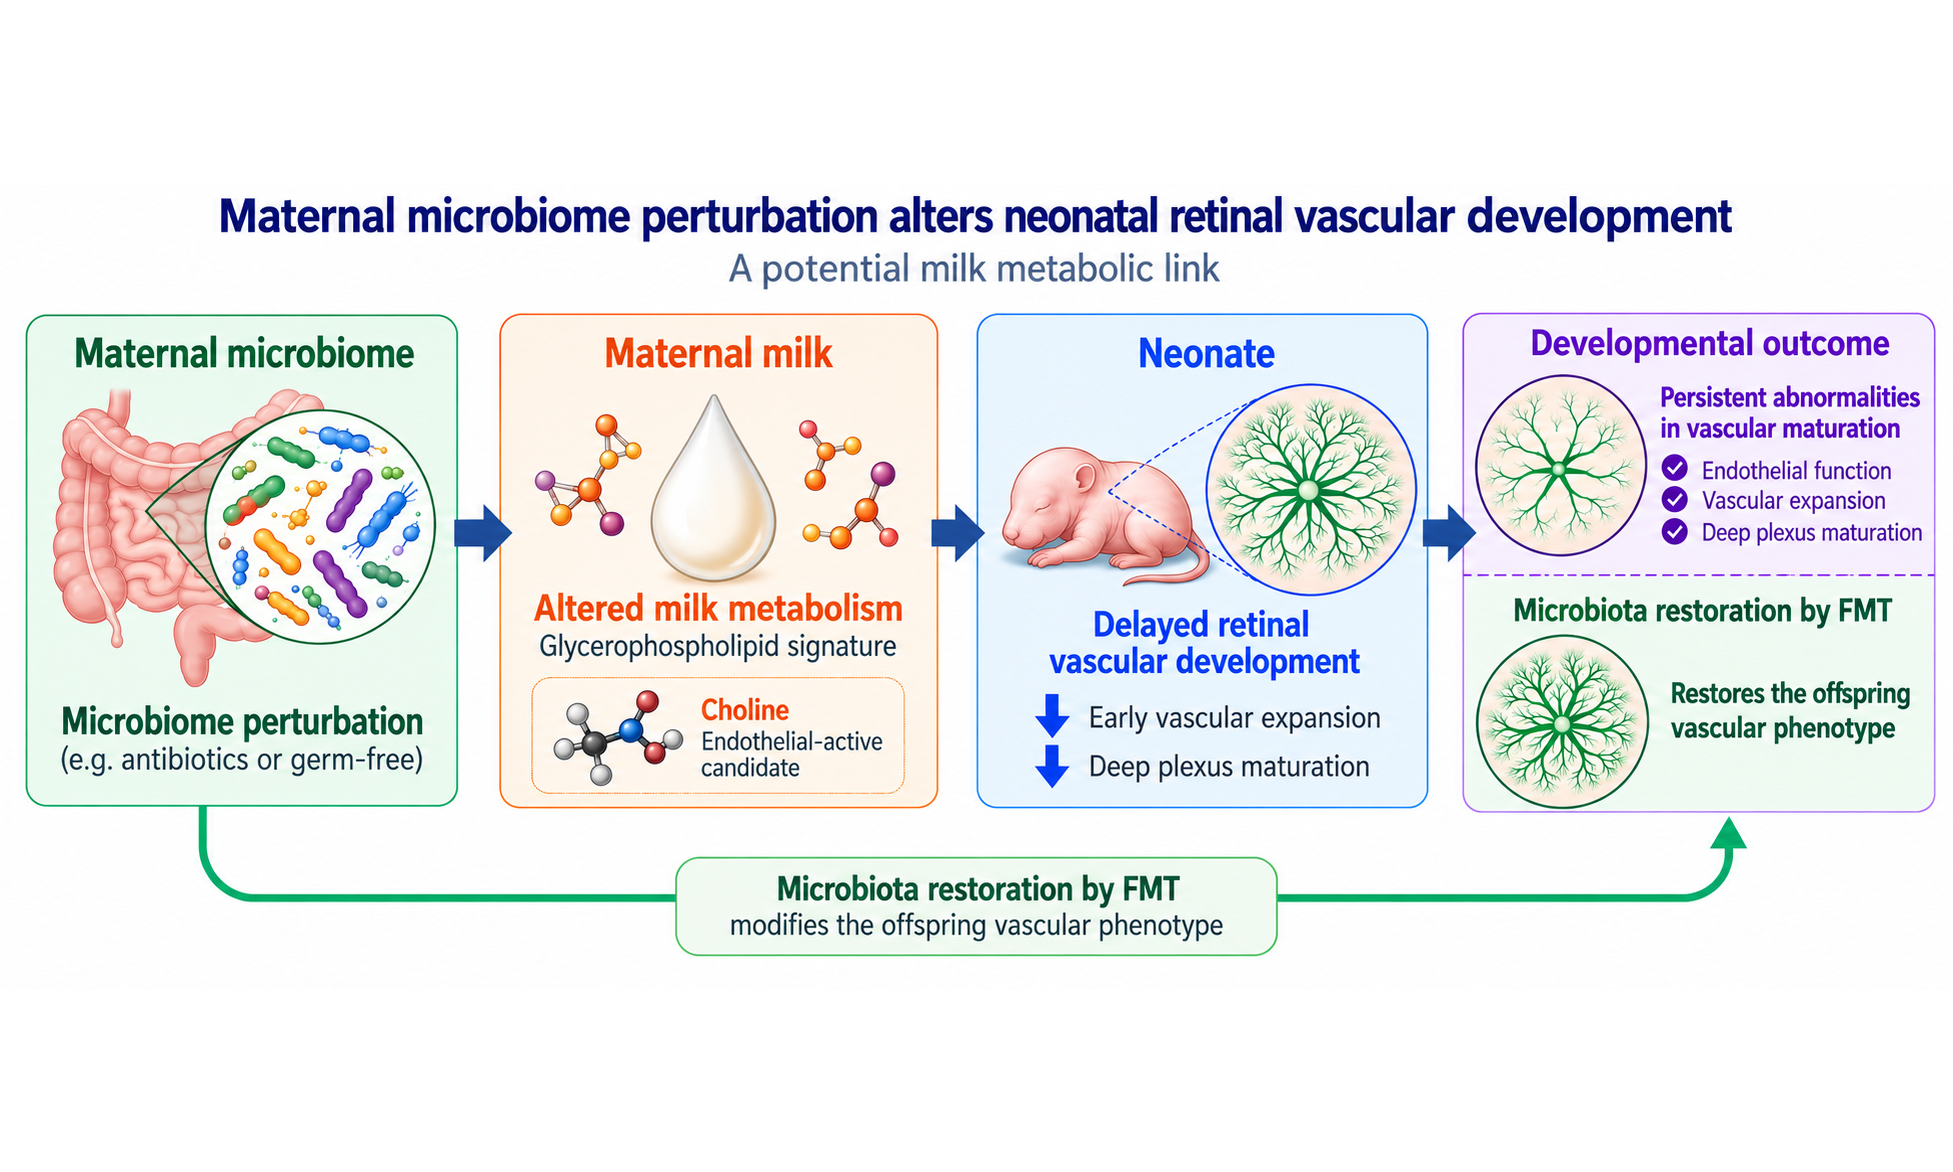
Graphical Abstract
Abstract
Background: Maternal and early-life microbial exposures can influence developmental physiology, but whether perinatal microbiome perturbation affects neonatal vascular development remains poorly understood. We investigated whether perinatal microbiome perturbation alters retinal angiogenesis and explored maternal milk metabolic signals associated with this phenotype.
Methods: Maternal microbiota were perturbed using vancomycin, neomycin, metronidazole, amphotericin B and ampicillin (VNMAA), with germ-free mice included as a microbiota-deficient comparator. Retinal vascular development was assessed at postnatal day (P)6 and P12. Reciprocal faecal microbiota transplantation (FMT) was used to modify maternal microbial state. Maternal and pup caecal communities were characterised by whole-genome shotgun sequencing, and maternal milk was analysed by metabolomic profiling. Choline was assessed in human umbilical vein endothelial cells using metabolic activity and tubule formation assays.
Results: VNMAA and germ-free conditions were associated with reduced P6 retinal vascular extension, while this difference was no longer evident at P12. Persistent abnormalities in P12 deep plexus density, descending branches and vascular complexity were observed. Reciprocal FMT modified offspring vascular density. Maternal and pup microbiomes differed in community structure (permutational multivariate analysis of variance, P < 0.001), whereas the four maternal groups did not (P = 0.186). Milk metabolomic profiling identified glycerophospholipid metabolism as a recurrent metabolic signature. Choline was not significantly altered but increased endothelial tubule formation in vitro.
Conclusion: Perinatal microbiome perturbation is associated with delayed retinal vascular development and persistent abnormalities in vascular maturation. These findings identify maternal milk glycerophospholipid-associated metabolism as a candidate link between microbial state and neonatal vascular development and support choline as an endothelial-active metabolite requiring in vivo investigation.
Keywords


 Download PDF
INTRODUCTION
Vascular development is a fundamental component of organogenesis and early postnatal tissue maturation. The formation, expansion, and remodelling of vascular networks ensure oxygen delivery, nutrient transport, immune surveillance, and metabolic homeostasis during periods of rapid growth. Disruption of vascular development during early life can therefore have consequences that extend beyond the immediate developmental window. This concept is consistent with the developmental origins of health and disease framework, which proposes that environmental exposures during critical windows of development can shape later physiological function and disease susceptibility[1-3]. While this framework has traditionally focused on maternal nutrition, placental insufficiency, hypoxia, and endocrine signalling, increasing evidence suggests that the maternal microbiome may represent an additional and underexplored determinant of offspring developmental programming.
Angiogenesis, the process by which new vessels sprout from pre-existing vasculature, is tightly regulated by growth factors, metabolic cues, extracellular matrix interactions, and endothelial cell-intrinsic signalling pathways[4]. The neonatal mouse retina provides a particularly powerful model for studying physiological angiogenesis because its vascularisation occurs postnatally in a stereotyped and temporally defined manner. During the first postnatal week, vessels expand radially from the optic nerve head to form the superficial vascular plexus. Subsequently, endothelial sprouts descend into the retina to form the deep and intermediate plexuses, generating a three-dimensional vascular network that supports the metabolic demands of the developing neural retina[5-10]. This predictable sequence allows investigators to distinguish early defects in vascular extension from later abnormalities in plexus formation, branching, and vascular maturation. The mouse retina is therefore widely used to study mechanisms of developmental angiogenesis and to model pathological retinal vascular disorders, including oxygen-induced retinopathy[7,11,12].
Endothelial cells are highly responsive to their metabolic environment. During sprouting angiogenesis, endothelial cells must proliferate, migrate, extend filopodia, remodel membranes, and form lumenised networks. These processes require coordinated regulation of energy metabolism, lipid synthesis, membrane turnover, and redox balance. Canonical angiogenic pathways such as vascular endothelial growth factor (VEGF) and Notch signalling are increasingly understood to act in concert with endothelial metabolic programmes[4,13-18]. For example, PFKFB3-driven glycolysis regulates endothelial tip-cell behaviour, cytoskeletal remodelling, and vessel branching, demonstrating that metabolic state is not merely supportive but functionally instructive during angiogenesis[13]. Although much attention has focused on glucose metabolism, lipid and phospholipid metabolism are also essential for endothelial proliferation, membrane biogenesis, and signalling[15-18]. These observations raise the possibility that maternal or neonatal metabolic environments could directly influence angiogenic capacity during early development.
The gut microbiota is increasingly recognised as a regulator of host metabolism, immune maturation, and developmental physiology. In adults, microbial metabolites influence systemic metabolic tone, inflammatory pathways, and vascular function[19-21]. In early life, the microbiome is particularly important because microbial colonisation occurs alongside rapid maturation of immune, metabolic, neurological, and epithelial systems. The infant gut microbiome is dynamic and undergoes functional maturation over the first months and years of life[22-25]. Maternal microbial communities contribute to this process through vertical transmission at birth, contact during nursing, and exposure to maternal-derived microbial products and metabolites. However, the neonatal gut microbiome is not immediately equivalent to the mature maternal microbiome; instead, it is sparse, dynamic, and shaped by delivery mode, feeding, antibiotics, and environmental exposure. This distinction is important when interpreting early postnatal phenotypes: maternal microbial effects on offspring development may occur before the offspring microbiome is fully established.
A growing body of experimental work supports the idea that maternal microbiota can shape offspring development through mechanisms that do not require a mature offspring microbiome. Transient colonisation of germ-free pregnant mice demonstrated that the maternal microbiota can drive early postnatal innate immune development in offspring[26]. Maternal gut microbiota-derived short-chain fatty acids have been shown to influence offspring metabolic phenotypes through embryonic GPR41 and GPR43 signalling[27]. Maternal microbiome depletion and selective reconstitution can also alter foetal neurodevelopment in mice, with effects on axonogenesis and brain metabolite availability[28]. More recent metabolomic studies in germ-free and specific pathogen-free pregnancies have shown that maternal microbial status influences metabolite profiles in foetal intestine, brain, and placenta[29,30]. Together, these studies establish maternal microbiota as a developmental regulator acting through microbial metabolites, maternal physiology, and maternally transferred molecular cues.
Despite these advances, the role of maternal microbiota in vascular development remains poorly understood. Prior studies have implicated maternal microbial status in immune, metabolic, and neurodevelopmental outcomes, but whether maternal microbiota regulates developmental angiogenesis has not been defined. This represents a major gap because vascular development is essential for organ maturation and may represent an intermediary mechanism linking maternal exposures to long-term cardiometabolic and neurovascular risk. Moreover, because retinal vascularisation in mice occurs largely during the postnatal lactation period, it provides an opportunity to examine whether maternal microbial signals influence angiogenesis after birth through maternal-derived factors.
Human milk is a biologically active interface between maternal physiology and neonatal development. Beyond macronutrient delivery, milk contains lipids, phospholipids, amino acids, oligosaccharides, immune mediators, hormones, microbial products, and small metabolites that contribute to immune maturation, microbial colonisation, growth, and organ development[31-34]. Human milk composition varies with gestational age, lactational stage, maternal metabolic status, and other maternal factors[31-40]. Metabolomic studies have shown that milk contains dynamic low-molecular-weight metabolite profiles and that these profiles are associated with infant growth and developmental outcomes[32-36,41]. Maternal adiposity and obesity have also been associated with changes in the human milk metabolome, supporting the concept that maternal physiology can alter milk-derived biochemical signals[37,38]. These observations make milk a plausible conduit through which maternal microbiome-dependent metabolic changes could influence neonatal vascular development.
Among milk-derived metabolic pathways, glycerophospholipid metabolism is particularly relevant to developmental biology and angiogenesis. Human milk phospholipids, including phosphatidylcholine and related lipid species, vary with gestational and lactational age and are recognised as bioactive components important for infant development[36,42]. Glycerophospholipids provide structural components for cellular membranes and act as precursors for signalling molecules involved in proliferation, migration, and cellular stress responses. Choline is a central metabolite within this pathway. It contributes to phosphatidylcholine synthesis, methyl-donor metabolism through betaine, acetylcholine production, and membrane biogenesis[43-47]. Choline availability is especially important during development, when rapid cellular proliferation and tissue growth increase demand for membrane synthesis and one-carbon metabolism.
Choline also has precedent in developmental angiogenesis. Maternal dietary choline deficiency has been shown to alter angiogenesis in the foetal mouse hippocampus, decreasing endothelial cell proliferation and reducing vessel number while modifying expression of angiogenic genes such as VEGFc and Angpt2[48]. In endothelial cells, phosphatidylcholine metabolism is an active and regulated pathway, and exogenous phosphocholine can influence choline uptake and phosphatidylcholine synthesis[49]. Choline availability has also been shown to influence retinal development directly, with reduced maternal choline availability during pregnancy disrupting retinal progenitor cell differentiation and retinal structure in offspring[50]. In addition, choline insufficiency has been reported to alter angiogenic and inflammatory responses in cultured human trophoblasts[51]. These findings support the biological plausibility that altered choline or phosphatidylcholine-related metabolite availability could affect endothelial function during vascular development. However, whether maternal microbiota regulates milk choline-related metabolites, and whether these metabolites influence neonatal angiogenesis, has not been established.
Here, we investigate whether perinatal microbiome perturbation is associated with neonatal retinal angiogenesis and whether maternal milk metabolites may contribute to this relationship. Using antibiotic-induced microbiome perturbation, germ-free animals, reciprocal faecal microbiota transplantation, whole-genome shotgun sequencing, retinal vascular phenotyping, targeted metabolomic profiling, and endothelial functional assays, we investigate a proposed microbiota-milk metabolite-vascular axis. We show that perinatal microbiome perturbation delays early retinal vascular expansion and is associated with persistent abnormalities in deep plexus maturation, that reciprocal faecal microbiota transplantation (FMT) modifies neonatal vascular development, and that maternal microbial state is associated with differences in milk glycerophospholipid metabolism. Finally, we identify choline as an exploratory candidate metabolite capable of modulating endothelial metabolic activity and angiogenic behaviour in vitro.
MATERIALS AND METHODS
Mice
Animal studies were designed and reported in line with ARRIVE 2.0 recommendations. All animal procedures were conducted in accordance with the UK Animals (Scientific Procedures) Act 1986 and approved by the UK Home Office, in line with Directive 2010/63/EU on the protection of animals used for scientific purposes. C57BL/6J mice were purchased and maintained in-house at the Disease Modelling Unit (DMU), University of East Anglia, under project licence PP8873233 and under specific pathogen-free conditions, with ad libitum access to food and water and appropriate environmental enrichment. Female mice were weighed when breeding trios were established and then weighed weekly to estimate gestational stage. Once approximately two weeks pregnant, females were transferred to a fresh cage for treatment and weighed each time treatment was administered.
Germ-free animals (also on a C57BL/6J background) were maintained in sterile isolators under gnotobiotic conditions at the DMU. Germ-free pups were collected at matched developmental time points for retinal vascular analysis and were used as an independently maintained microbiota-deficient comparator group.
Pregnant dams were randomly allocated to experimental groups, with allocation performed at the dam/litter level, with breeding date and litter age considered when allocating animals to minimise imbalance between groups. Where experiments were performed across multiple experimental days, treatment groups were distributed across experimental blocks. Reciprocal FMT donor and recipient groups were processed in parallel. Experimental processing, staining, imaging, sequencing, and analysis were performed in a manner designed to minimise confounding by experimental day, cage location, batch, and processing order.
For in vivo experiments, the dam/litter was considered the unit of treatment allocation because microbiome depletion and FMT were applied at the maternal/litter level, while individual pups/retinas represented the unit of measurement for retinal vascular outcomes. Where multiple pups from the same litter were analysed, litter or biological repeat structure is indicated in the corresponding colour-coded plots so that litter-to-litter variation can be visualised. Both male and female pups were included. Sex was recorded where possible but was not used as a stratification factor because experiments were not powered to detect sex-specific effects.
Sample sizes were based on previous experience with neonatal retinal angiogenesis assays and microbiome-manipulation studies, using the minimum number of animals required to detect biologically meaningful differences while accounting for litter-to-litter variability and maintaining ethical reduction of animal use. No formal a priori power calculation was performed. Exact n values for each analysis are reported in the relevant figure legends, where n indicates the number of individual retinas, pups, dams, wells, fields, or biological repeats analysed, as appropriate. N indicates the number of independent litters, dams, or biological repeats, where applicable.
Where possible, pregnant dams were allocated to treatment groups to balance breeding date, litter age, and experimental processing order. For reciprocal FMT experiments, donor and recipient groups were processed in parallel to minimise confounding by collection date, cage location, staining batch, imaging batch, or analysis order. Germ-free animals were analysed as an independently maintained microbiota-deficient comparator group and were collected at matched developmental time points.
Microbiome-manipulation experiments in mice are sensitive to litter, dam, and cage effects[52]. In this study, antibiotic treatment and FMT were applied at the maternal/litter level, and offspring retinal measurements were therefore nested within maternal/litter-level exposure groups. For retinal vascular analyses, individual retinas were used as the measurement unit, while biological repeat/litter identity was retained and visualised in the corresponding colour-coded plots. For microbiome analyses, the number of maternal and pup caecal samples was limited, and these data were therefore interpreted primarily as treatment-associated microbial profiles rather than as a fully powered analysis of cage-dependent microbiome variation. Where possible, experimental groups were processed in parallel to reduce confounding by collection date, staining batch, imaging batch, sequencing batch, and analysis order.
Antibiotic-induced maternal microbiome depletion
Two-week gestational females were administered 0.2 mL of a broad-spectrum antibiotic cocktail consisting of vancomycin, neomycin, metronidazole, amphotericin B, and ampicillin (VNMAA) by oral gavage three times weekly until the pups were born. Treatment continued to be administered to both mothers and pups until P6 or P12. Pups received the VNMAA solution by placing a 10 µL drop directly into the mouth using a pipette. This non-invasive oral administration method was approved by the local animal facility veterinary team. Pups were not weighed at the time of administration; therefore, pup antibiotic exposure is reported as administered volume rather than mg/kg.
The antibiotic cocktail contained vancomycin (5 mg/mL, Merck Life Science), metronidazole (10 mg/mL, Merck Life Science), neomycin (10 mg/mL, Merck Life Science), amphotericin B (0.2 mg/mL, Merck Life Science) and ampicillin (1 mg/mL) prepared in drinking water.
Pups born to control and VNMAA-treated dams were collected at P6 or P12 for retinal vascular analysis. Maternal and pup caecal contents were collected for microbiome analysis in designated experiments.
Faecal microbiota transplantation
Faecal pellets were collected separately (at P1) from both control and antibiotic-treated dams in sterile Eppendorf tubes and kept on ice. Pellets were weighed, a sterile solution of 10% glycerol (Merck) in normal saline (0.9% NaCl) was added to the pellets at a 30:70 faecal material to glycerol/normal saline solution, then centrifuged to produce a slurry which was stored at -80 °C until use[53].
Animal experiments were set up as above with treatment ceasing when pups were P6. At P7, recipient mothers were administered by oral gavage (0.2 mL) with a reciprocal FMT. Experimental groups included control, VNMAA-treated, VNMAA dams receiving control FMT, and control dams receiving VNMAA-associated FMT. Retinas were collected from offspring at P12 for vascular phenotyping.
Tissue collection
Pups were culled at P6 or P12. Eyes were enucleated and fixed in 4% paraformaldehyde for 1 h at 4 °C, then transferred to 2X PBS for 30 min at 4 °C. Retinas were dissected in phosphate-buffered saline (PBS) under a stereomicroscope, with care taken to remove the hyaloid vasculature and preserve retinal structure.
Maternal and pup caecal contents were collected aseptically at the time of sacrifice, snap-frozen in liquid nitrogen, and stored at -80 °C until DNA extraction. Maternal milk was collected at P12 for metabolomic analysis as described below.
Inclusion and exclusion criteria
The prespecified primary in vivo outcomes were retinal vascular extension at P6 and P12 and P12 deep plexus vascular density, selected on the basis of established measures of neonatal retinal angiogenesis. Secondary retinal outcomes included superficial plexus vessel density and descending branch density. No single outcome was used for an a priori power calculation because no formal power calculation was performed. For microbiome analyses, outcome measures included genus-level relative abundance profiles in maternal and pup caecal samples. For milk metabolomics, outcome measures included pathway enrichment and relative abundance of metabolites, with particular focus on glycerophospholipid metabolism and choline-related metabolites. For endothelial assays, outcome measures included human umbilical vein endothelial cell (HUVEC) metabolic activity and HDF/HUVEC tubule formation.
Inclusion and exclusion criteria were defined before quantitative analysis. Pups were included if they were collected at the specified developmental stage, had intact eyes/retinas suitable for dissection, and belonged to the relevant experimental group. Retinas were included in plexus analysis only if staining quality, tissue integrity, and z-stack acquisition were sufficient to distinguish the superficial, intermediate/descending branch, and deep vascular layers. Images or regions were excluded only where technical artefacts prevented reliable quantification.
No animals or samples were excluded based on the observed vascular phenotype. Where exclusions occurred, they were due to technical failure during tissue collection, staining, imaging, or image analysis. Exact n values after exclusion are reported in the corresponding figure legends. Samples failing library preparation or producing insufficient sequencing data for reliable analysis were excluded from microbiome analysis.
Retinal whole-mount immunostaining
Retinas (P6/P12) were stained for immunofluorescence as described previously by Benwell et al.[54]. Briefly, after dissection, retinas were fixed for 20 min in ice-cold methanol prior to blocking and immunostaining. Retinas were first permeabilised in 0.3% Triton/PBS three times for ten min at room temperature (RT), washed twice (15 min each) in PBLEC in the dark, then blocked for 30 min in Dako Block (Agilent Dako #X090930-2) for 30 min in the dark at RT. Retinas were incubated overnight at 4 °C in FITC-conjugated B4/BS1-lectin (made up in PBLEC) (L9831, Sigma 1:250). The retinas were washed three times for ten min in 0.1% Triton/PBS in the dark at RT, then mounted with Fluoromount (Thermo Fisher). Retinas were imaged using a Zeiss LSM880 Airyscan Confocal microscope with identical acquisition settings across comparable groups. Whole-retina images were obtained for vascular extension analysis, while higher-magnification z-stack images were obtained for superficial, intermediate (descending vessel), and deep analyses. Vascular extension analysis (P6) and percentage of vascularisation (P12) were performed using ImageJ while vessel density analysis of z-stacks (P12) was performed using ImageJ first to convert images then analysed in AngioTool.
Quantification of retinal vascular development
P6 vascular extension was quantified as the radial distance from the optic nerve head to the angiogenic front. Measurements were taken in three quadrants per retina and averaged to generate a single value per retina. P12 vascular extension was quantified similarly to assess whether the early delay in superficial vascular outgrowth persisted at later developmental stages.
For P12 plexus analysis, confocal z-stacks were separated into superficial, intermediate/descending branch, and deep vascular layers. Z-stacks were opened as TIFF files in ImageJ/Fiji, and a representative image for each vascular layer was generated using Image > Stacks > Z Project, with the first and last image numbers selected to encompass the corresponding plexus. Images were adjusted using Image > Adjust > Brightness/Contrast to reduce background and improve visualisation of the vasculature, then saved as TIFF files using coded sample and plexus identifiers. The same image-processing approach and analysis settings were applied across experimental groups.
Plexus-specific vessel density and branching were quantified using AngioTool. Images were imported into AngioTool and the image resolution was set in pixels per millimetre. Analysis settings were optimised to accurately map the vasculature and then kept consistent across all samples. Vessel density and branch-point measurements were obtained from the analysed images. Where multiple regions were analysed within a retina, measurements were averaged to generate a single value per retina. Vessel density was expressed as a percentage relative to water-treated controls.
For quantification of overall deep plexus vascularisation at P12, tiled confocal images of whole-retina flat mounts were analysed using ImageJ/Fiji. The image scale was set using Analyse > Set Scale and applied globally to all images. Images were adjusted using Brightness/Contrast and converted to an RGB stack. The retinal boundary was outlined using the polygon selection tool and the total retinal area was measured. Images were subsequently converted to 8-bit, and a threshold was applied to identify the vascular signal. Vessel area was measured using Analyse > Measure with area and limit-to-threshold measurements enabled. The percentage vascularisation was calculated as vessel area divided by total retinal area × 100, and values were subsequently normalised to water-treated controls and expressed as percentage vascularisation relative to control.
Quantification was performed using identical image-processing and thresholding parameters across comparable experimental groups. Investigators performing retinal image acquisition and quantitative image analysis were blinded to experimental group wherever technically feasible. Group identities were coded during image analysis, and quantitative measurements were performed before treatment identities were revealed. Investigators administering VNMAA or FMT were necessarily aware of treatment allocation.
DNA extraction and whole-genome shotgun sequencing
Caecal material was weighed into MPBio Lysing Matrix E bead-beating tubes (MPBiomedical, Germany); then, DNA extraction was completed according to the manufacturer’s protocol for the MPBio FastDNATM SPIN Kit for Soil (MPBiomedical, Germany) with an increase in the bead-beating time to 3 min. DNA recovered from these samples was assessed using a Qubit® 2.0 fluorometer (Thermo Fisher).
Whole-genome shotgun sequencing was performed as described previously[55]. Briefly, DNA was extracted from caecal material using the MPBio FastDNA SPIN Kit for Soil, with an extended bead-beating step. Sequencing libraries were prepared using a modified Illumina Nextera low-input tagmentation approach. Genomic DNA was normalised to 0.5 ng/µL, and 1 ng total DNA was used for tagmentation. Libraries were amplified using Nextera XT index primers, quantified, pooled in equimolar amounts, and size-selected using KAPA Pure Beads. The final library pool was quantified using Qubit and assessed using an Agilent Tapestation prior to sequencing. Whole-genome shotgun sequencing was performed using 2 × 150 bp paired-end sequencing, generating approximately 8-10 GB of sequence data per sample, corresponding to approximately 30-40 million paired-end reads per sample.
Libraries were sequenced on an Illumina NextSeq 500 using a Mid Output v2 300-cycle flow cell, with a 1% PhiX spike-in. Raw data were converted to FASTQ files using Illumina BaseSpace. FASTQ reads were quality-filtered (adapter sequences removed) using fastp v0.21.0[56]. Host-associated reads were removed using Kraken2 v2.1.2[57]. Metagenomic purified reads were parsed into Kraken2 v2.1.2 for taxonomic profiling (Kraken2 standard RefSeq indexes retrieved from https://benlangmead.github.io/aws-indexes/k2), with confidence level set at 0.1. Bracken v2.6.2[58] was then utilised to re-estimate the relative abundance of taxa at both genus and species level (-t set at 10) from Kraken2 outputs as recommended.
For functional analysis, clean reads were concatenated for each sample prior to analysis. Taxonomic profiling was performed using MetaPhlAn v4.0[59] with the --unknown_estimation and --add_viruses options and the ChocoPhlAn v30 database. Functional profiling was performed using HUMAnN v3.0.0[60] alpha with UniRef90 translated search mode and DIAMOND v0.9.24. Taxonomic and pathway outputs were normalised to relative abundance. Relative abundance data were analysed in R and visualised using ggplot2. Where applicable, differential taxa or pathway abundance was assessed using Wilcoxon-Mann-Whitney tests, with Benjamini-Hochberg correction for multiple testing.
Maternal milk collection
Maternal milk was collected from lactating dams at P12. Dams were separated from pups for 4 h prior to milk collection to allow milk accumulation. Dams were administered oxytocin [0.1 mL (2 IU/kg)] intraperitoneally to stimulate milk let-down for 5 min then anaesthetised. Before collection, the dam was gently restrained and the ventral mammary area was wiped with 70% ethanol to minimise potential external contamination. Milk was then expressed manually from the mammary glands using a sterile collection tube and collected directly into the tube. Approximately 100μL of whole milk was obtained from each dam for metabolomic analysis. Samples were immediately placed on ice and subsequently stored at -80 °C until analysis. After milk collection, dams were culled. Samples were collected from control, VNMAA-treated, VNMAA + control FMT, and control + VNMAA FMT dams.
Targeted milk metabolomics
Targeted metabolomic profiling of maternal whole milk (5-25 μL of milk in a sterile Eppendorf tube) was performed by BIOCRATES Life Sciences AG (Innsbruck, Austria) using the MxP® Quant 500 assay to measure endogenous metabolites. Flow injection analysis-tandem mass spectrometry (FIA-MS/MS) using a SCIEX API 5500 QTRAP was used to measure lipids and hexoses, while liquid chromatography-tandem mass spectrometry (LC-MS/MS) was used to measure small molecules. Sciex Analyst® software was used to calculate metabolite concentrations and Biocrates‘ MetIDQTM software was used for further data analysis. MetaboAnalyst (free online software) was used to analyse the returned Biocrates metabolomic data. Metabolite concentrations were determined by Biocrates using the internal-standard-based quantification procedure incorporated within the MxP® Quant 500 assay. Stable-isotope-labelled internal standards are included within the assay for quantitative correction of analytical variability and are used according to the manufacturer’s validated workflow. No additional sample-level normalisation to total protein, lipid content, milk volume, or another biological denominator was applied. The returned quantitative metabolite data were subsequently analysed in MetaboAnalyst.
Pathway enrichment analysis was performed to identify metabolic pathways altered across experimental groups. Comparisons included control versus VNMAA and reciprocal FMT conditions. Particular attention was given to glycerophospholipid metabolism and associated metabolites, including choline, serine, methionine, total diacylglycerides, total lysophosphatidylcholine, and total phosphatidylcholine.
Endothelial cell culture
(HUVECs, C-12203, Merck) were cultured in M199 media (Merck) supplemented with 20% foetal bovine serum (FBS), 1% penicillin-streptomycin, 1% L-glutamine, 0.1 mg/mL Endothelial Cell Growth Supplement, 0.1 mg/mL heparin (Merck) in a humidified incubator at 37 °C with 5% CO2. Cells were used between passages 7-11 and were routinely monitored for morphology and confluence.
For co-culture tubule formation assays, HUVECs were cultured with human dermal fibroblasts (HDFs, C-12302, Merck). HDFs were cultured in high-glucose DMEM with 10% FBS, 1% penicillin-streptomycin, and 1% L-glutamine (Merck) under the same conditions as above. Cells were treated with choline at concentrations ranging from 0 µM to 20 µM. VEGF at 30 ng/mL served as a positive pro-angiogenic control, and suramin at 30 µM served as a negative control.
To assess both endothelial cell metabolic activity and co-culture tubule formation assays, cells were grown in serum free/Choline Free IMMLEC media (CFM) prepared using Dulbecco’s MEM (DMEM) High Glucose, w/ L-Glutamine, Pyridoxine HCl, Sodium Bicarbonate, w/o Glycine, Serine, Choline, Chloride (D9800-14-25L, Generon) supplemented with varying concentrations of choline chloride (C7017-5G, Merck) made from a 100mM stock solution.
Endothelial metabolic activity assay
HUVEC metabolic activity was assessed following treatment with varying concentrations of choline. In brief, 96-well plates were coated with 10 µg/mL of fibronectin (FN, F0895-5MG, Merck), incubated for 30 min then FN was removed. HUVECs were seeded at a density of 2 × 10⁴ cells/well, incubated overnight at 37 °C, 5% CO2 in 150 μL/well of complete IMMLEC media (contains 10% FBS). After 24 h, media was removed and wells were washed twice with sterile PBS. Cells were serum starved for 3 hours in 150 μL/well of serum free/Choline Free IMMLEC Media (CFM), media was removed then 100 µL of assay medium (Choline Free IMMLEC (CFM) +/- Choline concentrations (0 µM, 0.1 µM, 0.5 µM, 1 µM, 2.5 µM, 5 µM, 10 µM, 15 µM, 20 µM); complete IMMLEC; 30 ng/mL VEGF in CFM; 30 μM Suramin in CFM) in columns of eight and incubated for 24 h.
Endothelial metabolic activity was assessed using the CellTiter 96 AQueous One Solution Cell Proliferation Assay (Promega, Madison, WI, USA) according to the manufacturer’s instructions. Warmed reagent was prepared 1:5 in choline-free medium, and 120 µL was added directly to each well containing HUVECs. After incubation for 1 h at 37 °C, absorbance was measured at 492 nm using a VersaMax microplate reader (Molecular Devices, USA). Absorbance values were used as a measure of cellular metabolic activity and were normalised to untreated or vehicle-treated controls and expressed as percentage metabolic activity relative to control.
Tubule formation assay
Endothelial tubule formation was assessed using an HDF-HUVEC co-culture assay. Briefly, 24-well plates were coated with FN as above, then HDFs were seeded at a density of 5 × 10⁴ cells/well and incubated in HDF media at 37 °C/5% CO2 for 72 h. Next HUVECs (1 × 10⁴ cells/well) were seeded onto the HDF layer in either, assay medium (Choline Free IMMLEC (CFM) +/- Choline concentrations (see above); complete IMMLEC; 30 ng/mL VEGF in CFM; 30 μM Suramin in CFM) in triplicate. Plates were incubated at 37 °C/5% CO2 (Day 1) then fed as above on Days 3 and 5. On Day 8, wells were fixed with ice-cold 70% ethanol for 30 min at room temperature, washed three times for 5 min with PBS then incubated with mouse anti-human CD31 primary antibody (BioRad, MCA1738) for 1 h at 37 °C. Wells were washed again with PBS (as above) then incubated with goat anti-mouse IgG1 secondary antibody (BioRad, STAR132A) for 1 h at 37 °C followed with another wash with distilled water (dH2O), 3 times for 5 min. Finally, 1 BCIP/NBT tablet (#B5655, Merck) was added to 10 mL of water, filtered with a 0.2 μm filter, added to wells, incubated at 37 °C for 15 min then washed with dH2O and air-dried. Images were taken using an SP-105 Inverted Fluorescent microscope (Brunel Microscopes Ltd), then tubule formation was quantified using ImageJ/AngioTool to assess the tubule formation percentage, total tubule length and number of branch points. Three independent biological experiments were performed. Each experiment included three technical repeats per condition, each comprising three wells, giving nine wells per condition per experiment and 27 wells per condition before technical exclusions. Tubule formation was quantified across the entire well. Wells were excluded where imaging artefacts obscured the endothelial network and prevented reliable segmentation of tubules and junctions.
Statistical analysis
Data are presented as mean ± 95% confidence interval (CI). Statistical analyses were performed using GraphPad Prism version 11.1 and R where indicated for microbiome analyses. For datasets other than whole-genome shotgun sequencing, a one-way nested analysis of variance (ANOVA) (hierarchical ANOVA) was used for comparisons involving a single experimental factor, with individual measurements nested within the corresponding biological repeat or litter. This approach accounted for the hierarchical structure of the experimental data while retaining individual measurements within each biological repeat. Tukey’s honestly significant difference (HSD) test was used for post-hoc pairwise comparisons following significant omnibus effects.
The distribution of data was assessed using the Shapiro-Wilk test and inspection of the data distributions. Although some individual groups showed evidence of deviation from normality, most datasets showed broadly compatible distributions. Given the hierarchical experimental design and limited numbers of independent biological replicates, formal tests of variance homogeneity were not considered sufficiently informative for all datasets. The suitability of the nested ANOVA was therefore considered in conjunction with the observed data distributions and biological replicate structure.
For retinal vascular and endothelial assays, the litter or independent biological repeat was retained as the independent experimental level, while individual retinas, wells, fields, or technical replicates were treated as observations nested within the corresponding biological repeat. Each colour in the corresponding plots represents an independent litter or biological repeat and the mean ± 95% CI are shown. Exact sample sizes and numbers of independent biological repeats are provided in the figures.
Whole-genome shotgun sequencing data were analysed separately in R. For microbiome beta-diversity analyses, differences in community structure were assessed using permutational multivariate analysis of variance (PERMANOVA) based on distance matrices[61-63]. PERMANOVA results were interpreted cautiously given the limited sample size and the potential influence of differences in within-group dispersion. Differential abundance analyses were corrected for multiple testing where applicable. For metabolomics pathway analyses, multiple-testing correction was applied using the provider-recommended or false-discovery-rate approach; missing values were assumed to be Missing Completely At Random (MCAR) and imputed using the mean value of the remaining samples for that metabolite. For microbiome analyses, community composition was assessed using ordination and PERMANOVA based on distance matrices. Given the limited number of microbiome samples, these analyses were interpreted as supportive and hypothesis-generating.
Statistically significant P values are indicated on the graphs; comparisons for which no P value is shown were not statistically significant. P < 0.05 was considered statistically significant.
RESULTS
Maternal microbiome depletion impairs early postnatal retinal angiogenesis
To determine whether perinatal microbiome perturbation influences neonatal vascular development, we depleted the maternal microbiome using VNMAA administered across the perinatal period, with retinal angiogenesis assessed at P6 and P12. Germ-free animals were included as an independent microbiota-deficient comparator (Figure 1A, schematic).
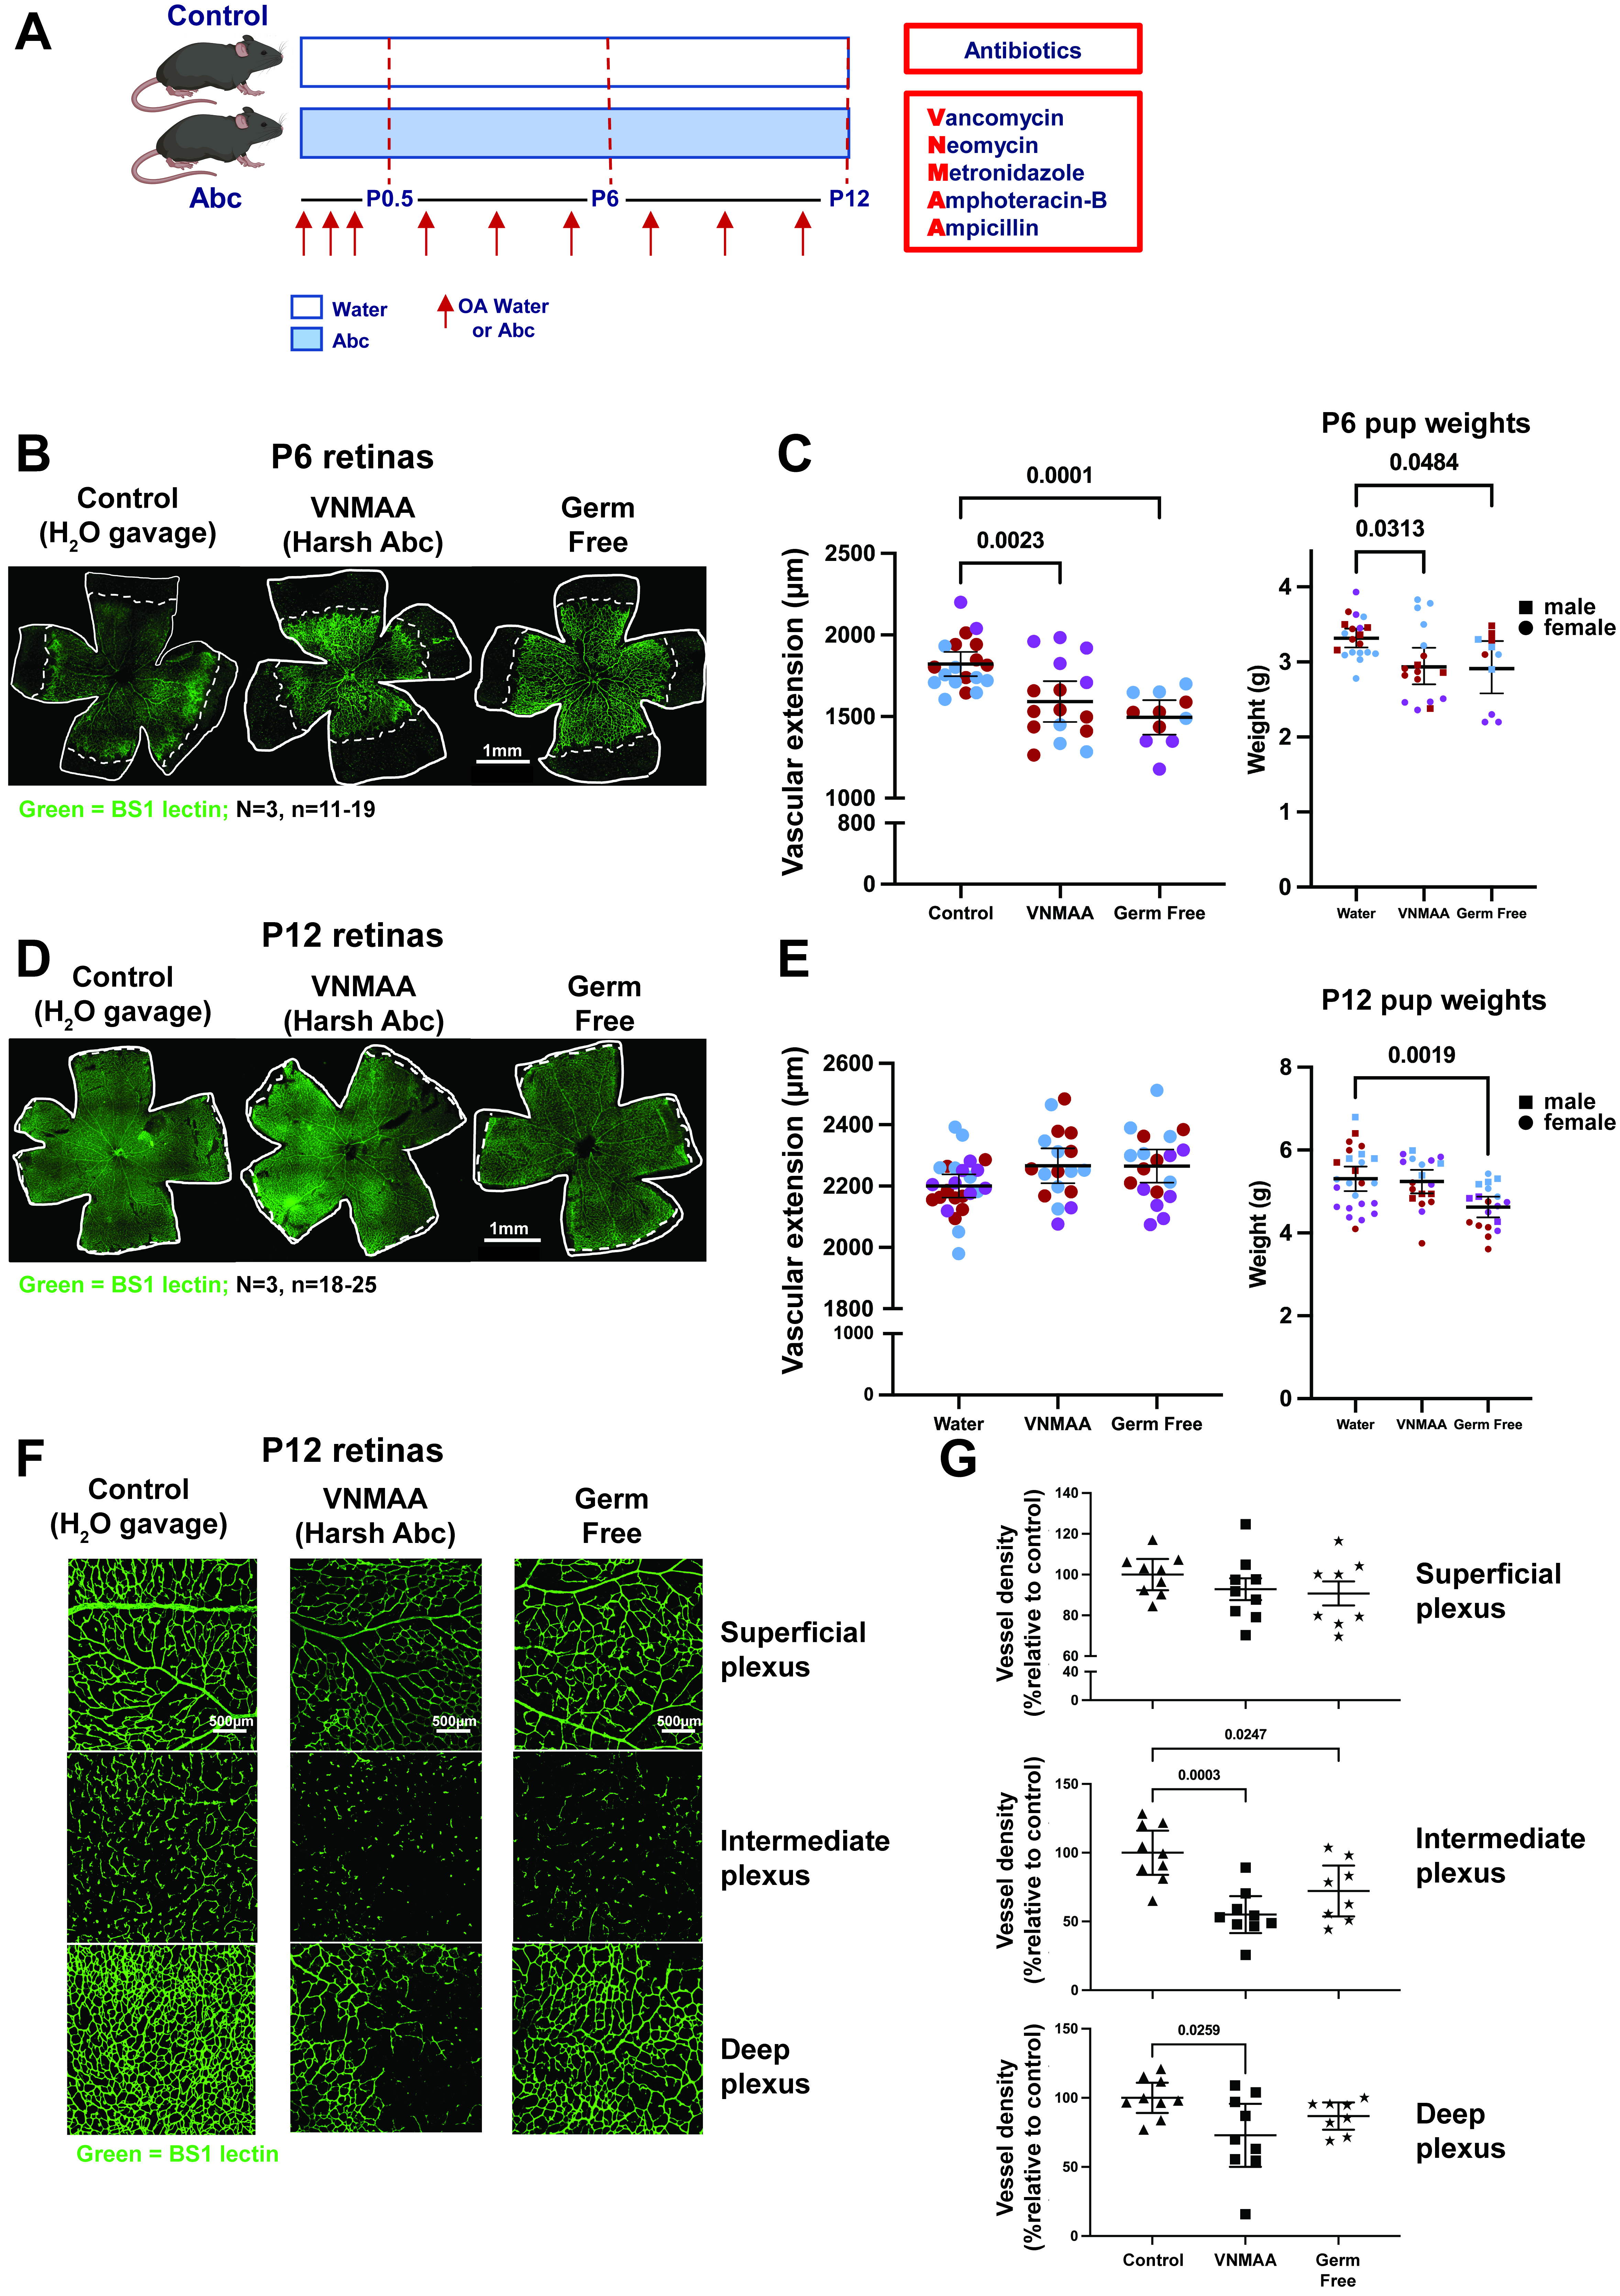
Figure 1. Perinatal microbiome perturbation delays retinal vascular extension and alters retinal vascular plexus development. (A) Experimental design. Mid-gestation dams were orally gavaged with water or the VNMAA broad-spectrum antimicrobial cocktail at the indicated time points during pregnancy, shown by red arrows. Following birth, dams and pups were orally administered water or VNMAA until the indicated experimental endpoint. VNMAA comprised vancomycin, neomycin, metronidazole, amphotericin B and ampicillin. In the schematic, “OA” denotes oral administration and “Abc” denotes the VNMAA cocktail; “OA Water or Abc” therefore indicates oral administration of water or VNMAA. The label “Harsh Abc” in the image panels refers to this same broad-spectrum cocktail and does not indicate a separate treatment. Retinas were collected at postnatal day (P)6 or P12. Germ-free mice were analysed in parallel as an independently maintained microbiota-deficient comparator. Created in BioRender. Robinson, S. (2026) https://BioRender.com/p6zsidr; (B) Representative Bandeiraea simplicifolia lectin (BS-1)-labelled whole-mount P6 retinas from water-treated control, VNMAA-treated and germ-free mice. “BS1” in the figure labels denotes the same lectin referred to as BS-1 throughout the text and legend. Retinal vasculature is shown in green; white outlines indicate the retinal edge and dashed white lines indicate the vascular front used to measure radial vascular extension. Scale bar, 1.0 mm; (C) Quantification of P6 vascular extension, measured as the radial distance from the optic nerve head to the vascular front (left), and pup body weight (right). VNMAA-treated and germ-free mice showed reduced vascular extension compared with water-treated controls, accompanied by a modest reduction in body weight. Each point represents an individual retina or pup, as appropriate; black horizontal lines indicate mean ± 95% confidence interval (CI). n = 11–19 retinas for vascular extension and n = 11–20 pups for body weight, from N = 3 independent litters per group; litters are colour-coded.; (D) Representative BS-1-labelled whole-mount P12 retinas from water-treated control, VNMAA-treated and germ-free mice. Retinal vasculature is shown in green; white outlines indicate the retinal edge and dashed white lines indicate the vascular front. Scale bar, 1.0 mm; (E) Quantification of P12 vascular extension, measured as the radial distance from the optic nerve head to the vascular front (left), and pup body weight (right). Radial vascular extension did not differ significantly among groups at P12. Body weight did not differ significantly between water-treated controls and VNMAA-treated pups, whereas germ-free pups had significantly lower body weight than water-treated controls (P = 0.0019). Each point represents an individual retina or pup, as appropriate; black horizontal lines indicate mean ± 95% CI. n = 18–25 retinas for vascular extension and n = 18–25 pups for body weight, from N = 3 independent litters per group; litters are colour-coded; (F) Representative confocal z-stack images of BS-1-labelled P12 retinal vasculature showing the superficial, intermediate/descending branch and deep vascular layers. Scale bar, 500 μm; (G) Quantification of P12 retinal vascular architecture. Vessel density was quantified in the superficial, intermediate and deep plexuses; values are expressed as percentages relative to water-treated controls. Each point represents an individual analysed retina; black horizontal lines indicate mean ± 95% CI. n = 3 mice per group from N = 3 independent litters per group. Statistically significant P values are indicated on the graphs. Comparisons for which no P value is shown were not statistically significant. CI: Confidence interval; Abc: VNMAA antimicrobial cocktail; BS-1: Bandeiraea simplicifolia lectin; OA: oral administration; P: postnatal day; VNMAA: vancomycin, neomycin, metronidazole, amphotericin B and ampicillin. “Harsh Abc” is an alternative figure label for VNMAA.
At P6, representative retinal whole-mount images showed reduced radial vascular outgrowth in pups from microbiome-depleted groups, with a shorter distance between the optic nerve head and angiogenic front compared with controls [Figure 1B]. Quantification showed that both VNMAA-exposed and germ-free animals had reduced vascular extension compared with water-treated controls. Pup body weight was also modestly reduced in the microbiome-depleted groups at this time point [Figure 1C].
By P12, representative retinal whole-mount images showed that the difference in radial vascular extension was no longer apparent [Figure 1D]. Quantification confirmed that radial vascular extension did not differ significantly among groups. Pup body weight did not differ significantly between water-treated controls and VNMAA-treated animals, whereas germ-free pups remained significantly lighter than water-treated controls [Figure 1E]. No pup mortality was observed during the experimental periods.
We next examined whether the apparent recovery in radial vascular extension was accompanied by persistent abnormalities in retinal vascular architecture. Confocal imaging of P12 retinas enabled assessment of the superficial plexus, the intermediate plexus, and the deep plexus [Figure 1F]. Quantitative analysis showed that superficial plexus vessel density was relatively modestly affected, whereas deep plexus vessel density was reduced in microbiome-depleted animals compared with controls. Intermediate plexus vessel density was also reduced, consistent with altered formation of the deeper retinal vascular network [Figure 1G].
Together, these findings indicate that perinatal microbiome perturbation is associated with an early delay in superficial retinal vascular expansion that is no longer evident at P12, alongside persistent abnormalities in deeper retinal vascular architecture. The reduction in pup body weight was no longer significant in VNMAA-treated animals at P12 but persisted in germ-free animals.
Reciprocal FMT modifies neonatal retinal angiogenesis
The retinal phenotype raised a key question: could the vascular defect be modified by altering the maternal microbial community after microbiome depletion? To test this, we performed reciprocal FMT experiments during the postnatal period. VNMAA-treated dams received microbiota from control donors, while control dams received microbiota from VNMAA-treated donors (Figure 2A, schematic). Retinal vascular development was then assessed in offspring at P12, focusing on deep plexus vascular density because this compartment showed the clearest defect after microbiome depletion (see Figure 1).
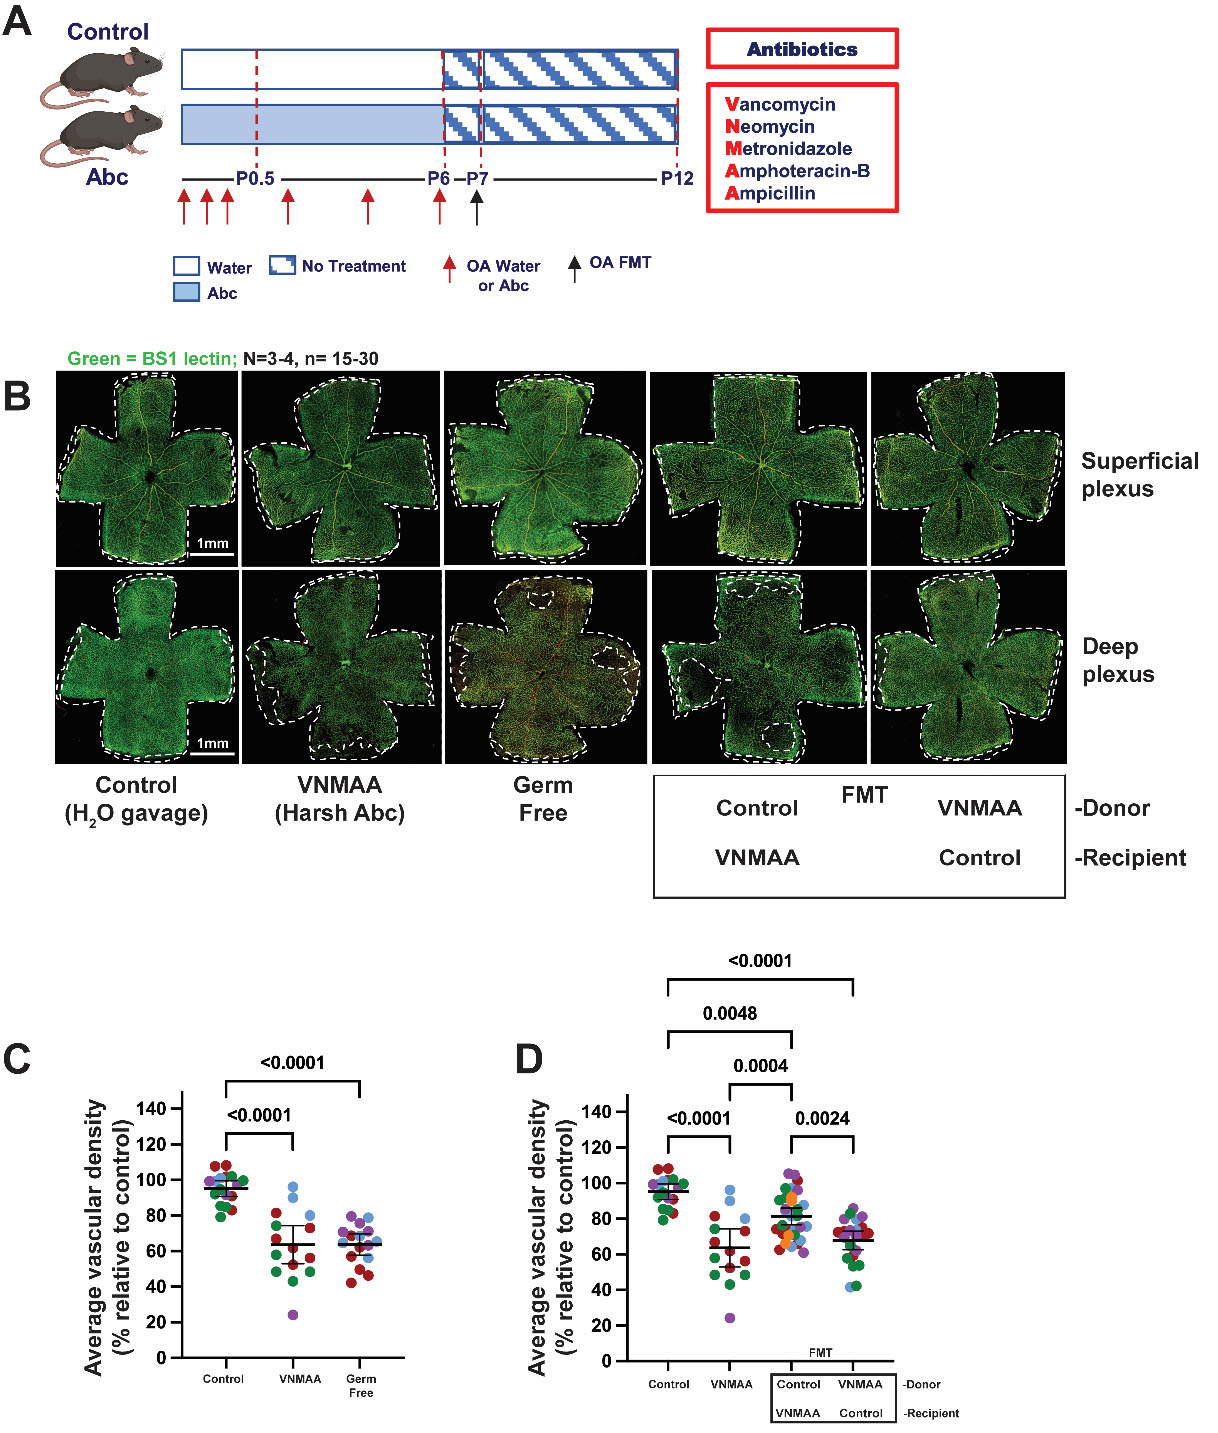
Figure 2. Reciprocal FMT modifies neonatal retinal angiogenesis. (A) Experimental design. Dams were orally gavaged with water or the VNMAA broad-spectrum antibiotic cocktail at the indicated time points during pregnancy, shown by red arrows. Following birth, dams and pups were orally administered water or VNMAA from P0.5 to P6 at the indicated time points, shown by red arrows. VNMAA consisted of vancomycin, neomycin, metronidazole, amphotericin B, and ampicillin. At P7, reciprocal FMT was performed, with VNMAA-treated dams receiving control microbiota and control dams receiving VNMAA-associated microbiota. No further treatments were administered after FMT. Retinas were collected at P12. The black arrow indicates oral FMT. Created in BioRender. Robinson, S. (2026) https://BioRender.com/isf8z0b; (B) Representative BS-1-labelled P12 retinal whole-mount images from control, VNMAA-treated, germ-free, VNMAA-treated (donor) to control (recipient) FMT, and control (donor) to VNMAA (recipient) FMT groups. Retinal vasculature is shown in green. Images show superficial and deep vascular plexus preparations; white outlines indicate the retinal edge. Scale bar, 1.0 mm; (C) Quantification of average deep plexus vascular density at P12, expressed as a percentage relative to control. VNMAA-treated and germ-free mice showed reduced vascular density compared with controls. Each point represents an individual retina and each colour represents an independent biological repeat/litter; black horizontal lines indicate mean ± 95% CI; n = 15-17 retinas from N = 3-4 independent litters per group (litters are colour-coded); (D) Quantification of average deep plexus vascular density following reciprocal FMTs, expressed as a percentage relative to control. Transfer of control microbiota into VNMAA-treated dams partially restored offspring vascular density, whereas transfer of VNMAA-associated microbiota into control dams shifted vascular density towards the VNMAA-associated phenotype. Each point represents an individual retina; black horizontal lines indicate mean ± 95% CI; n = 15-31 retinas from N = 4-5 independent litters per group (litters are colour-coded). Statistical significance is indicated on the graphs. These experiments demonstrate that altering the maternal microbial ecosystem is associated with changes in offspring retinal vascular development but do not establish the specific microbial taxa or products responsible. Statistically significant P values are indicated on the graphs. Comparisons for which no P value is shown were not statistically significant. FMT: Faecal microbiota transplantation; CI: confidence interval.
Representative P12 retinal whole-mount images showed reduced vascular density in pups from VNMAA-treated dams, with a similar impairment observed in germ-free animals. In contrast, pups from VNMAA-treated dams that received control FMT showed improved vascularisation, with deep plexus architecture more closely resembling that of control animals [Figure 2B].
Quantification confirmed that average deep plexus vascular density was reduced in VNMAA-treated and germ-free groups compared with controls [Figure 2C]. In the reciprocal FMT experiment, transfer of control microbiota to VNMAA-treated dams increased offspring vascular density toward control levels, whereas transfer of VNMAA-associated microbiota to control dams shifted offspring vascular density toward the VNMAA-associated phenotype [Figure 2D].
These data indicate that altering the maternal microbial state is associated with changes in neonatal retinal angiogenesis. However, because FMT is a community-level intervention, these experiments do not identify the specific taxa, microbial genes, or microbial products responsible for the vascular phenotype, nor do they establish FMT engraftment in the offspring. Instead, they show that altering the maternal microbial ecosystem is sufficient to modify the direction of offspring retinal vascular development.
Maternal and pup caecal microbiome profiles following perinatal perturbation and reciprocal FMT
We next asked whether the retinal vascular phenotype was associated with changes in the maternal microbiome or with establishment of distinct caecal communities in pups. To address this, whole-genome shotgun sequencing was performed on maternal and P12 pup caecal samples following VNMAA treatment and reciprocal FMT. The experimental design included four groups: control, VNMAA-treated, control-to-VNMAA FMT, and VNMAA-to-control FMT. Reciprocal FMT was performed at P7, after which no further treatment was administered, and maternal and pup caecal samples were collected at P12 (Figure 3A, schematic).
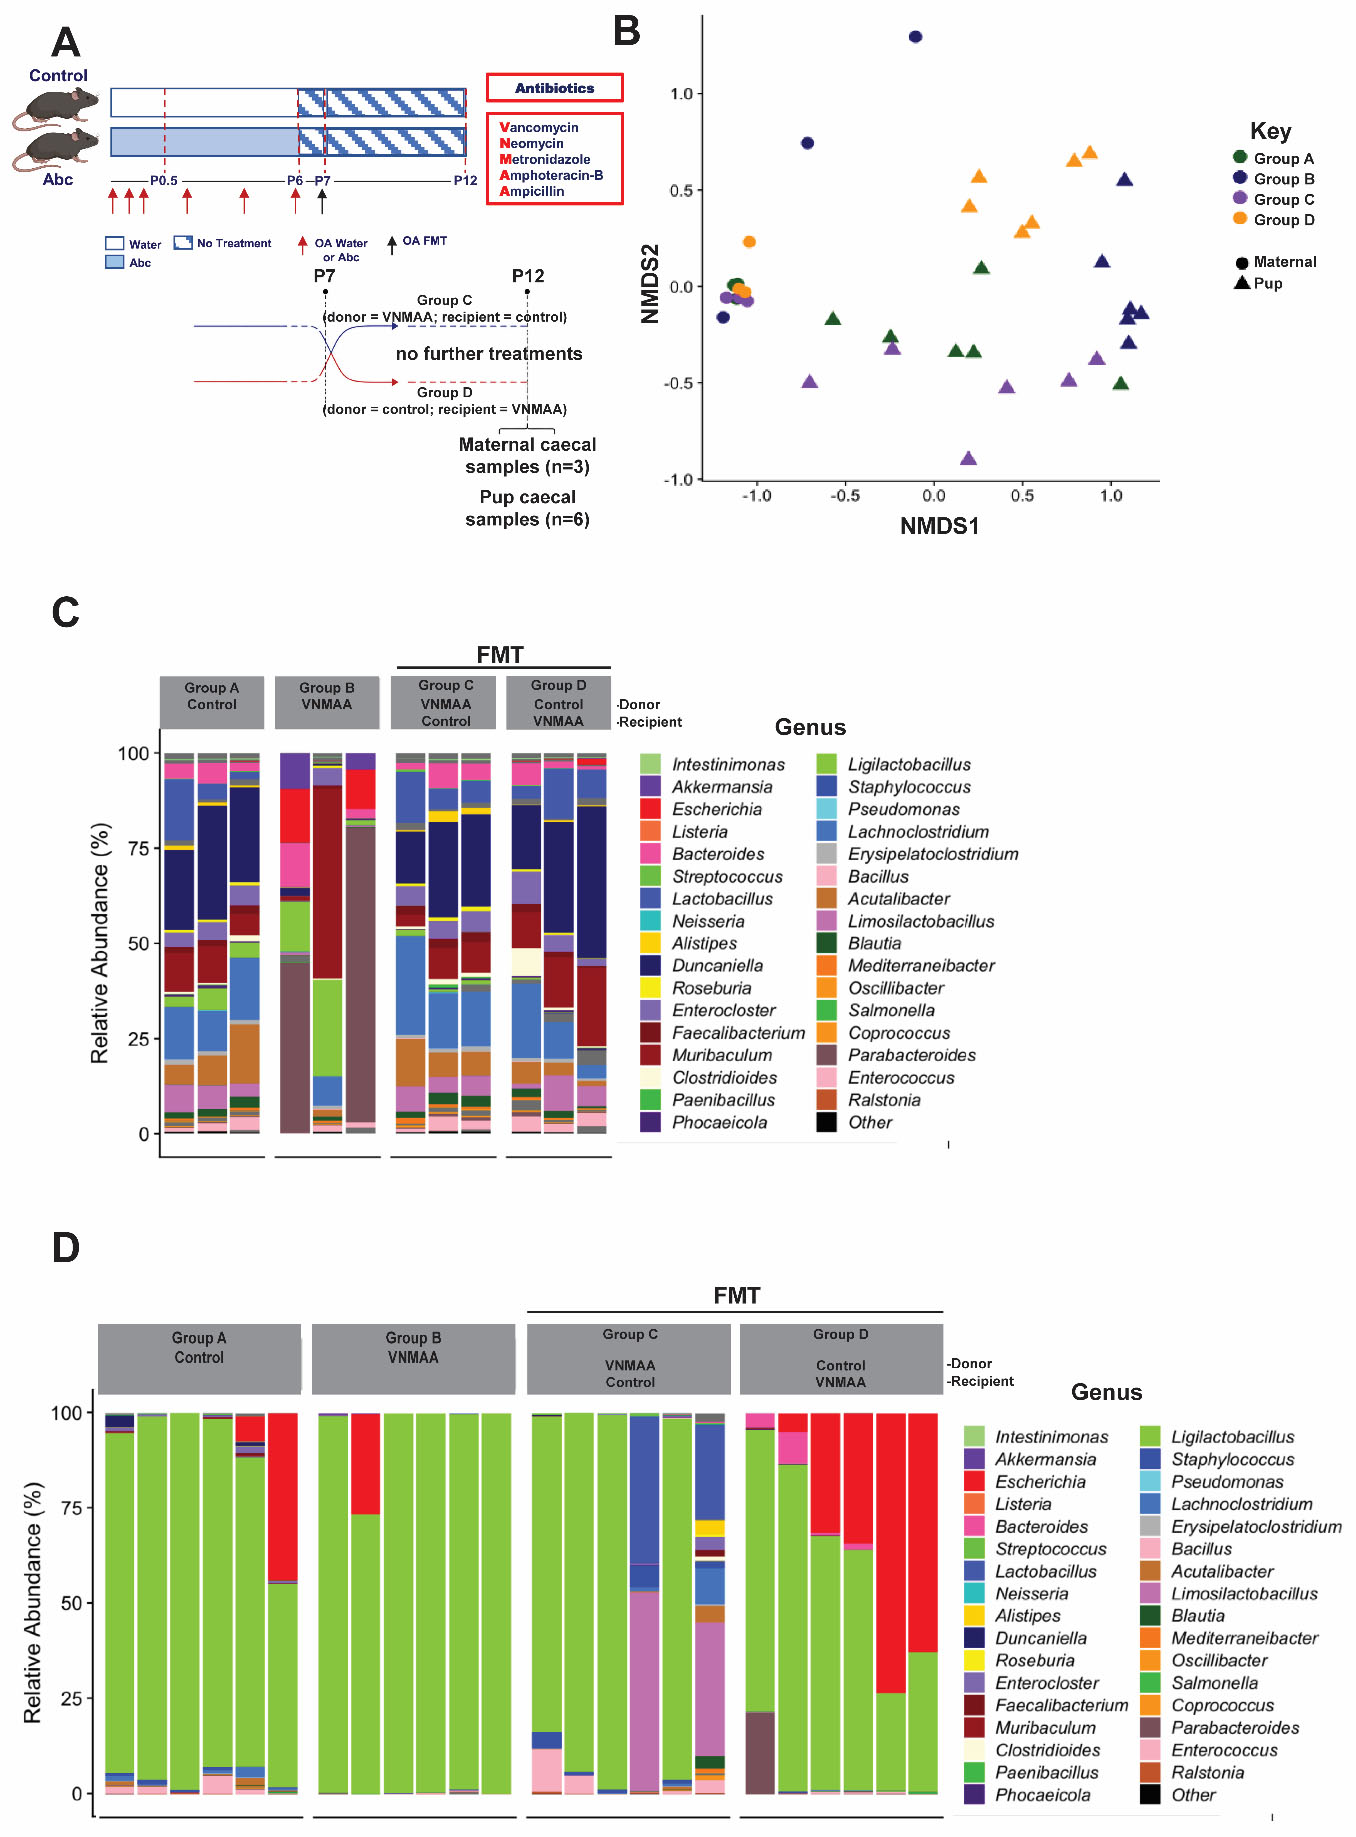
Figure 3. Maternal and pup caecal microbiome profiles following microbiome perturbation and reciprocal FMT. (A) Experimental design and sampling strategy. Dams were orally gavaged with water or VNMAA at the indicated time points during pregnancy (red arrows). Dams and pups were orally administered water or VNMAA from P0.5 to P6 at the indicated time points (red arrows). VNMAA consisted of vancomycin, neomycin, metronidazole, amphotericin B, and ampicillin. At P7, reciprocal FMT was performed (black arrow), with VNMAA microbiota (donor) transferred to control (recipient) dams and control microbiota (donor) transferred to VNMAA-treated (recipient) dams. No further treatments were administered after FMT. Maternal and pup caecal samples were collected at P12 for whole-genome shotgun sequencing. Created in BioRender. Robinson, S. (2026) https://BioRender.com/sl9ns64; (B) NMDS ordination of genus-level microbial community profiles from maternal and pup caecal samples. Samples are coloured according to experimental group and symbols distinguish maternal from pup samples; (C) Genus-level relative abundance profiles of maternal caecal microbiota across control, VNMAA-treated, and reciprocal FMT groups. A total of three maternal caecal samples per treatment group were analysed; (D) Genus-level relative abundance profiles of P12 pup caecal microbiota across the corresponding experimental groups. A total of six pup caecal samples per treatment group were analysed. The genus-level profiles (C and D) showed visually distinct microbial compositions among the maternal treatment groups; however, PERMANOVA analyses did not identify a statistically significant overall difference in community composition across the four groups (P = 0.186). The limited number of maternal samples (n = 3 per group) may have reduced the power to detect treatment-associated differences. In contrast, maternal and P12 pup caecal communities differed significantly at the community level (PERMANOVA, P < 0.001), with pup profiles generally showing more limited and variable community composition. Given the limited sample size, these microbiome data are therefore presented as descriptive and hypothesis-generating, rather than as evidence for treatment-specific community restructuring, individual causal taxa, or definitive FMT engraftment. NMDS: Non-metric multidimensional scaling; FMT: faecal microbiota transplantation; PERMANOVA: permutational multivariate analysis of variance.
Non-metric multidimensional scaling (NMDS) analysis demonstrated a clear separation between maternal and P12 pup caecal microbial communities [Figure 3B]. PERMANOVA confirmed a significant difference in overall community composition between maternal and pup samples (P < 0.001). In contrast, PERMANOVA comparison of the four maternal experimental groups did not identify a statistically significant difference in overall community structure (P = 0.186). Given the limited number of microbiome samples, these analyses were considered descriptive and hypothesis-generating.
Genus-level relative abundance profiles revealed variation in the composition of individual maternal samples across the experimental groups [Figure 3C]. Control dams displayed diverse genus-level communities, whereas VNMAA-treated dams showed marked changes in the relative representation of several genera. Maternal samples following reciprocal FMT also displayed variable community profiles. Notably, control dams receiving VNMAA-associated FMT did not show a wholesale recapitulation of the microbial profile observed in VNMAA-treated dams, whereas VNMAA-treated dams receiving control FMT showed profiles that differed from those of VNMAA-treated donors. These observations are consistent with FMT modifying the recipient microbial community without simply reproducing the donor-associated VNMAA state, although antibiotic carry-over into the FMT inoculum was not directly quantified and donor microbiota engraftment was not independently assessed. The small number of maternal samples (n = 3 per group) precludes robust inference regarding treatment-specific restructuring of the maternal microbiome.
P12 pup caecal communities were comparatively limited in complexity and were dominated by a smaller number of genera, particularly Intestinimonas and, in some samples, Escherichia [Figure 3D]. Pup profiles did not reproduce the broader variation observed across maternal communities, and individual pup samples showed considerable variability within experimental groups. Thus, at the P12 time point examined, the pup caecal microbiome did not show a clear treatment-associated pattern corresponding to the retinal vascular phenotype.
Together, these data demonstrate a marked difference between maternal and pup caecal community structure at P12, while providing insufficient evidence to conclude that the four maternal experimental groups differed significantly in overall microbiome composition. The genus-level profiles are therefore best interpreted as descriptive evidence of microbial community variation rather than evidence for specific treatment-associated taxa or definitive FMT engraftment. Importantly, these findings do not exclude contributions from earlier offspring colonisation, mucosal-associated microbial communities, circulating microbial products, or maternally derived metabolites. The marked distinction between maternal and pup microbial communities, together with the absence of a significant overall treatment effect in the microbiome dataset, therefore supported a shift in focus toward maternally derived signals during lactation.
Maternal microbial state is associated with differences in milk metabolite profiles
The FMT experiments demonstrated that altering the maternal microbial state was associated with changes in neonatal retinal angiogenesis. However, because P12 pup caecal communities were comparatively limited and did not reproduce the broader variation observed in maternal communities, we considered whether maternal microbial state might influence offspring vascular development through maternally derived factors, while recognising that direct effects of altered offspring microbial exposure cannot be excluded. Given the dependence of neonatal pups on maternal milk during this developmental window, we next examined whether maternal microbial state was associated with changes in milk metabolite composition.
To test this, we performed targeted metabolomic profiling of maternal milk collected at P12 using the Biocrates MxP® Quant 500 platform. Metabolite-level pathway analysis identified differences mapping to several metabolic pathways in the comparison between control and VNMAA milk samples, with glycerophospholipid metabolism among the most prominent metabolic signatures. Additional enriched pathways included glutathione metabolism, D-glutamine and D-glutamate metabolism, nitrogen metabolism, arginine and proline metabolism, tryptophan metabolism, arachidonic acid metabolism, glycerolipid metabolism, primary bile acid biosynthesis, biosynthesis of unsaturated fatty acids, and other amino acid- and nucleotide-associated pathways [Figure 4A].
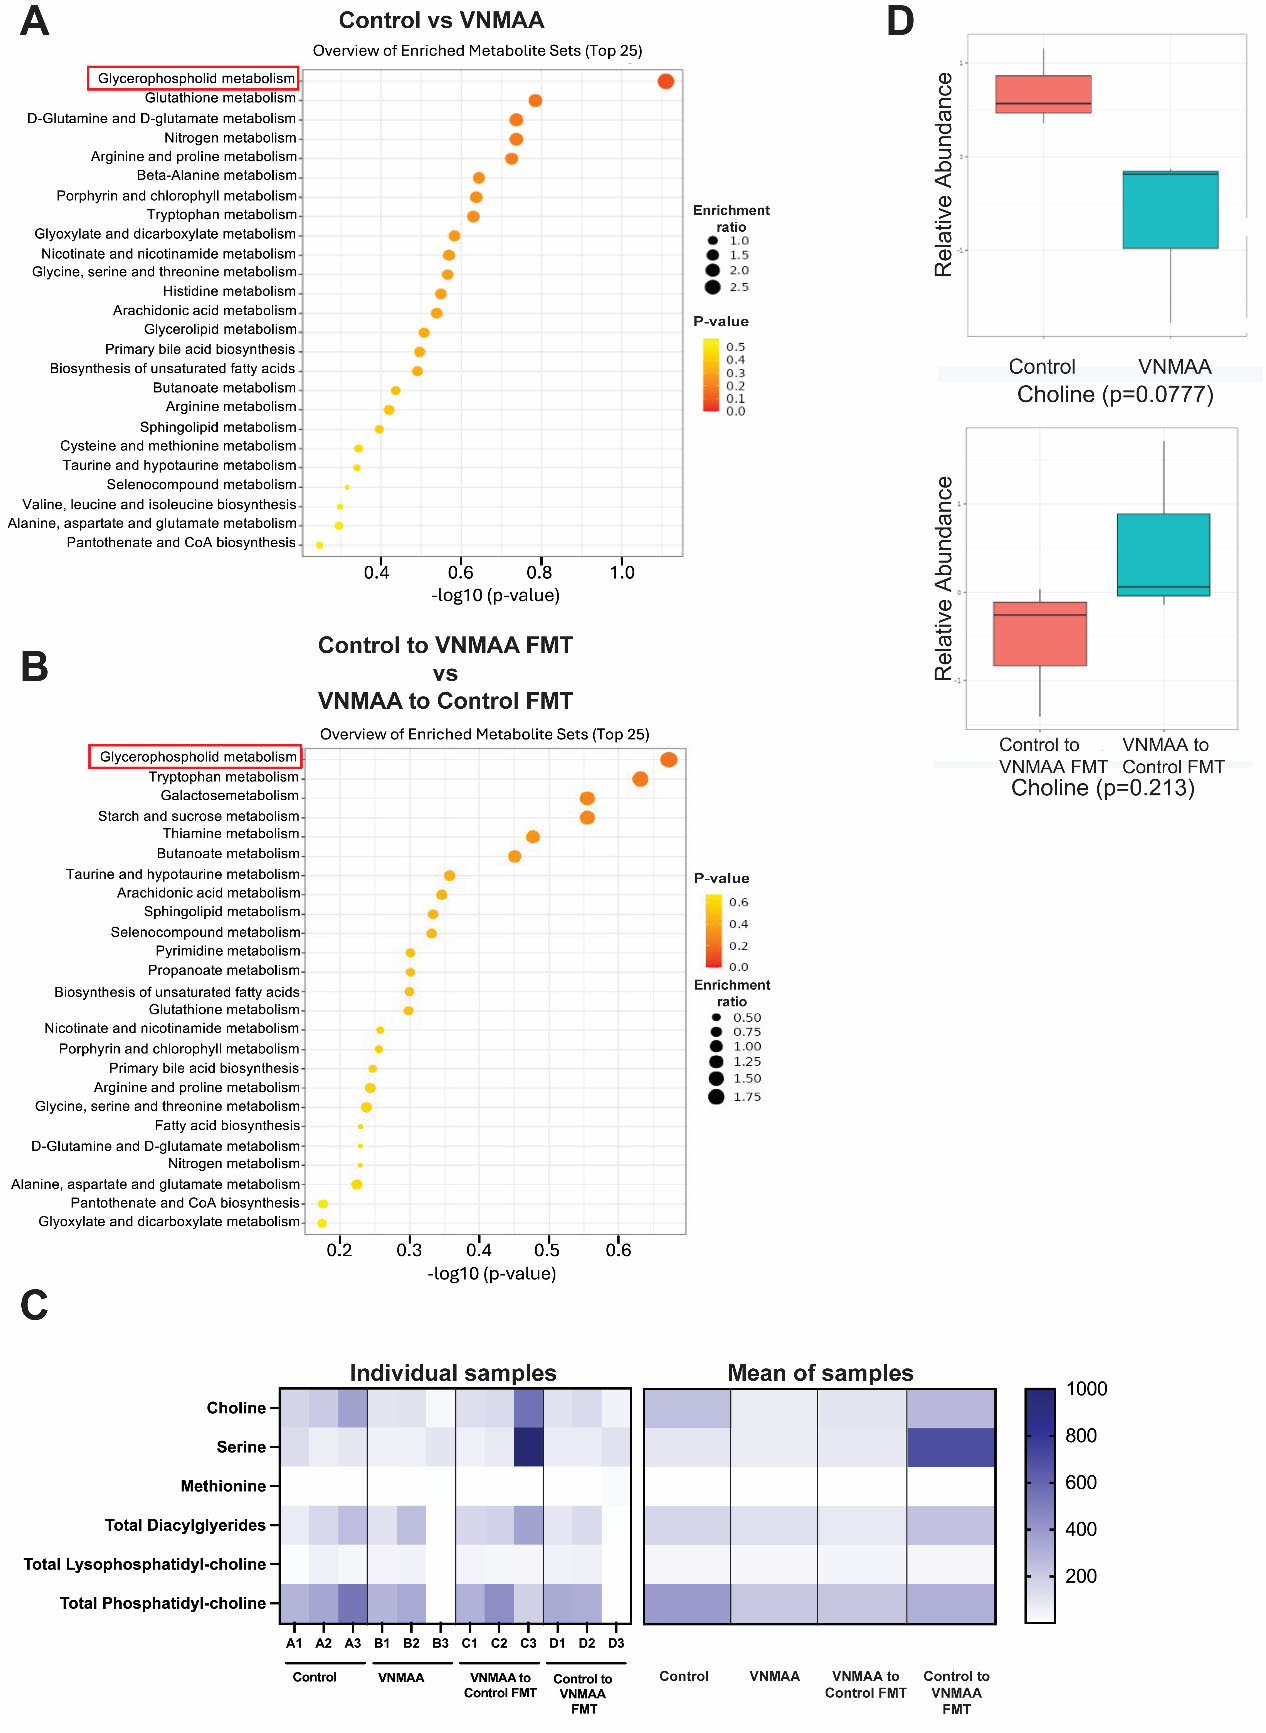
Figure 4. Maternal milk metabolomic profiling identifies recurrent glycerophospholipid-associated metabolic signatures and choline as an exploratory candidate. (A) Pathway enrichment analysis of maternal milk metabolomic data comparing control and VNMAA-treated dams. Milk samples collected at P12 were analysed using the Biocrates MxP® Quant 500 targeted metabolomics platform, incorporating flow injection analysis-tandem mass spectrometry and liquid chromatography-tandem mass spectrometry. The top 25 enriched metabolite sets are shown; dot position indicates -log10(P value), dot size indicates enrichment ratio, and dot colour indicates P value. Glycerophospholipid metabolism was among the most prominent metabolic signatures identified in this comparison; (B) Pathway enrichment analysis comparing the reciprocal FMT groups, control-to-VNMAA FMT and VNMAA-to-control FMT. Glycerophospholipid metabolism was again represented among the enriched metabolite sets, supporting its prioritisation for further examination as a candidate pathway associated with maternal microbial state; (C) Heatmaps showing individual sample-level abundance (left) and mean (right) of selected metabolites associated with glycerophospholipid metabolism in maternal milk, including choline, serine, methionine, total diacylglycerides, total lysophosphatidylcholine, and total phosphatidylcholine. For the individual samples, each column represents an individual milk sample, with samples grouped according to experimental condition; colour intensity represents metabolite abundance according to the scale shown; (D) Choline abundance in maternal milk for the control versus VNMAA comparison (top) and reciprocal FMT comparison (bottom). Box plots show the distribution of individual samples in each comparison. Choline abundance was lower in VNMAA-treated dams than controls, although this difference did not reach statistical significance (P = 0.0777). Choline abundance also did not differ significantly between the reciprocal FMT groups (P = 0.2131). Choline was therefore considered an exploratory candidate metabolite within the broader glycerophospholipid-associated metabolic signature rather than a demonstrated differentially abundant or causal metabolite. VNMAA: Vancomycin, neomycin, metronidazole, amphotericin B and ampicillin; FMT: faecal microbiota transplantation.
Glycerophospholipid metabolism was also represented among the enriched metabolite sets in the reciprocal FMT comparison, in which control-to-VNMAA FMT was compared with VNMAA-to-control FMT [Figure 4B]. Although several metabolic pathways were identified across the comparisons, glycerophospholipid metabolism was prioritised because it recurred in both the VNMAA versus control and reciprocal FMT comparisons. This recurrence provided greater support for an association with maternal microbial state than pathways identified in only a single comparison. These analyses represent metabolite-level pathway signatures and do not demonstrate altered pathway activity.
We next examined individual metabolites associated with glycerophospholipid metabolism. The heatmap showed sample-level profiles for choline, serine, methionine, total diacylglycerides, total lysophosphatidylcholine, and total phosphatidylcholine, illustrating variability in metabolite abundance across individual milk samples and experimental groups [Figure 4C]. Choline was of particular interest because of its established roles in glycerophospholipid metabolism, phosphatidylcholine synthesis, membrane biosynthesis, and cellular function. However, choline did not reach statistical significance in either the control versus VNMAA comparison (P = 0.0777) or the reciprocal FMT comparison (P = 0.2131) [Figure 4D]. Thus, choline was not a significantly differentially abundant metabolite in the present dataset. Rather, it was considered a biologically plausible candidate within the repeatedly identified glycerophospholipid-associated metabolic signature and was selected for subsequent functional testing.
Together, these findings identify maternal milk metabolism as a potential link between maternal microbial state and neonatal vascular development. However, the metabolomic analyses provide pathway-level evidence of differences in milk metabolite profiles rather than evidence of altered pathway activity or a single causal metabolite. The subsequent endothelial experiments were therefore designed to test the biological plausibility and endothelial activity of choline rather than establish that it mediates the in vivo retinal phenotype.
Because maternal milk was sampled only at P12, these metabolomic data cannot establish that the observed differences in milk metabolite composition were present during the earlier P6 vascular phenotype. The milk metabolomic findings are therefore interpreted as correlative evidence of altered lactational metabolism, rather than evidence that the measured metabolites directly caused the early vascular phenotype.
Choline modulates endothelial cell metabolic activity and angiogenic behaviour in vitro
Having identified glycerophospholipid metabolism as a glycerophospholipid-associated metabolic signature in maternal milk, we next asked whether a metabolite within this pathway could directly influence endothelial cell behaviour. We focused on choline because it is a component of the glycerophospholipid pathway identified in the milk metabolomic analysis and has established roles in phospholipid metabolism, membrane biosynthesis, and cellular function. We therefore tested whether choline could modulate endothelial metabolic activity and angiogenic capacity in vitro. HUVECs were used as a well-established primary human endothelial model to test endothelial responsiveness to choline rather than as a model of retinal endothelium. Choline-free medium was used to minimise background choline availability and permit controlled concentration-response experiments. The concentration range was selected to define endothelial responses across a broad experimental range and was not intended to imply that all concentrations represent physiological neonatal exposure.
HUVECs were treated with increasing concentrations of choline, with VEGF included as a positive pro-angiogenic control and suramin as a negative control. Choline exposure altered endothelial metabolic activity across the concentration range tested, although the magnitude and direction of the response varied with concentration. VEGF produced the expected increase in metabolic activity, while choline treatment produced measurable effects on endothelial metabolic activity [Figure 5A].
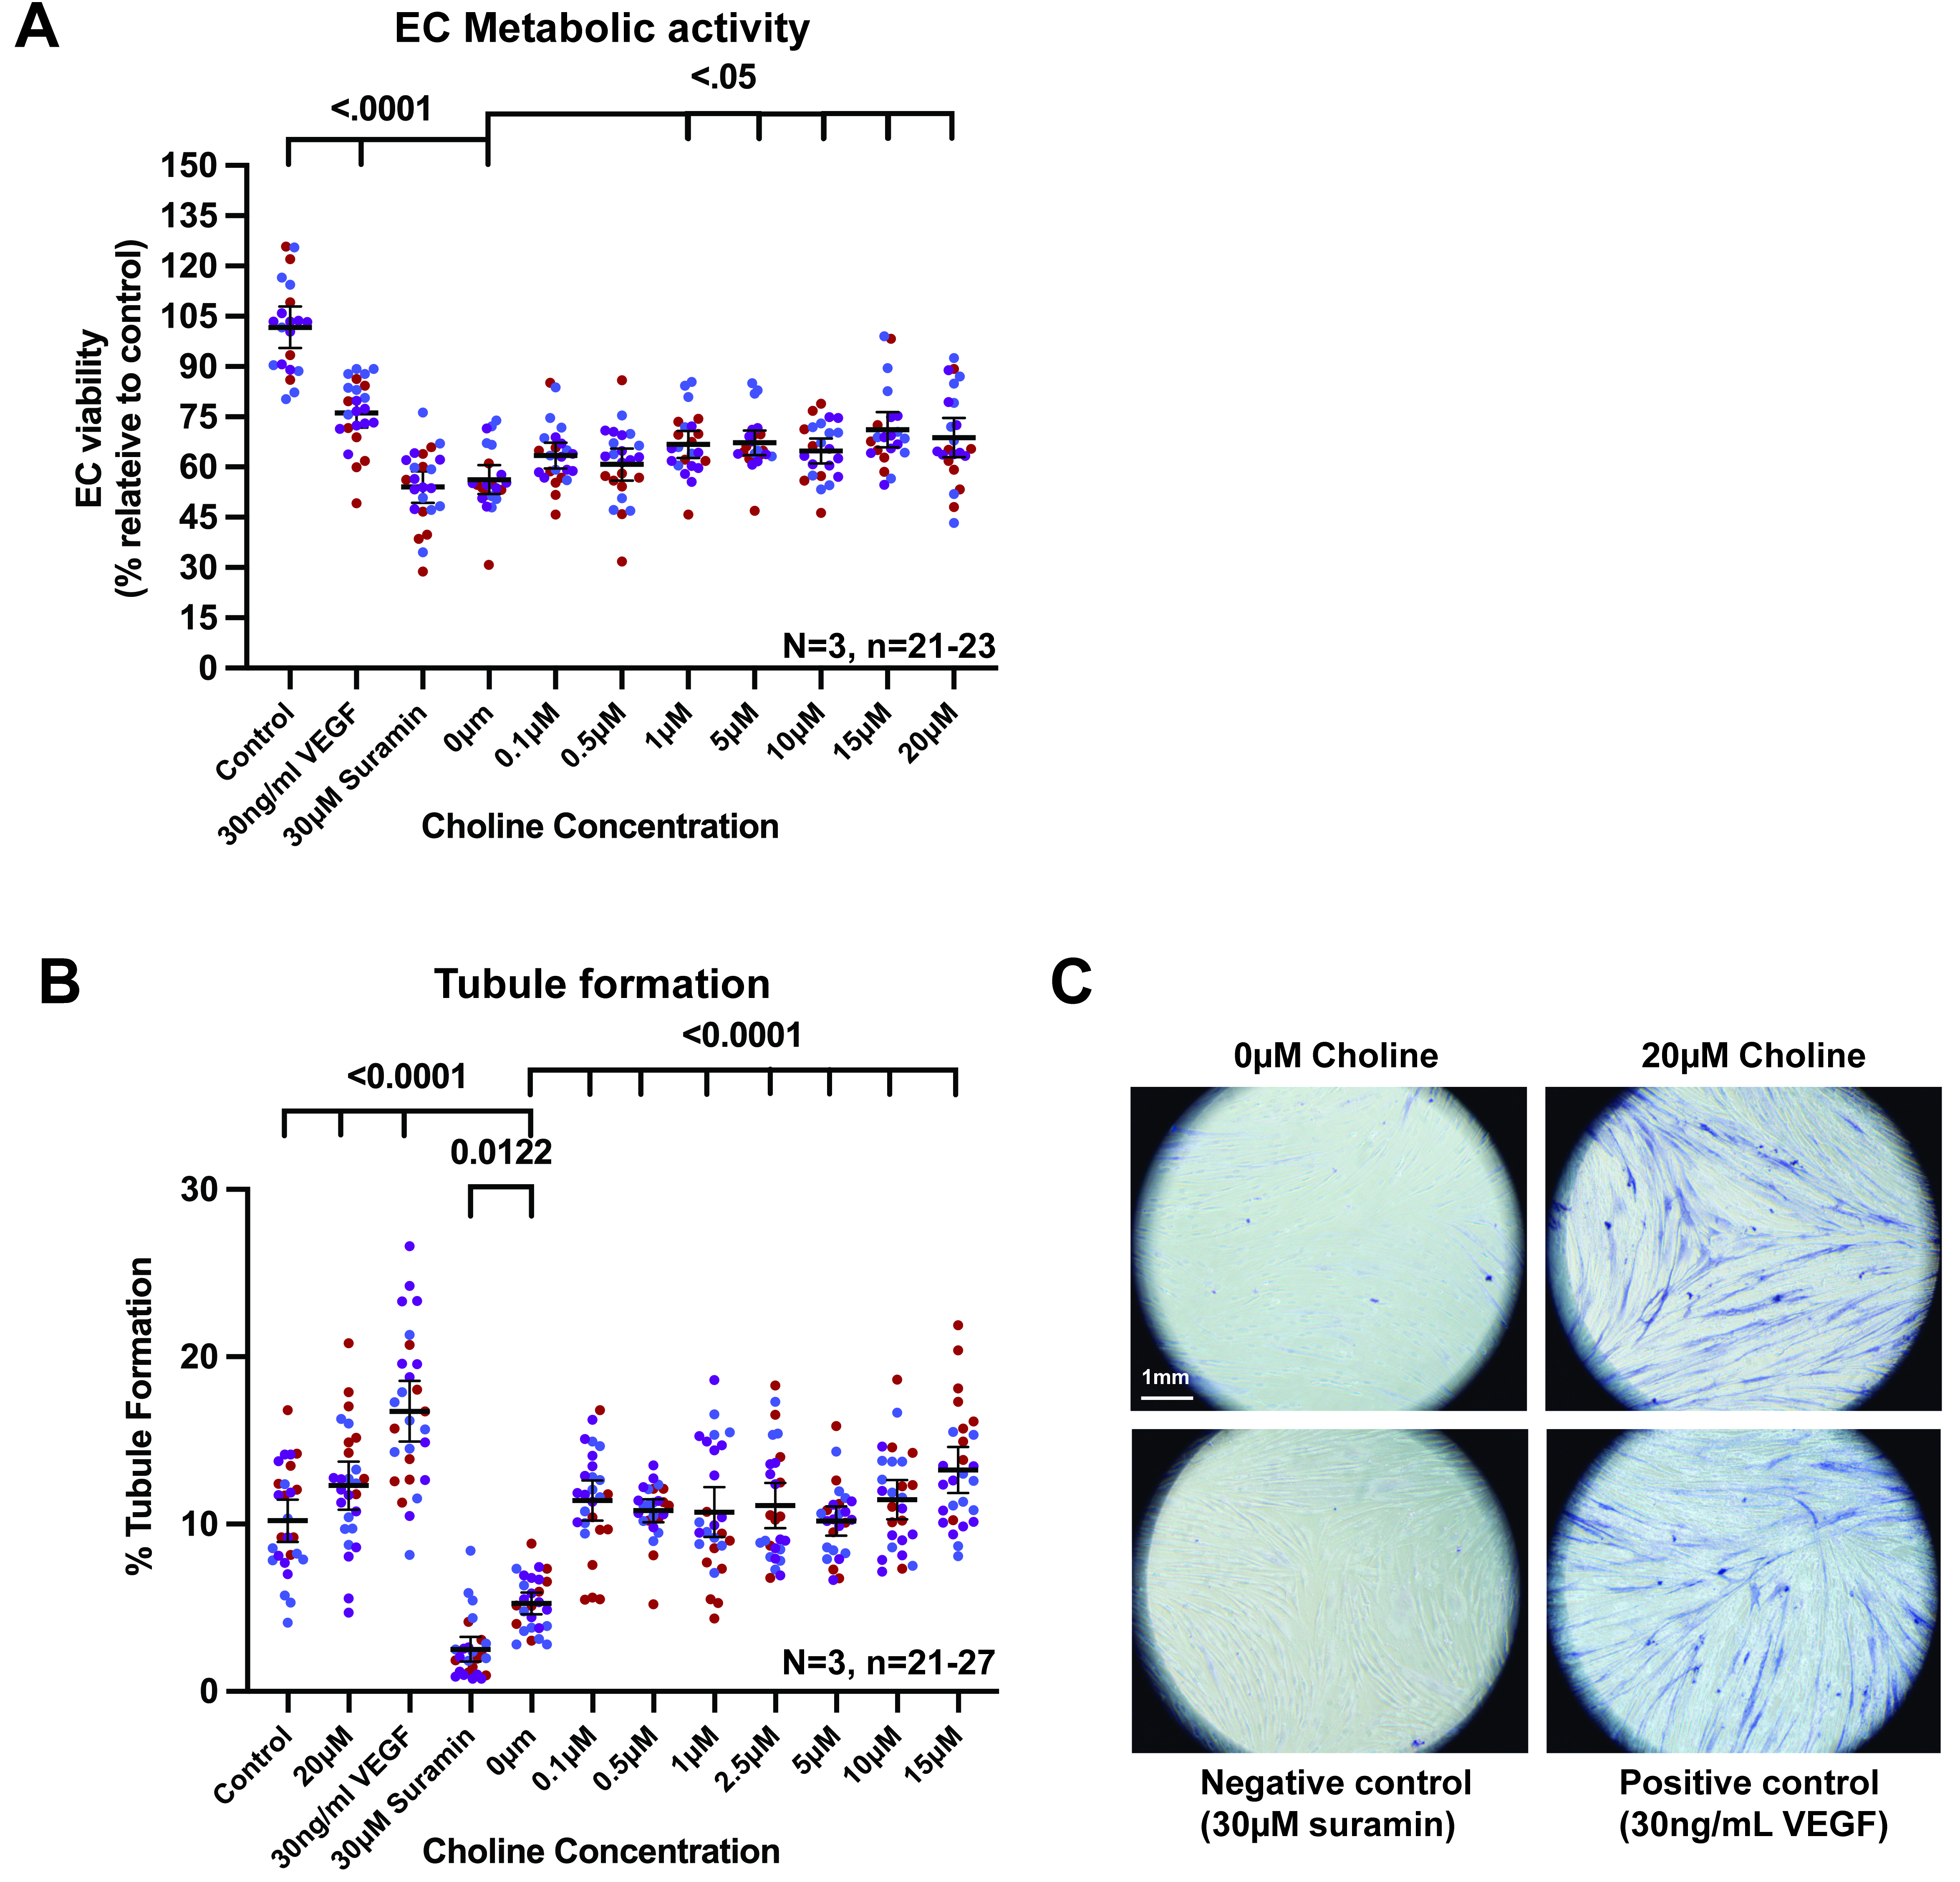
Figure 5. Choline modulates endothelial metabolic activity and promotes angiogenic tubule formation in vitro. (A) Endothelial metabolic activity following treatment with increasing concentrations of choline. HUVECs were treated with 0, 0.1, 0.5, 1, 2.5, 5, 10, 15, or 20 µM choline, with untreated control cells, 30 ng/mL VEGF, and 30 µM suramin included as assay controls. Metabolic activity was measured using the CellTiter 96 AQueous One Solution MTS assay and expressed relative to untreated control. Each colour represents an independent biological repeat and each point represents an individual analysed well; black horizontal lines indicate the mean ± 95% CI; n = 21-23 wells from N = 3 independent biological repeats; (B) Quantification of endothelial tubule formation following choline treatment using an HDF/HUVEC co-culture assay. Cells were treated with the indicated choline concentration range, with untreated control, 30 ng/mL VEGF as a positive control, and 30 µM suramin as a negative control. Tubule formation is expressed as percentage tubule formation across the well. Each colour represents an independent biological repeat and each point represents an individual analysed well; black horizontal lines indicate the mean ± 95% CI; n = 21-27 wells from N = 3 independent biological repeats. VEGF increased tubule formation whereas suramin reduced network formation. Choline increased tubule formation relative to 0 µM choline; (C) Representative images from the HDF/HUVEC tubule formation assay showing 0 µM choline, 20 µM choline, 30 µM suramin, and 30 ng/mL VEGF conditions. More extensive tubule-like endothelial networks are visible in the 20 µM choline and VEGF-treated conditions, whereas network formation is reduced in the 0 µM choline and suramin-treated conditions. Scale bar, 1 mm. Statistically significant P values are indicated on the graphs. Comparisons for which no P value is shown were not statistically significant. VEGF: Vascular endothelial growth factor; CI: confidence interval; HDF: human dermal fibroblast; HUVEC: human umbilical vein endothelial cell; MTS: 3-(4,5-dimethylthiazol-2-yl)-5-(3-carboxymethoxyphenyl)-2-(4-sulfophenyl)-2H-tetrazolium.
We next assessed whether choline could influence endothelial morphogenesis using an HDF-HUVEC co-culture tubule formation assay. Compared with untreated controls, choline increased tubule formation, with 20 µM choline producing a significant increase in network formation [Figure 5B]. Representative images showed more extensive tubule-like structures in choline-treated cultures compared with untreated controls, while suramin reduced tubule formation and VEGF enhanced network formation as expected [Figure 5C].
These findings demonstrate that choline can modulate endothelial cell behaviour in vitro, providing functional support for its consideration as a candidate metabolite within the microbiome-sensitive glycerophospholipid pathway identified in maternal milk. However, these experiments do not establish that the concentrations tested reproduce choline exposure in the developing retina, nor do they establish that choline is sufficient to restore retinal angiogenesis in vivo. They also do not exclude contributions from other milk metabolites altered by maternal microbiome perturbation. Rather, these findings provide proof-of-principle that a metabolite within a maternal milk metabolic pathway associated with microbiome perturbation can influence endothelial behaviours relevant to angiogenesis.
Discussion
This study demonstrates an association between perinatal microbiome perturbation and neonatal retinal vascular development. Perinatal microbiome depletion delayed early radial vascular expansion at P6 and was associated with persistent abnormalities in vascular architecture at P12, particularly within the deeper retinal vascular compartments. Similar vascular abnormalities were observed in germ-free animals, while reciprocal FMT modified the offspring vascular phenotype, supporting a role for the maternal microbial environment in shaping neonatal vascular development. However, because pups also received VNMAA during the experimental period, these findings do not establish a maternal microbiome-only effect. Rather, they support an association between perinatal microbiome perturbation and altered neonatal angiogenesis. By integrating retinal vascular phenotyping with maternal and pup metagenomics, maternal milk metabolomic profiling, and endothelial functional assays, our findings generate a proposed model in which microbiome-associated changes in maternal milk metabolism may contribute to neonatal vascular development.
A key feature of the phenotype was its temporal and compartment-specific nature. Microbiome perturbation reduced superficial vascular extension at P6, but this difference was no longer evident by P12. However, recovery of radial outgrowth did not equate to complete normalisation of retinal vascular development. Instead, microbiome-perturbed animals showed persistent defects in deeper vascular compartments, including reduced deep plexus vessel density, altered descending branch density, and altered branching complexity after normalisation to vessel density. This pattern suggests that perinatal microbiome perturbation may affect the transition from early superficial expansion to later three-dimensional vascular plexus maturation rather than causing a uniform arrest of angiogenesis.
This distinction is biologically important because deep plexus formation requires coordinated endothelial sprouting, vertical migration, remodelling and adaptation to the metabolic demands of the developing neural retina[5-10]. These processes depend on regulation of endothelial proliferation, migration, membrane remodelling and branching, consistent with the broader importance of endothelial metabolism in angiogenesis[13-18]. The selective persistence of abnormalities within the deeper vascular compartment may therefore reflect differences in the metabolic or cellular requirements of later vascular maturation.
The metagenomic data helped distinguish community-level differences between maternal and offspring microbiomes. NMDS demonstrated marked separation between maternal and P12 pup caecal communities, supported by PERMANOVA, whereas the four maternal experimental groups did not show a significant difference in overall community composition. Genus-level profiles nevertheless revealed substantial inter-individual variation, including differences between individual maternal samples and comparatively limited P12 pup communities. These findings indicate that the maternal and developing offspring microbial environments were distinct at P12, but do not establish that differences in caecal community composition explain the retinal phenotype. The microbiome data therefore provided context for the subsequent investigation of maternally derived metabolic signals rather than identifying a specific microbial driver.
The reciprocal FMT experiments provide complementary functional evidence that maternal microbial state can modify offspring vascular development. Restoration of control microbiota to VNMAA-treated dams improved offspring retinal vascular density, whereas transfer of VNMAA-associated microbiota to control dams shifted offspring vascular density towards the VNMAA-associated phenotype. Because FMT is a community-level intervention, these effects are consistent with a role for the maternal microbial environment but do not identify the responsible organisms, microbial products, or specific maternal pathways.
Together with the timing of retinal vascular development, these findings prompted investigation of maternal milk as one potential interface between maternal microbial state and neonatal vascular development. Mouse retinal angiogenesis occurs largely during the early postnatal period, when pups remain dependent on maternal milk, and maternal microbiota can influence offspring development through maternally mediated microbial and metabolic signals[24-30]. Our study does not demonstrate exclusive transmission through milk, but provides a rationale for examining lactational metabolism as a potential component of the relationship between maternal microbial state and neonatal vascular development.
Targeted milk metabolomic profiling identified several metabolic signatures, with glycerophospholipid metabolism recurring in both the VNMAA versus control and reciprocal FMT comparisons. This recurrence provided the rationale for prioritising glycerophospholipid metabolism over pathways identified in only a single comparison. Other pathways, including tryptophan metabolism, were also identified, indicating that the metabolic consequences of microbiome perturbation were likely multifactorial. Glycerophospholipid metabolism is biologically relevant to endothelial function because vascular growth requires membrane expansion, phospholipid turnover and lipid-mediated signalling. These findings therefore identify a microbiome-associated metabolic signature that is biologically plausible in the context of vascular development, while representing metabolite-level pathway signatures rather than evidence of altered pathway activity.
Within this metabolic landscape, choline was selected for functional investigation because of its position within glycerophospholipid metabolism and its established roles in phosphatidylcholine synthesis, membrane biogenesis, one-carbon metabolism, lipid transport and cellular function[43-47]. Developmental tissues have high requirements for membrane synthesis and methyl-group metabolism, and previous studies have linked maternal choline availability with developmental angiogenesis and retinal development[48,50]. Choline insufficiency has also been associated with impaired trophoblast function and in vitro vascularisation[51], providing biological plausibility for investigating this metabolite in developmental vascular biology.
Importantly, choline itself was not significantly different between control and VNMAA milk or between the reciprocal FMT groups. It should therefore not be considered a demonstrated differentially abundant metabolite. Rather, it was selected as a biologically plausible candidate within a repeatedly identified glycerophospholipid-associated metabolic signature.
Our endothelial assays provided functional proof-of-principle that choline can influence endothelial behaviour. HUVECs were used as a reproducible primary human endothelial model rather than as a direct model of retinal endothelium. Choline altered endothelial metabolic activity and promoted endothelial tubule formation in vitro, consistent with the importance of phosphatidylcholine metabolism in endothelial cells[49] and the wider role of endothelial metabolism in angiogenesis[13-18]. These findings support biological activity of choline in endothelial cells but do not establish physiological retinal exposure, in vivo sufficiency, or a causal role in the retinal phenotype.
The findings may have broader implications for early-life vascular programming. The retina provides a tractable model of physiological angiogenesis, while vascular development is fundamental to tissue oxygenation, nutrient delivery and metabolic homeostasis. Within the developmental origins of health and disease framework, vascular development may therefore represent an intermediary process linking maternal exposures to later cardiometabolic or neurovascular outcomes. This remains speculative, however, and the present study does not establish long-term functional consequences.
The retinal context may also have disease relevance. Although the present study addresses physiological retinal angiogenesis rather than human retinal disease, developmental vascularisation is relevant to disorders in which vascular maturation is disrupted, including retinopathy of prematurity. The current findings do not establish that maternal microbiome or milk metabolite variation contributes to such disorders in humans, but they raise the possibility that maternal microbial and metabolic exposures could influence developmental vascular resilience. Emerging literature has linked the gut microbiome and microbial metabolites with retinal vascular disease and retinopathy of prematurity[64-66]. This hypothesis will require validation in human cohorts and disease-relevant experimental models, including models of oxygen-induced retinopathy, to determine whether maternal microbiome-associated metabolic signalling affects vascular regression, repair, or pathological neovascularisation.
Overall, the study identifies an association between perinatal microbiome perturbation and neonatal retinal vascular development and provides convergent evidence from reciprocal FMT, maternal milk metabolomics and endothelial assays for a proposed microbiota-milk metabolite-vascular relationship. Glycerophospholipid-associated milk metabolism, and choline in particular, emerge as candidates for further investigation, but the data do not establish a single causal metabolite or direct milk-to-retina pathway.
Limitations
Several limitations should be acknowledged. First, although the neonatal mouse retina is an established and tractable model of developmental angiogenesis, it may not represent all vascular beds or developmental contexts. Mouse retinal vascularisation occurs postnatally, whereas many human vascular beds develop prenatally, and the retinal neurovascular niche has specialised cellular and metabolic features. The findings should therefore be extrapolated cautiously to other organs, developmental windows and species.
Second, the number of independent litters and dams was modest, particularly for the microbiome and FMT experiments. Although nested analysis accounted for the hierarchical structure of the data and biological repeats were explicitly represented, the limited number of independent biological units reduces statistical power and limits the precision with which the findings can be generalised. Because pups also received VNMAA, the study does not establish a maternal microbiome-only effect, and antibiotic treatment may have microbiota-independent effects on maternal metabolism, milk composition or neonatal physiology. Germ-free animals and reciprocal FMT provide complementary evidence but do not eliminate these possibilities. Larger studies incorporating more independently housed litters and defined gnotobiotic or microbial add-back approaches will be required for stronger causal resolution.
Third, the microbiome sequencing data were limited in sample size and should therefore be interpreted as descriptive and hypothesis-generating. The analyses do not provide sufficient power to resolve cage effects, litter effects, inter-individual variation or specific treatment-associated taxa. Donor microbiota engraftment following FMT was not independently assessed, and antibiotic carry-over into the FMT inoculum was not directly quantified. The pup data also do not exclude contributions from earlier colonisation events, mucosal-associated communities, microbial products or circulating microbial metabolites. Larger, cage-balanced studies incorporating longitudinal sampling and direct assessment of donor engraftment will be required to address these possibilities.
Fourth, milk metabolomic profiling was performed at P12, whereas the earliest vascular phenotype was detected at P6. Consequently, we cannot determine whether the metabolic differences identified at P12 were already present during the earlier phase of vascular development. Furthermore, milk metabolite abundance does not necessarily equate to neonatal tissue exposure, and we did not directly demonstrate transfer of specific metabolites from milk to pups or their subsequent availability to retinal endothelial cells. Longitudinal analysis of maternal milk, maternal and pup serum, and retinal metabolite exposure will therefore be required to establish temporal relationships and biological availability.
Fifth, the metabolomic findings provide pathway-level rather than causal evidence. Although glycerophospholipid metabolism recurred across the microbiome perturbation and reciprocal FMT comparisons, choline itself was not significantly altered between experimental groups. Choline was therefore selected as a biologically plausible candidate rather than a demonstrated causal metabolite. Targeted longitudinal quantification and in vivo supplementation or rescue experiments will be required to determine whether choline or other metabolites within the pathway contribute causally to the vascular phenotype.
Finally, the endothelial experiments provide functional proof-of-principle but do not fully recapitulate neonatal retinal vascular biology. HUVECs and HDF/HUVEC co-cultures provide controlled human endothelial models in which choline can be tested for effects on endothelial metabolic activity and angiogenic network formation, but they do not reproduce the cellular, extracellular matrix, metabolic and tissue-specific environment of the developing retina. The concentrations tested were selected to define endothelial responsiveness rather than established physiological neonatal exposure. Studies using primary retinal endothelial cells, retinal explants, direct assessment of neonatal tissue exposure and in vivo supplementation or rescue will therefore be required to establish physiological and mechanistic relevance.
Conclusion
Our findings associate perinatal microbiome perturbation with altered neonatal retinal vascular development and changes in maternal milk metabolite profiles. These observations support investigation of maternal milk metabolism as a potential link between microbial status and offspring vascular development, but do not establish metabolic mediation. Because both dams and pups received VNMAA and milk was sampled only at P12, maternal and direct neonatal contributions cannot be separated, and the relevance of the milk metabolic changes to the P6 phenotype remains unresolved. Choline was not significantly altered in either metabolomic comparison; its effects on endothelial tubule formation in vitro identify it as a candidate for further investigation rather than an established mediator in vivo.
DECLARATIONS
Acknowledgements
We would like to thank the Quadram Institute Bioimaging Facility and the Quadram Institute Sequencing Facility for their support with imaging and sequencing, respectively. We would also like to thank the Disease Modelling Unit Facility at the University of East Anglia for their assistance with the animals and a special acknowledgement to Arlaine Brion at QIB Germ-free Facility for her help with providing the germ-free animals in this study. We are grateful to Professor Lindsay Hall for her support of this study and for enabling Raymond Kiu’s contribution to the metagenomic sequencing and taxonomic profiling analyses.
Authors’ contributions
Conceptualisation: Dreger SA
Formal analyses: Dreger SA
Bioinformatics analyses: Kiu R
Investigation: Dreger SA
Resources: Robinson SD
Review and editing: Dreger SA, Robinson SD
Visualisation: Dreger SA, Robinson SD
Supervision: Robinson SD
Funding acquisition: Robinson SD
Availability of data and materials
The datasets generated and/or analysed during the current study are available from the corresponding author on reasonable request.
AI and AI-assisted tools statement
OpenAI (GPT-5.6, released 2026-07-09) was used to assist with language editing, manuscript refinement, and development of the graphical abstract. All scientific content, data interpretation, and final manuscript text were reviewed and approved by the authors, who take full responsibility for the content of the manuscript. The Graphical Abstract was subsequently edited by the authors.
Financial support and sponsorship
This work was supported by the Biotechnology and Biological Sciences Research Council (BBSRC) Institute Strategic Programme Food Microbiome and Health [BB/X011054/1] and its constituent projects [BBS/E/QU/230001A, BBS/E/QU/230001B and BBS/E/QU/230001C]. The funder had no role in the study design, collection, analysis or interpretation of data, preparation of the manuscript, or decision to submit the manuscript for publication.
Conflicts of interest
All authors declared that there are no conflicts of interest.
Ethical approval and consent to participate
All animal procedures were conducted in accordance with the UK Animals (Scientific Procedures) Act 1986 and Directive 2010/63/EU and were approved under UK Home Office project licence PP8873233 at the Disease Modelling Unit, University of East Anglia. The study involved no human participants or clinical samples, and therefore informed consent to participate was not applicable. Commercially obtained human umbilical vein endothelial cells and human dermal fibroblasts were used for in vitro experiments.
Consent for publication
Not applicable.
Copyright
© The Author(s) 2026.
REFERENCES
1. Barker DJ, Osmond C. Infant mortality, childhood nutrition, and ischaemic heart disease in England and Wales. Lancet. 1986;1:1077-81.
3. Gluckman PD, Hanson MA. Living with the past: evolution, development, and patterns of disease. Science. 2004;305:1733-6.
4. Potente M, Gerhardt H, Carmeliet P. Basic and therapeutic aspects of angiogenesis. Cell. 2011;146:873-87.
5. Fruttiger M. Development of the mouse retinal vasculature: angiogenesis versus vasculogenesis. Invest Ophthalmol Vis Sci. 2002;43:522-7.
6. Gariano RF. Cellular mechanisms in retinal vascular development. Prog Retin Eye Res. 2003;22:295-306.
7. Stahl A, Connor KM, Sapieha P, et al. The mouse retina as an angiogenesis model. Invest Ophthalmol Vis Sci. 2010;51:2813-26.
9. Zarkada G, Howard JP, Xiao X, et al. Specialized endothelial tip cells guide neuroretina vascularization and blood-retina-barrier formation. Dev Cell. 2021;56:2237-2251.e6.
10. Biswas S, Shahriar S, Bachay G, et al. Glutamatergic neuronal activity regulates angiogenesis and blood-retinal barrier maturation via Norrin/β-catenin signaling. Neuron. 2024;112:1978-1996.e6.
11. Smith LE, Wesolowski E, McLellan A, et al. Oxygen-induced retinopathy in the mouse. Invest Ophthalmol Vis Sci. 1994;35:101-11.
12. Connor KM, Krah NM, Dennison RJ, et al. Quantification of oxygen-induced retinopathy in the mouse: a model of vessel loss, vessel regrowth and pathological angiogenesis. Nat Protoc. 2009;4:1565-73.
13. De Bock K, Georgiadou M, Schoors S, et al. Role of PFKFB3-driven glycolysis in vessel sprouting. Cell. 2013;154:651-63.
14. Eelen G, de Zeeuw P, Treps L, Harjes U, Wong BW, Carmeliet P. Endothelial cell metabolism. Physiol Rev. 2018;98:3-58.
15. Engelbrecht E, MacRae CA, Hla T. Lysolipids in vascular development, biology, and disease. Arterioscler Thromb Vasc Biol. 2021;41:564-84.
17. Liu Y, Wu Z, Li Y, et al. Metabolic reprogramming and interventions in angiogenesis. J Adv Res. 2025;70:323-38.
18. Citrin KM, Chaube B, Fernández-Hernando C, Suárez Y. Intracellular endothelial cell metabolism in vascular function and dysfunction. Trends Endocrinol Metab. 2025;36:744-55.
19. Schoultz I, Claesson MJ, Dominguez-Bello MG, et al. Gut microbiota development across the lifespan: disease links and health-promoting interventions. J Intern Med. 2025;297:560-83.
20. Joyce SA, Clarke DJ. Microbial metabolites as modulators of host physiology. Elsevier; 2024. pp. 83-133.
21. Zhang D, He X, Shi Y, Chen X, Yu K, Wang S. Gut microbiota regulate atherosclerosis via the gut-vascular axis: a scoping review of mechanisms and therapeutic interventions. Front Microbiol. 2025;16:1606309.
22. Bäckhed F, Roswall J, Peng Y, et al. Dynamics and stabilization of the human gut microbiome during the first year of life. Cell Host Microbe. 2015;17:690-703.
23. Bokulich NA, Chung J, Battaglia T, et al. Antibiotics, birth mode, and diet shape microbiome maturation during early life. Sci Transl Med. 2016;8:343ra82.
24. Bogaert D, van Beveren GJ, de Koff EM, et al. Mother-to-infant microbiota transmission and infant microbiota development across multiple body sites. Cell Host Microbe. 2023;31:447-460.e6.
25. Tian M, Li Q, Zheng T, et al. Maternal microbe-specific modulation of the offspring microbiome and development during pregnancy and lactation. Gut Microbes. 2023;15:2206505.
26. Gomez de Agüero M, Ganal-Vonarburg SC, Fuhrer T, et al. The maternal microbiota drives early postnatal innate immune development. Science. 2016;351:1296-302.
27. Kimura I, Miyamoto J, Ohue-Kitano R, et al. Maternal gut microbiota in pregnancy influences offspring metabolic phenotype in mice. Science. 2020;367:eaaw8429.
28. Vuong HE, Pronovost GN, Williams DW, et al. The maternal microbiome modulates fetal neurodevelopment in mice. Nature. 2020;586:281-6.
29. Pessa-Morikawa T, Husso A, Kärkkäinen O, et al. Maternal microbiota-derived metabolic profile in fetal murine intestine, brain and placenta. BMC Microbiol. 2022;22:46.
30. Husso A, Pessa-Morikawa T, Koistinen VM, et al. Impacts of maternal microbiota and microbial metabolites on fetal intestine, brain, and placenta. BMC Biol. 2023;21:207.
31. Ballard O, Morrow AL. Human milk composition: nutrients and bioactive factors. Pediatr Clin North Am. 2013;60:49-74.
32. Wójcik M, Mojska H. Human milk metabolome: Impact of gestational age, lactational stage and maternal diet. Rocz Panstw Zakl Hig. 2022;73:139-45.
33. Calvo-Lerma J, Cabrera-Rubio R, Lerin C, et al. Comprehensive targeted and quantitative profiling of the human milk metabolome: impact of delivery mode, breastfeeding practices, and maternal diet. Mol Nutr Food Res. 2024;68:e2400424.
34. Hampel D, Shahab-Ferdows S, Kac G, Allen LH. Evaluating metabolic profiling of human milk using biocrates MxP(®) QUANT 500 assay. Metabolites. 2025;15:14.
35. Sundekilde UK, Downey E, O’Mahony JA, et al. The effect of gestational and lactational age on the human milk metabolome. Nutrients. 2016;8:304.
36. Alexandre-Gouabau MC, Moyon T, David-Sochard A, et al. Comprehensive preterm breast milk metabotype associated with optimal infant early growth pattern. Nutrients. 2019;11:528.
37. Isganaitis E, Venditti S, Matthews TJ, Lerin C, Demerath EW, Fields DA. Maternal obesity and the human milk metabolome: associations with infant body composition and postnatal weight gain. Am J Clin Nutr. 2019;110:111-20.
38. Saben JL, Sims CR, Piccolo BD, Andres A. Maternal adiposity alters the human milk metabolome: associations between nonglucose monosaccharides and infant adiposity. Am J Clin Nutr. 2020;112:1228-39.
39. Poulsen KO, Meng F, Lanfranchi E, et al. Dynamic changes in the human milk metabolome over 25 weeks of lactation. Front Nutr. 2022;9:917659.
40. Baumgartel K, Stevens M, Vijayakumar N, Saint Fleur A, Prescott S, Groer M. The human milk metabolome: a scoping literature review. J Hum Lact. 2023;39:255-77.
41. Li T, Samuel TM, Zhu Z, et al. Joint analyses of human milk fatty acids, phospholipids, and choline in association with cognition and temperament traits during the first 6 months of life. Front Nutr. 2022;9:919769.
42. Ingvordsen Lindahl IE, Artegoitia VM, Downey E, et al. Quantification of human milk phospholipids: the effect of gestational and lactational age on phospholipid composition. Nutrients. 2019;11:222.
43. Zeisel SH. Choline: critical role during fetal development and dietary requirements in adults. Annu Rev Nutr. 2006;26:229-50.
44. Sanders LM, Zeisel SH. Choline: dietary requirements and role in brain development. Nutr Today. 2007;42:181-6.
45. Dymek A, Oleksy Ł, Stolarczyk A, Bartosiewicz A. Choline-an underappreciated component of a mother-to-be’s diet. Nutrients. 2024;16:1767.
46. Mujica-Coopman MF, Paules EM, Trujillo-Gonzalez I. The role of prenatal choline and its impact on neurodevelopmental disorders. Front Nutr. 2024;11:1463983.
47. Gould JF, Hines S, Best KP, Grzeskowiak LE, Jansen O, Green TJ. Choline during pregnancy and child neurodevelopment: a systematic review of randomized controlled trials and observational studies. Nutrients. 2025;17:886.
48. Mehedint MG, Craciunescu CN, Zeisel SH. Maternal dietary choline deficiency alters angiogenesis in fetal mouse hippocampus. Proc Natl Acad Sci U S A. 2010;107:12834-9.
49. Wong JT, Chan M, Lee D, Jiang JY, Skrzypczak M, Choy PC. Phosphatidylcholine metabolism in human endothelial cells: modulation by phosphocholine. Mol Cell Biochem. 2000;207:95-100.
50. Trujillo-Gonzalez I, Friday WB, Munson CA, et al. Low availability of choline in utero disrupts development and function of the retina. FASEB J. 2019;33:9194-209.
51. Jiang X, Jones S, Andrew BY, et al. Choline inadequacy impairs trophoblast function and vascularization in cultured human placental trophoblasts. J Cell Physiol. 2014;229:1016-27.
52. Hildebrand F, Nguyen TL, Brinkman B, et al. Inflammation-associated enterotypes, host genotype, cage and inter-individual effects drive gut microbiota variation in common laboratory mice. Genome Biol. 2013;14:R4.
53. Costello SP, Conlon MA, Vuaran MS, Roberts-Thomson IC, Andrews JM. Faecal microbiota transplant for recurrent Clostridium difficile infection using long-term frozen stool is effective: clinical efficacy and bacterial viability data. Aliment Pharmacol Ther. 2015;42:1011-8.
54. Benwell CJ, Taylor JAGE, Robinson SD. Endothelial neuropilin-2 influences angiogenesis by regulating actin pattern development and α5-integrin-p-FAK complex recruitment to assembling adhesion sites. FASEB J. 2021;35:e21679.
55. McKee AM, Kirkup BM, Madgwick M, et al. Antibiotic-induced disturbances of the gut microbiota result in accelerated breast tumor growth. iScience. 2021;24:103012.
56. Chen S, Zhou Y, Chen Y, Gu J. fastp: an ultra-fast all-in-one FASTQ preprocessor. Bioinformatics. 2018;34:i884-90.
57. Wood DE, Lu J, Langmead B. Improved metagenomic analysis with Kraken 2. Genome Biol. 2019;20:257.
58. Lu J, Breitwieser FP, Thielen P, Salzberg SL. Bracken: estimating species abundance in metagenomics data. PeerJ Comput Sci. 2017;3:e104.
59. Blanco-Míguez A, Beghini F, Cumbo F, et al. Extending and improving metagenomic taxonomic profiling with uncharacterized species using MetaPhlAn 4. Nat Biotechnol. 2023;41:1633-44.
60. Beghini F, McIver LJ, Blanco-Míguez A, et al. Integrating taxonomic, functional, and strain-level profiling of diverse microbial communities with bioBakery 3. Elife. 2021:10.
61. Anderson MJ. A new method for non‐parametric multivariate analysis of variance. Austral Ecology. 2001;26:32-46.
62. Anderson MJ. Distance-based tests for homogeneity of multivariate dispersions. Biometrics. 2006;62:245-53.
63. Warton DI, Wright ST, Wang Y. Distance‐based multivariate analyses confound location and dispersion effects. Methods Ecol Evol. 2012;3:89-101.
64. Zhang JY, Greenwald MJ, Rodriguez SH. Gut microbiome and retinopathy of prematurity. Am J Pathol. 2023;193:1683-90.
65. Ciurariu E, Tirziu AT, Varga NI, et al. Short-chain fatty acids and the gut-retina connection: a systematic review. Int J Mol Sci. 2025;26:2470.
Cite This Article
 Open Access
How to Cite
Dreger SA, Kiu R, Robinson S. Perinatal microbiome perturbation alters neonatal retinal angiogenesis and maternal milk metabolism. Microbiome Res Rep. 2026;5:28. https://dx.doi.org/10.20517/mrr.2026.44
Download Citation
If you have the appropriate software installed, you can download article citation data to the citation manager of your choice. Simply select your manager software from the list below and click on download.
Export Citation File
Type of Import
Tips on Downloading Citation
Citation Manager File Format
Type of Import
Direct Import: When the Direct Import option is selected (the default state), a dialogue box will give you the option to Save or Open the downloaded citation data. Choosing Open will either launch your citation manager or give you a choice of applications with which to use the metadata. The Save option saves the file locally for later use.
Indirect Import: When the Indirect Import option is selected, the metadata is displayed and may be copied and pasted as needed.
About This Article
Copyright

Data & Comments
Data
0









Comments
Comments must be written in English. Spam, offensive content, impersonation, and private information will not be permitted. If any comment is reported and identified as inappropriate content by OAE staff, the comment will be removed without notice. If you have any queries or need any help, please contact us at [email protected].