


Impact of estimated glucose disposal rate and high-sensitivity C-reactive protein on the risk of new-onset stroke: a nationwide prospective cohort study
 0
0 
Abstract
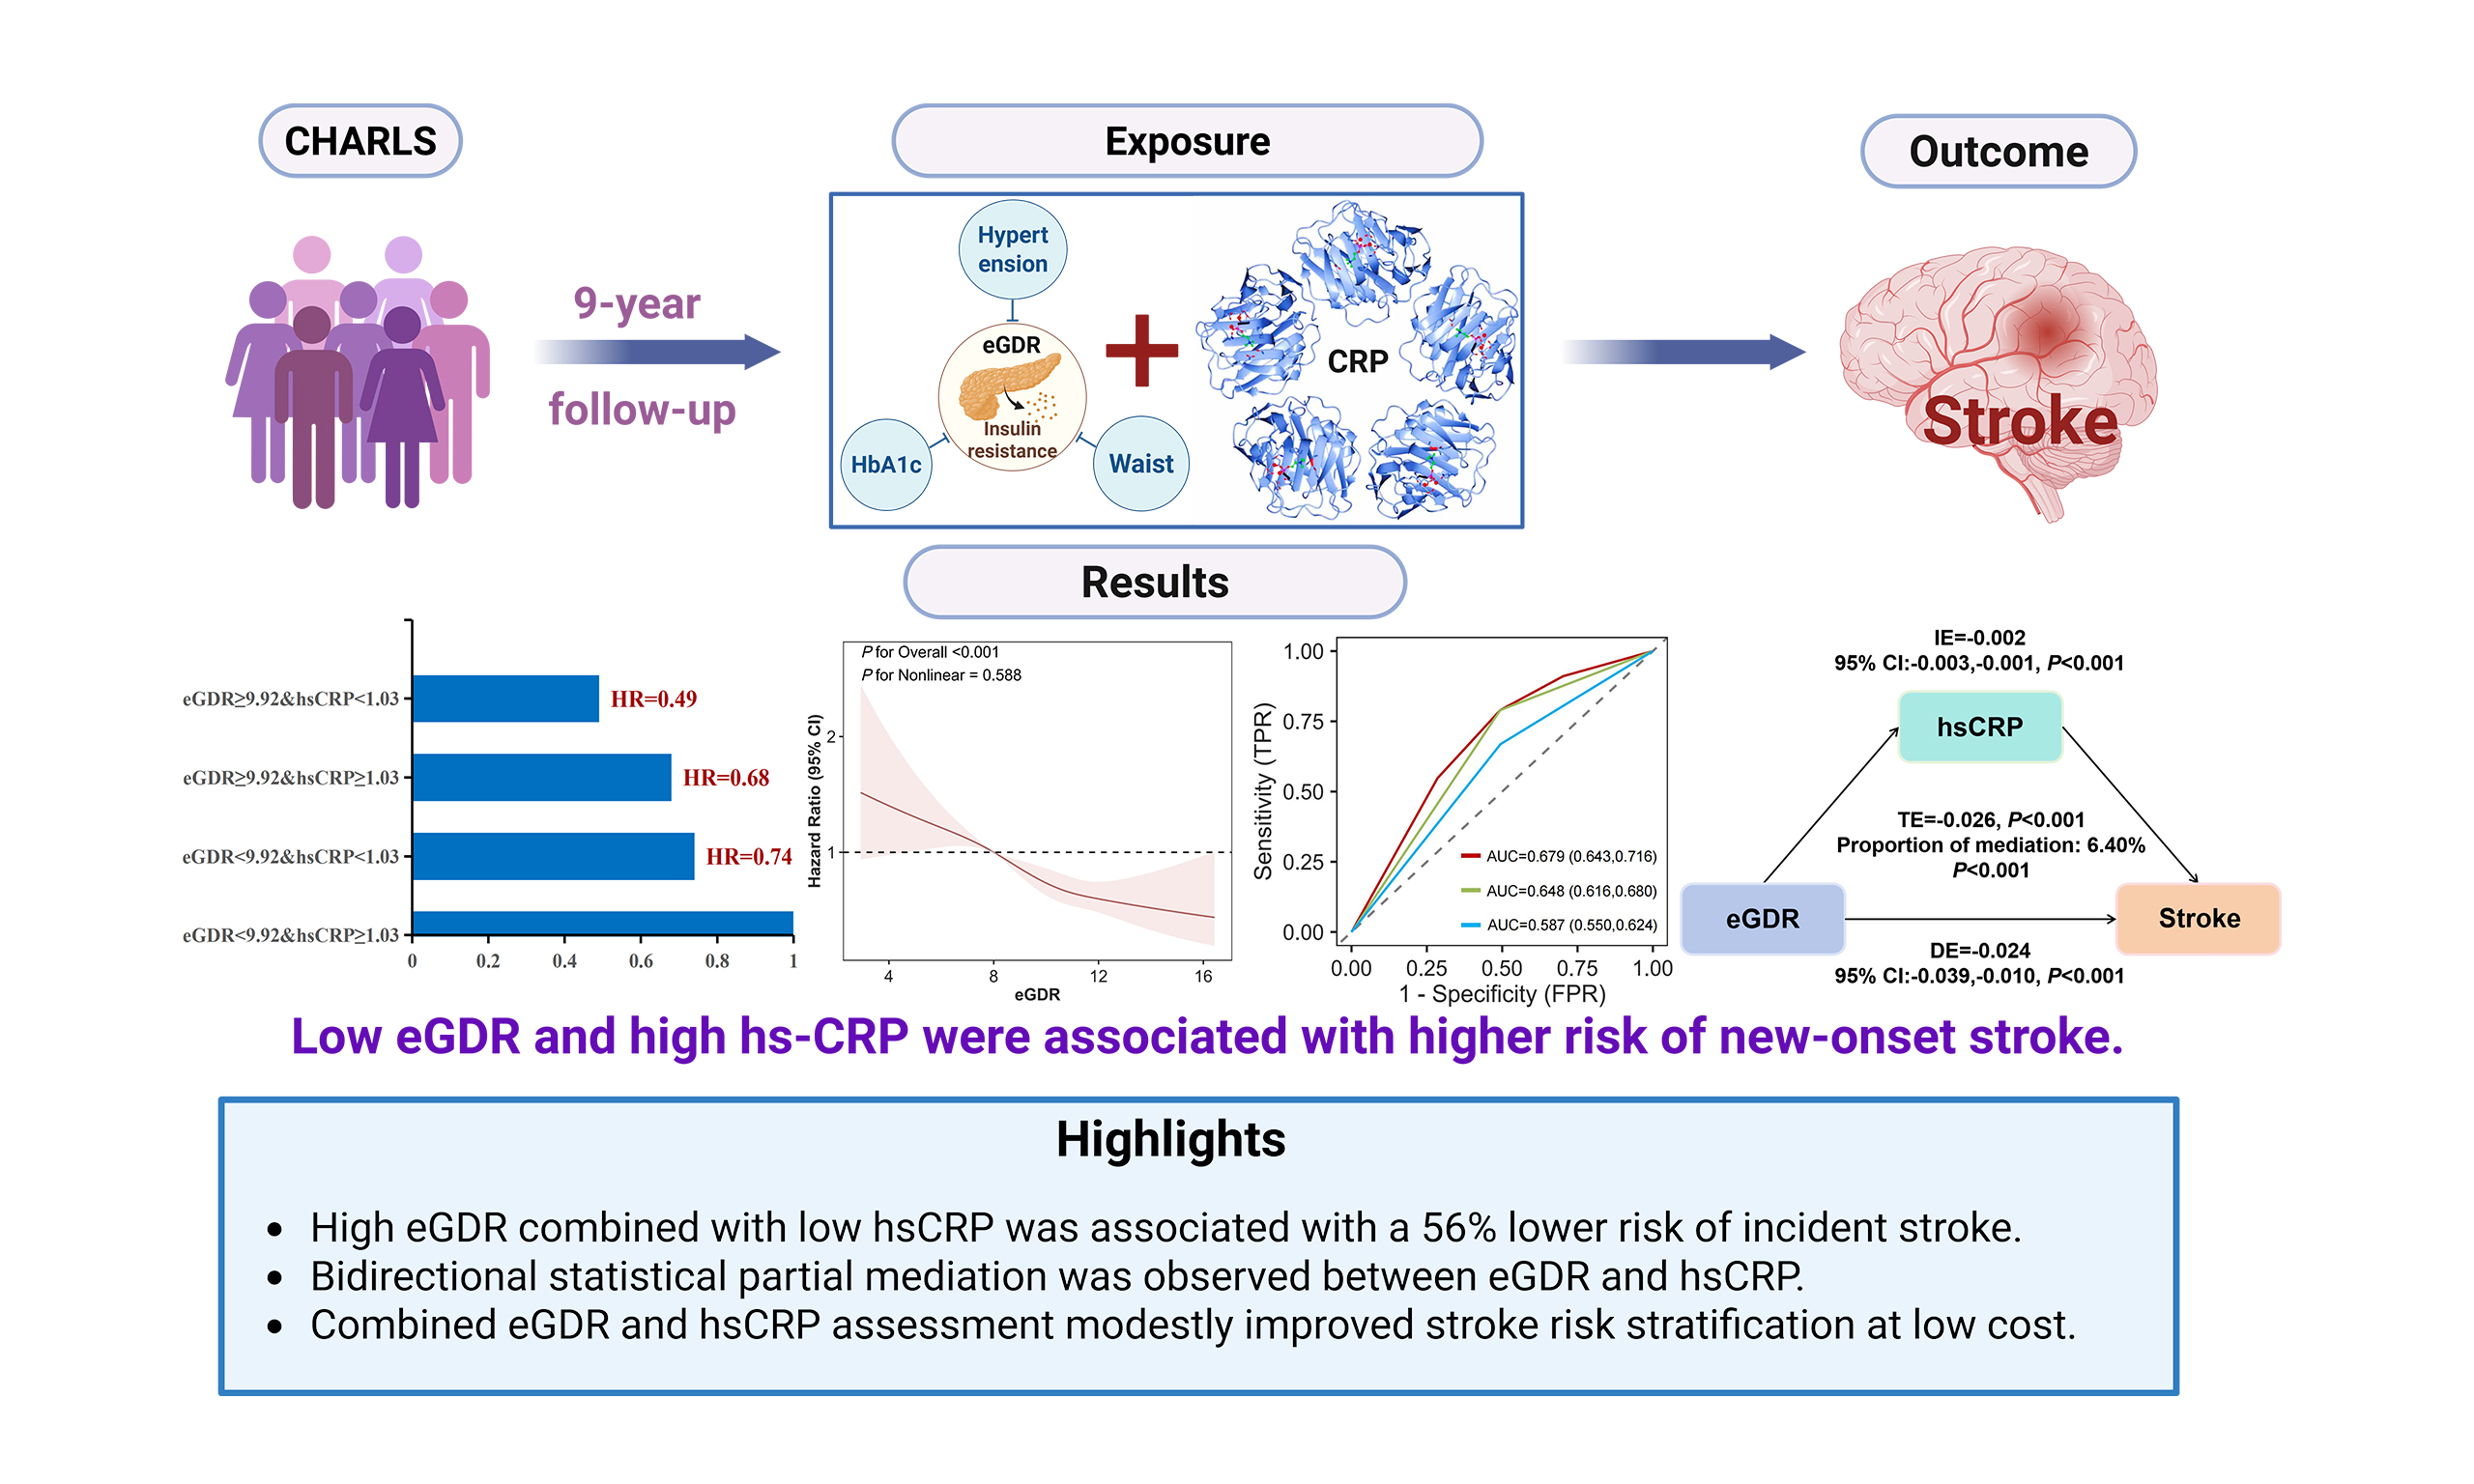
Aim: Estimated glucose disposal rate (eGDR), a surrogate marker of insulin resistance, and high-sensitivity C-reactive protein (hsCRP), an inflammatory marker, may be jointly associated with stroke. We investigated the association of combined eGDR and hsCRP exposure with incident stroke and its predictive value among Chinese middle-aged and older adults.
Methods: This prospective cohort study used five waves of the China Health and Retirement Longitudinal Study (2011-2020). Participants were stratified into four groups by median eGDR (9.92 mg/kg/min) and hsCRP (1.03 mg/L), with incident stroke as the outcome. Associations were assessed using Kaplan-Meier analysis and multivariable Cox regression. Restricted cubic splines, statistical mediation analysis, and receiver operating characteristic-based evaluations were used to examine dose-response relationships, mediation, and predictive performance, respectively.
Results: A total of 815 incident stroke cases (9.11%) were documented during follow-up. The high eGDR plus low hsCRP group showed a 51% lower stroke risk (hazard ratio [HR] = 0.49, 95% confidence interval [CI]: 0.39-0.62) than the low eGDR plus high hsCRP group. The crude stroke event proportions showed a graded trend across the four groups (14.44%, 9.90%, 7.00%, and 4.75%; Log-rank P < 0.001). eGDR had a linear negative correlation with stroke risk, while hsCRP showed a nonlinear positive correlation. In statistical mediation analyses, hsCRP accounted for 6.40% of the association between eGDR and stroke, and eGDR accounted for 4.41% of the association between hsCRP and stroke (both
Conclusion: Joint exposure to eGDR and hsCRP is markedly linked to incident stroke susceptibility in middle-aged and older Chinese adults. Joint evaluation of these routinely measured markers was associated with statistically significant but modest improvements in risk stratification, suggesting a potential, low-cost approach to identifying high-risk individuals that warrants further validation.
Keywords
INTRODUCTION
As an acute cerebrovascular condition arising from the rupture or obstruction of cerebral vasculature, stroke commonly induces irreversible neurological deficits and is linked to high mortality levels and long-term disability likelihood[1]. Drawing on findings from the 2021 Global Burden of Disease Study, stroke accounts for roughly 7.3 million annual deaths across the globe[2]. This disease has emerged as a leading challenge within the global public health landscape, with China shouldering the world’s heaviest stroke burden[3]; each year, the nation reports 2.4 million incident stroke cases, 1.1 million stroke-attributable deaths, and up to 11.1 million prevalent survivors[4]. Accordingly, thorough investigation into the risk factors for stroke and the creation of efficient diagnostic instruments are critically important in reducing the global burden of stroke[5].
Insulin resistance (IR) is widely acknowledged to be a pivotal risk factor for diabetes mellitus (DM) as well as cardiovascular disorders[6,7]. Evidence shows that among those diagnosed with transient ischemic attack or ischemic stroke, but without a prior history of DM, nearly half display substantial IR[8]. IR drives the onset of stroke via multiple mechanistic pathways: for one, it compromises vascular endothelial function, triggering excessive platelet activation and aggregation; conversely, it amplifies vascular inflammatory responses, disrupts lipid metabolic profiles, and contributes to elevated blood pressure, thereby accelerating the progression of atherosclerosis[9]. The estimated glucose disposal rate (eGDR)—calculated based on glycated hemoglobin (HbA1c) concentrations, waist circumference, and hypertension status—has emerged as a dependable surrogate marker for evaluating IR[10,11]. Highly correlated with the hyperinsulinemic-euglycemic clamp—the gold standard reference method—this indicator’s measurements are unaffected by renal function status, rendering it especially well-suited for large-scale, population-based investigations[12,13]. Beyond accurately mirroring insulin sensitivity, eGDR offers a thorough evaluation of metabolic health status through integrating vascular well-being, sustained glycemic control, and obesity status.
Inflammatory mechanisms are central to the initiation and progression of stroke. As a prototypical inflammatory indicator, C-reactive protein (CRP) has been validated to serve as an independent predictor of stroke risk[14]. Elevated serum CRP levels show a graded positive association with the risk of ischemic stroke, as well as all-cause mortality outcomes[15]. Guidelines from the U.S. Centers for Disease Control and Prevention (CDC) and the American Heart Association (AHA) define a CRP level > 3.0 mg/L as an elevated-risk cutoff for cardiovascular risk assessment[16]. Notably, previous studies have shown that IR is often accompanied by elevated CRP levels[17], suggesting a potential pathophysiological link between the two. Reduced eGDR levels and chronic subclinical inflammation may jointly contribute to the development of stroke. Nevertheless, research into the combined association of these two variables with stroke risk is scarce, and the underlying mechanisms warrant further investigation.
Based on data derived from the China Health and Retirement Longitudinal Study (CHARLS), this research investigated the association of joint exposure to eGDR and high-sensitivity C-reactive protein (hsCRP) with the risk of stroke. This study’s findings examine the joint association of the IR phenotype and inflammatory status with stroke onset, further substantiating the potential utility of their joint assessment in stratifying stroke risk.
METHODS
Study population
This study conducted a prospective analysis with data sourced from the CHARLS. Being a nationwide population-based cohort investigation, CHARLS seeks to evaluate the economic circumstances, social conditions and health conditions among Chinese individuals aged 45 years and older. Baseline data gathering was conducted between June 2011 and March 2012, with a final enrollment of 17,708 participants. The present study adopted data derived from five consecutive follow-up investigations conducted across 2011, 2013, 2015, 2018 and 2020. Following the exclusion of subjects aged below 45 years, individuals lacking relevant data for eGDR or hsCRP, people with pre-existing stroke at the baseline assessment, and respondents without available follow-up data, a total of 8,951 subjects formed the final analytical sample [Supplementary Figure 1].
Data collection
The covariates considered in this study were collected via the CHARLS questionnaires, including demographic characteristics (age, sex, Ethnicity, place of residence, educational background, marital status, disability status, employment status, health insurance type, smoking and alcohol use behaviors), physical assessments (height, weight, waist circumference), medical conditions (hyperlipidemia, DM, heart disease [HD]), medication utilization (lipid-lowering, glucose-lowering, and antihypertensive agents), lifestyle elements (sleep duration, life satisfaction), and blood biochemical markers. In accordance with established protocols, venous blood specimens were gathered by professionally trained personnel from local CDC, and all collected samples were delivered to a designated central laboratory for standardized testing[18]. Body mass index (BMI) ≥ 24 kg/m2 serves as the diagnostic threshold for overweight[19].
Exposure assessment
The baseline exposure variable for this research was defined as eGDR. The eGDR was computed via the formula: eGDR (mg/kg/min) = 21.158 - (0.09 × WC) - (3.407 × hypertension) - (0.551 × HbA1c), where WC denotes waist circumference (cm), and hypertension was coded as 1 for yes and 0 for no. Hypertension was categorized as self-reported physician-diagnosed hypertension, a history of antihypertensive drug use, or systolic/diastolic blood pressure ≥ 140/90 mmHg[20].
Serum hsCRP was measured by immunoturbidimetric assay at Capital Medical University’s Clinical Laboratory using venous blood samples.
Outcome
The primary endpoint for this analysis was incident stroke. In this study, we gathered information regarding stroke occurrence via structured questionnaires, asking participants whether they had ever been diagnosed with stroke by a physician, along with the date of diagnosis and current treatment status.
In survival analysis, the time scale was the study observation time. Follow-up began at the baseline survey (2011-2012) and continued until the date of incident stroke diagnosis, death, or the last follow-up survey (up to the 2020 wave), whichever occurred first; participants who did not develop stroke were censored at the time of their last valid follow-up survey.
Statistical analysis
Prior to analysis, height and weight measurements were screened for data quality. Biologically implausible values—defined as height < 1.2 m (n = 8 participants) or weight < 22.5 kg (n = 1 participant)—were identified as data errors, set to missing, and subsequently handled by multiple imputation together with other incomplete variables. No participants were excluded at this step; therefore, the final analytical sample remained 8,951 participants. Data details regarding incomplete datasets within this research are documented in Supplementary Table 1. To minimize possible confounding bias caused by incomplete data, multiple imputation was employed to replace the missing values. We summarized quantitative continuous indicators in the form of mean ± standard deviation or median (interquartile range), and conducted inter-group comparative analyses with analysis of variance (ANOVA) or the Kruskal-Wallis test where applicable. Categorical variables were expressed as frequencies and percentages, and inter-group variations were examined by chi-square tests. Study participants were stratified into four subgroups according to the median cut-off values of eGDR
Covariates for the multivariable models were prespecified a priori based on clinical knowledge and prior literature on stroke risk factors, including age, sex, education level, marital status, work status, disability, smoking, alcohol consumption, BMI, hyperlipidemia, DM, HD, and the use of lipid-lowering, glucose-lowering, and antihypertensive medications. As a supplementary data-driven check of this prespecified adjustment set, we additionally applied the Boruta algorithm[21], a random forest-based feature selection method. Cox regression models with proportional hazards assumption were adopted to evaluate the association between combined exposure to eGDR and hsCRP and the onset of stroke. The proportional hazards assumption was assessed using Schoenfeld residuals, supplemented by graphical inspection. Although the global test indicated some deviation (P < 0.001), visual examination of the scaled Schoenfeld residuals for the exposure groups did not reveal any meaningful time-dependent pattern, likely reflecting the large sample size [Supplementary Figure 2]. To address the observed violation, we additionally fitted a Cox model stratified by the covariate(s) that violated the assumption, and the results remained consistent with the primary analysis [Supplementary Table 3]. Restricted cubic splines (RCS) were applied in the complete adjustment model to explore dose-response relationships between eGDR and hsCRP separately and the risk of stroke.
We conducted subgroup analyses to investigate the effect modification of combined eGDR and hsCRP exposure on stroke risk across different populations. To verify the robustness of our results, six sensitivity analyses were executed: (1) rerunning the analyses with the original, non-imputed dataset; (2) excluding participants diagnosed with cancer at baseline; (3) removing those with HD at study entry; (4) developing extended models by sequentially including additional confounders, such as blood biochemical markers; (5) using a clinically accepted hsCRP threshold of 3.0 mg/L recommended by the CDC/AHA[16] instead of the median-based cutoff, with eGDR dichotomized at its median as in the primary analysis; (6) using the triglyceride-glucose (TyG) index (calculated as ln[triglycerides (mg/dL) × fasting glucose (mg/dL)/2]) combined with hsCRP to examine whether the findings were dependent on the specific eGDR formula. The E-value was calculated to determine the minimum magnitude of association that an unmeasured confounder would need to have with both the exposure and the outcome to fully explain the observed association between combined eGDR and hsCRP exposure and stroke risk[22].
Receiver operating characteristic (ROC) curves were applied to evaluate the predictive value of eGDR combined with hsCRP for forecasting stroke risk. We evaluated the incremental predictive capacity of the models through the use of the C-statistic, net reclassification improvement (NRI), integrated discrimination improvement (IDI), and likelihood ratio test[23]. Model performance was further evaluated using calibration plots comparing predicted and Kaplan-Meier-observed 9-year stroke risks across deciles, bootstrap internal validation (500 resamples) with optimism-corrected C-statistics, and decision-curve analysis (DCA) to assess clinical net benefit across threshold probabilities. Mediation analysis was conducted to explore the direct and indirect effects of eGDR and hsCRP on stroke occurrence. We defined dichotomous eGDR as exposure variable X, dichotomous hsCRP as mediator M, and stroke as outcome variable Y within Model 1. In Model 2, the roles of X and M were exchanged for complementary analysis. This method has found widespread application in epidemiological studies to measure mediation impacts[24]. Formal interaction between low eGDR and high hsCRP was assessed on the multiplicative scale (a product term in the Cox model) and the additive scale, using the relative excess risk due to interaction (RERI), the attributable proportion due to interaction (AP), and the synergy index (SI), with 95%CIs estimated from 1,000 bootstrap resamples.
We performed all statistical computations using R software (version 4.5.1). The main packages used were: mice (version 3.19.0) for multiple imputation, Boruta (version 10.0.0) for feature selection, survival (version 3.8.6) and survminer (version 0.5.2) for Cox proportional hazards regression and Kaplan-Meier analyses, rms (version 8.1.1) for RCS modeling, pROC (version 1.19.0.1) for ROC curve analysis, PredictABEL (version 1.2.4) for NRI and IDI calculations, and mediation (version 4.5.1) for mediation analysis. A two-tailed
RESULTS
Baseline characteristics
Table 1 displays the baseline sociodemographic and clinical characteristics of the 8,951 enrolled subjects. The average age of the total study population was 59.32 ± 9.23 years, with 4,138 men (46.23%) and 4,813 women (53.77%) included. Over the follow-up duration, a total of 815 incident stroke events (9.11%) were documented. Grouping by eGDR and hsCRP levels showed that, relative to the group with high eGDR and low hsCRP, participants in the low eGDR/high hsCRP group tended to be older, had a greater representation of urban residents, and had significantly higher prevalence of non-employment, disability, and obesity. Additionally, a history of hyperlipidemia, DM, and HD was more common in this group. The percentage of participants taking lipid-lowering, antihypertensive, and glucose-lowering agents was also markedly higher, indicating that reduced eGDR in combination with elevated hsCRP collectively signals a clustering of unfavorable metabolic and cardiovascular risk factors.
Baseline characteristics
| Variables | Total (n = 8,951) | eGDR < 9.92&hsCRP ≥ 1.03 (n = 2,597) | eGDR < 9.92&hsCRP < 1.03 (n = 1,868) | eGDR ≥ 9.92&hsCRP ≥ 1.03 (n = 1,857) | eGDR ≥ 9.92&hsCRP < 1.03 (n = 2,629) | P |
| Age, years | 59.32 ± 9.23 | 61.25 ± 9.31 | 60.38 ± 9.40 | 58.88 ± 9.18 | 56.98 ± 8.50 | < 0.001 |
| Age, n (%) | < 0.001 | |||||
| < 60 | 4,908 (54.83) | 1,192 (45.9) | 926 (49.57) | 1,073 (57.78) | 1,717 (65.31) | |
| ≥ 60 | 4,043 (45.17) | 1,405 (54.1) | 942 (50.43) | 784 (42.22) | 912 (34.69) | |
| Sex, n (%) | < 0.001 | |||||
| Female | 4,813 (53.77) | 1,453 (55.95) | 1,036 (55.46) | 889 (47.87) | 1,435 (54.58) | |
| Male | 4,138 (46.23) | 1,144 (44.05) | 832 (44.54) | 968 (52.13) | 1,194 (45.42) | |
| Ethnicity, n (%) | 0.004 | |||||
| Other | 587 (6.56) | 192 (7.39) | 141 (7.55) | 115 (6.19) | 139 (5.29) | |
| Han ethnicity | 8,364 (93.44) | 2,405 (92.61) | 1,727 (92.45) | 1,742 (93.81) | 2,490 (94.71) | |
| Education, n (%) | < 0.001 | |||||
| Elementary school and below | 6,292 (70.29) | 1,816 (69.93) | 1,384 (74.09) | 1,291 (69.52) | 1,801 (68.51) | |
| Above elementary school | 2,659 (29.71) | 781 (30.07) | 484 (25.91) | 566 (30.48) | 828 (31.49) | |
| Marital status, n (%) | < 0.001 | |||||
| Married | 7,861 (87.82) | 2,218 (85.41) | 1,599 (85.6) | 1,658 (89.28) | 2,386 (90.76) | |
| Other | 1,090 (12.18) | 379 (14.59) | 269 (14.4) | 199 (10.72) | 243 (9.24) | |
| Residence, n (%) | < 0.001 | |||||
| City | 3,096 (34.59) | 1,049 (40.39) | 652 (34.9) | 619 (33.33) | 776 (29.52) | |
| Rural | 5,855 (65.41) | 1,548 (59.61) | 1,216 (65.1) | 1,238 (66.67) | 1,853 (70.48) | |
| Work, n (%) | < 0.001 | |||||
| No | 2,974 (33.23) | 1,100 (42.36) | 650 (34.8) | 577 (31.07) | 647 (24.61) | |
| Yes | 5,977 (66.77) | 1,497 (57.64) | 1,218 (65.2) | 1,280 (68.93) | 1,982 (75.39) | |
| Health insurance, n (%) | 0.058 | |||||
| No | 510 (5.70) | 164 (6.31) | 99 (5.3) | 119 (6.41) | 128 (4.87) | |
| Yes | 8,441 (94.30) | 2,433 (93.69) | 1,769 (94.7) | 1,738 (93.59) | 2,501 (95.13) | |
| Life satisfaction, n (%) | 0.087 | |||||
| Satisfied | 7,562 (84.5) | 2,213 (85.2) | 1,601 (85.7) | 1,559 (84) | 2,189 (83.3) | |
| Unsatisfied | 1,389 (15.5) | 384 (14.8) | 267 (14.3) | 298 (16) | 440 (16.7) | |
| Disability, n (%) | 1,579 (17.64) | 485 (18.68) | 355 (19) | 325 (17.5) | 414 (15.75) | 0.013 |
| Drink, n (%) | 3,471 (38.78) | 959 (36.93) | 752 (40.26) | 762 (41.03) | 998 (37.96) | 0.017 |
| Smoke, n (%) | 3,477 (38.84) | 973 (37.47) | 686 (36.72) | 832 (44.8) | 986 (37.5) | < 0.001 |
| BMI, kg/m2 | 23.51 ± 3.88 | 25.64 ± 4.16 | 23.99 ± 3.71 | 22.23 ± 3.19 | 21.99 ± 3.01 | < 0.001 |
| BMI, n (%) | < 0.001 | |||||
| < 24 | 5,312 (59.35) | 910 (35.04) | 972 (52.03) | 1,370 (73.77) | 2,060 (78.36) | |
| ≥ 24 | 3,639 (40.65) | 1,687 (64.96) | 896 (47.97) | 487 (26.23) | 569 (21.64) | |
| Sleep duration, h | 6.34 ± 1.89 | 6.36 ± 1.89 | 6.33 ± 1.95 | 6.34 ± 1.89 | 6.33 ± 1.85 | 0.948 |
| Hyperlipidemia, n (%) | 858 (9.59) | 415 (15.98) | 225 (12.04) | 96 (5.17) | 122 (4.64) | < 0.001 |
| DM, n (%) | 539 (6.02) | 297 (11.44) | 152 (8.14) | 45 (2.42) | 45 (1.71) | < 0.001 |
| HD, n (%) | 1,048 (11.71) | 431 (16.6) | 272 (14.56) | 148 (7.97) | 197 (7.49) | < 0.001 |
| Antidiabetic drugs, n (%) | 335 (3.74) | 195 (7.51) | 99 (5.3) | 23 (1.24) | 18 (0.68) | < 0.001 |
| Lipid lowering drug, n (%) | 447 (4.99) | 236 (9.09) | 123 (6.58) | 41 (2.21) | 47 (1.79) | < 0.001 |
| Antihypertensive medication, n (%) | 1,697 (18.96) | 1,048 (40.35) | 623 (33.35) | 14 (0.75) | 12 (0.46) | < 0.001 |
| hsCRP, mg/L | 2.63 ± 7.23 | 4.48 ± 8.87 | 0.60 ± 0.22 | 5.05 ± 10.99 | 0.55 ± 0.22 | < 0.001 |
| eGDR | 9.28 ± 2.31 | 7.14 ± 1.48 | 7.55 ± 1.27 | 11.18 ± 1.00 | 11.27 ± 0.95 | < 0.001 |
Feature selection
Based on the algorithm's ranking analysis of variable importance [Figure 1], factors such as ethnicity, residence, life satisfaction, sleep duration, and health insurance were excluded as they did not pass the validation threshold. Ultimately, the algorithm identified a set of 15 variables including age, biological sex, educational attainment, marital status, employment status, tobacco smoking, alcohol intake, disability status, BMI, hyperlipidemia, DM, HD, lipid-lowering agents, glucose-lowering agents, and antihypertensive agents. The variables retained by Boruta were fully consistent with the clinically prespecified covariate set, supporting the appropriateness of the adjustment strategy.
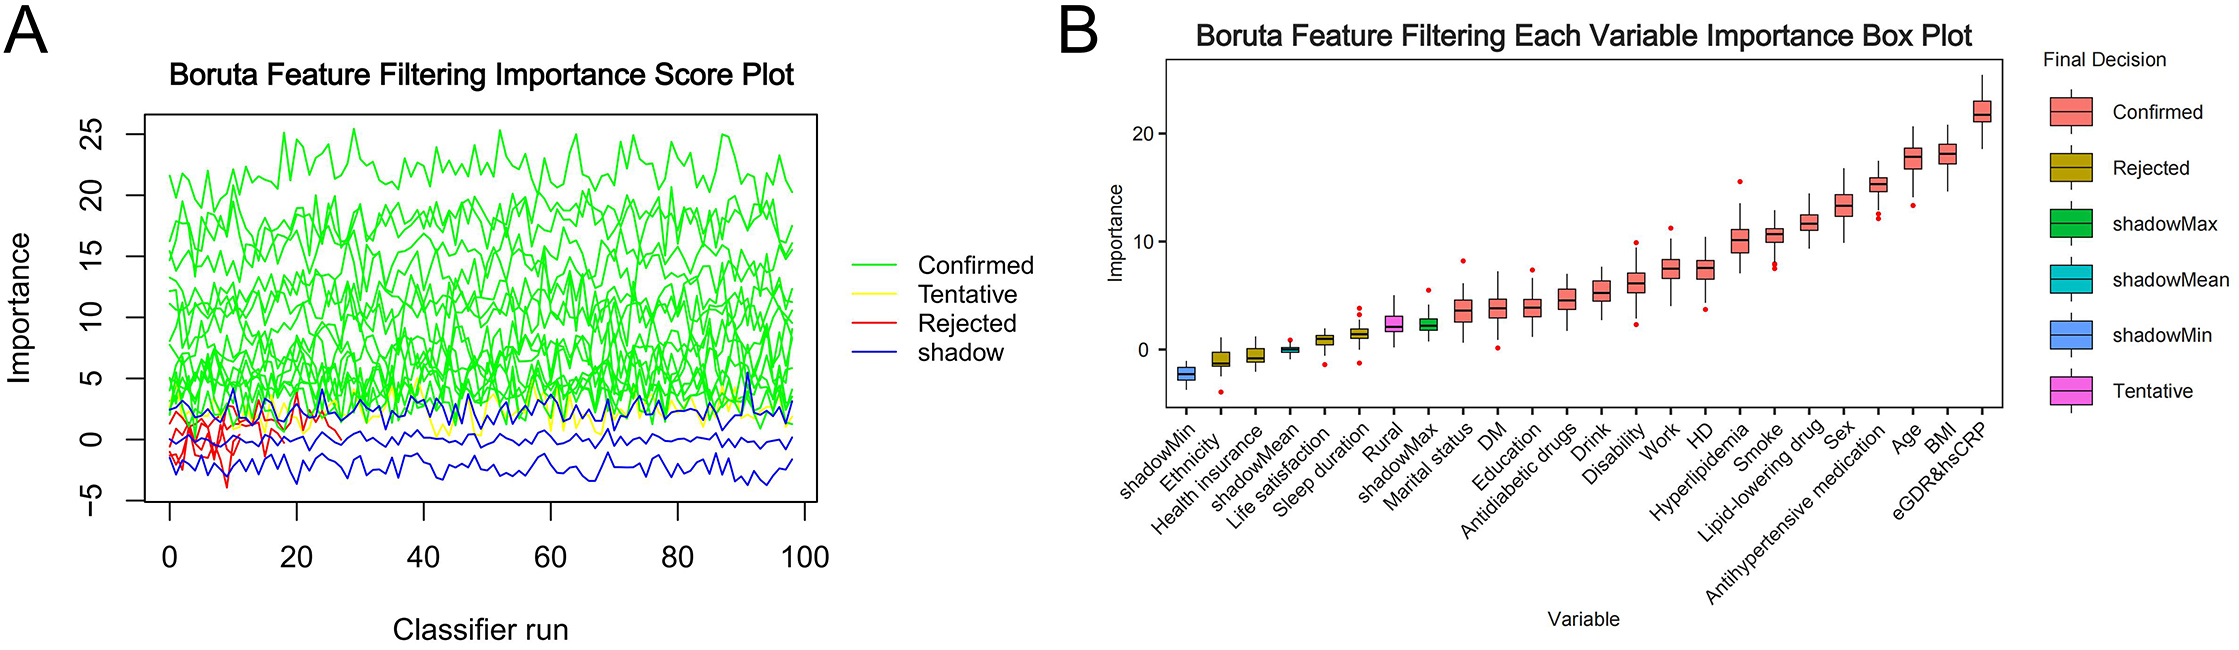
Figure 1. Feature selection for stroke based on the Boruta algorithm. (A) importance trajectory across Boruta runs; (B) boxplot of variable importance (Z-values) by final decision. The horizontal axis in (A and B) represents the number of classifier runs and the names of each variable, respectively, while the vertical axis represents the Z-value of each variable. Red boxes and lines represent variables confirmed by the model calculation, purple represents tentative attributes, and yellow represents rejected variables. eGDR: Estimated glucose disposal rate; hsCRP: high-sensitivity C-reactive protein; BMI: body mass index; DM: diabetes mellitus; HD: heart disease.
Association between eGDR & hsCRP and stroke incidence
The Kaplan-Meier approach was adopted to explore the association of combined eGDR and hsCRP groups with cumulative stroke incidence [Figure 2]. The results showed that the group with low eGDR combined with high hsCRP had the highest crude event proportion (14.44%), followed by the low eGDR/low hsCRP group (9.90%), the high eGDR/high hsCRP group (7.00%), and the high eGDR/low hsCRP group (4.75%). Intergroup disparities reached statistical significance based on the Log-rank test (P < 0.001), suggesting a progressive increase in stroke risk associated with reduced eGDR concentrations and elevated hsCRP concentrations.
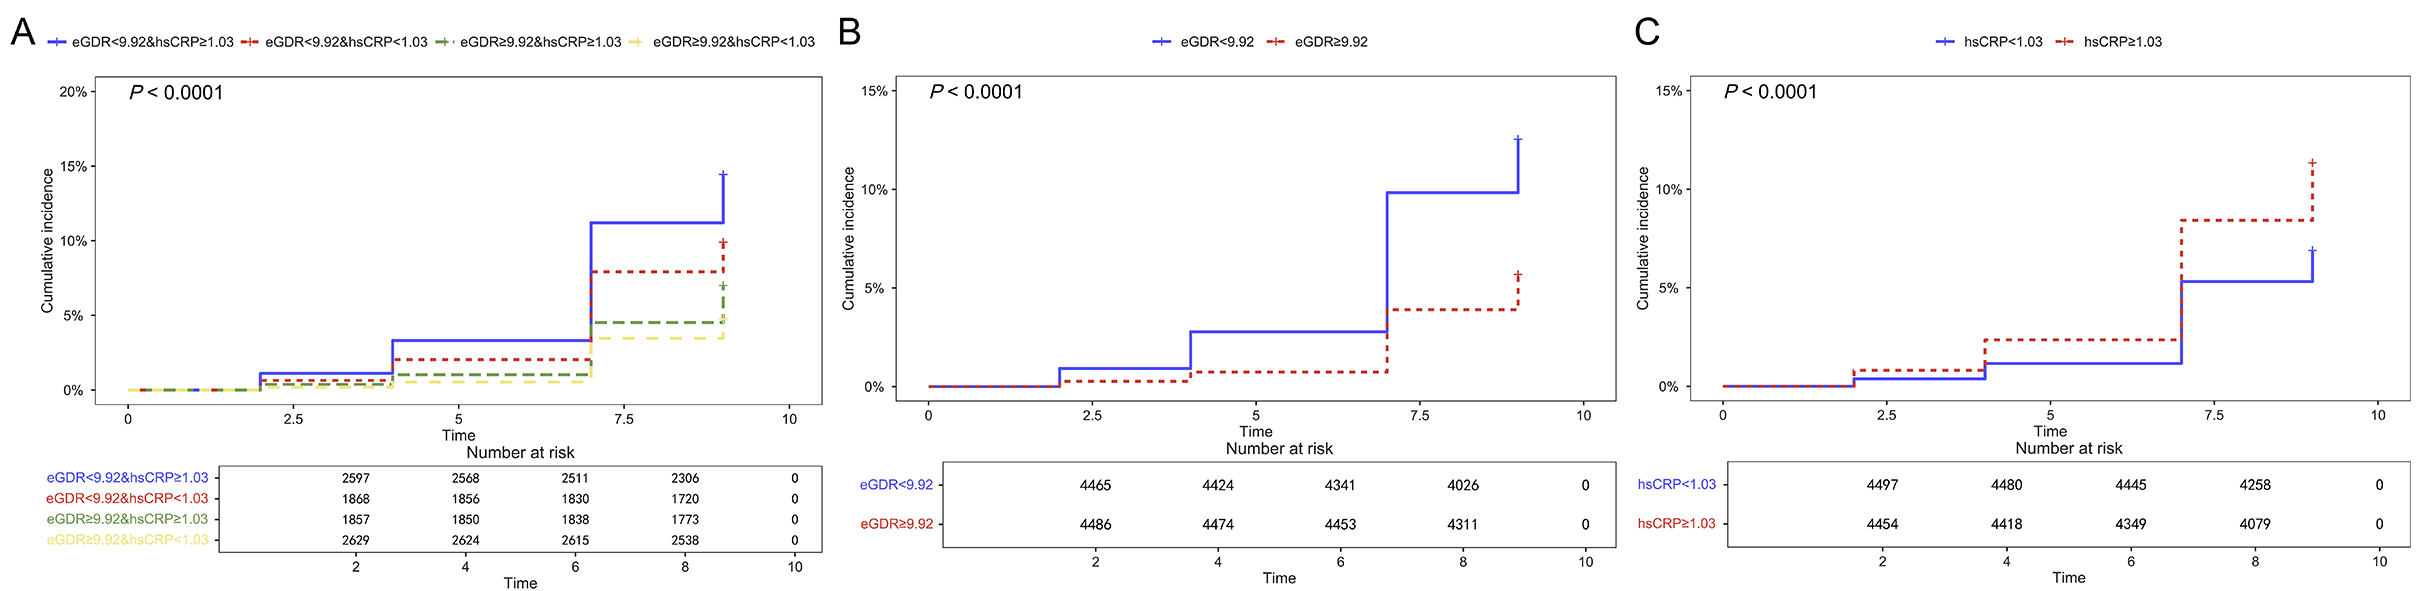
Figure 2. Kaplan-Meier plots of cumulative stroke incidence based on eGDR, hsCRP, and combined eGDR & hsCRP groups. (A) eGDR & hsCRP; (B) eGDR; (C) hsCRP. The y-axis represents the cumulative incidence of stroke, estimated as 1 minus the Kaplan-Meier survival probability. Participants were stratified using the median values of eGDR (9.92 mg/kg/min) and hsCRP (1.03 mg/L) as cutoffs. Log-rank tests showed significant differences among the groups in all panels (all P < 0.001). eGDR: Estimated glucose disposal rate; hsCRP: high-sensitivity C-reactive protein.
Association of combined eGDR and hsCRP with stroke risk
Cox regression models with proportional hazards were employed to evaluate the association between combined eGDR and hsCRP concentrations and the risk of stroke [Table 2]. In the unadjusted model, we took the low eGDR/high hsCRP group (eGDR < 9.92 mg/kg/min; hsCRP ≥ 1.03 mg/L) as the reference, and found that the high eGDR/low hsCRP group had a 69% lower stroke risk (HR = 0.31, 95%CI: 0.25-0.38). After full adjustment for confounding factors (Model 3), the detected risk in the subgroup with high eGDR and low hsCRP was still reduced by 51% (HR = 0.49, 95%CI: 0.39-0.62). Furthermore, both the high eGDR-high hsCRP subgroup and the low eGDR-low hsCRP subgroup also demonstrated reduced risks, with corresponding HRs of 0.68 (95%CI: 0.54-0.85) and 0.74 (95%CI: 0.62-0.89), respectively, indicating a graded joint association of eGDR and hsCRP with stroke risk.
Association of eGDR, hsCRP, and eGDR & hsCRP with stroke risk
| Variable | Event n (%) | Model 1 | P value | Model 2 | P value | Model 3 | P value |
| HR (95%CI) | HR (95%CI) | HR (95%CI) | |||||
| eGDR&hsCRP | |||||||
| eGDR < 9.92&hsCRP ≥ 1.03 | 375 (14.4) | Ref | Ref | Ref | |||
| eGDR < 9.92&hsCRP < 1.03 | 185 (9.9) | 0.67 (0.56, 0.80) | < 0.001 | 0.72 (0.61, 0.87) | < 0.001 | 0.74 (0.62, 0.89) | 0.001 |
| eGDR ≥ 9.92&hsCRP ≥ 1.03 | 130 (7) | 0.46 (0.38, 0.56) | < 0.001 | 0.55 (0.44, 0.67) | < 0.001 | 0.68 (0.54, 0.85) | 0.001 |
| eGDR ≥ 9.92&hsCRP < 1.03 | 125 (4.8) | 0.31 (0.25, 0.38) | < 0.001 | 0.39 (0.31, 0.49) | < 0.001 | 0.49 (0.39, 0.62) | < 0.001 |
| eGDR | |||||||
| eGDR < 9.92 | 560 (12.5) | Ref | Ref | Ref | |||
| eGDR ≥ 9.92 | 255 (5.7) | 0.43 (0.37, 0.50) | < 0.001 | 0.53 (0.45, 0.62) | < 0.001 | 0.66 (0.55, 0.79) | < 0.001 |
| hsCRP | |||||||
| hsCRP < 1.03 | 310 (6.9) | Ref | Ref | Ref | |||
| hsCRP ≥ 1.03 | 505 (11.3) | 1.68 (1.46, 1.94) | < 0.001 | 1.45 (1.26, 1.68) | < 0.001 | 1.38 (1.19, 1.60) | < 0.001 |
Multiple Cox proportional hazards regression models further estimated the independent associations of eGDR and hsCRP with stroke risk [Table 2]. Following comprehensive adjustment for confounding variables (Model 3), participants with eGDR levels ≥ 9.92 mg/kg/min exhibited a 34% reduction in stroke risk relative to their counterparts with eGDR < 9.92 mg/kg/min (HR = 0.66, 95%CI: 0.55-0.79); in contrast, those with hsCRP concentrations ≥ 1.03 mg/L demonstrated a 38% elevation in stroke risk versus participants with hsCRP < 1.03 mg/L (HR = 1.38, 95%CI: 1.19-1.60). Collectively, these findings indicate that, in contrast to relying on a single biomarker, the integrated evaluation of combined eGDR and hsCRP may allow for more robust stratification for stroke risk. RCS regression models additionally uncovered the dose-response associations between these two factors with stroke risk [Figure 3]. eGDR showed a notable negative linear relationship with the risk of stroke (P for overall < 0.001, P for non-linear = 0.588); conversely, hsCRP exhibited a positive non-linear relationship with stroke risk (P for overall = 0.010, P for non-linear = 0.016).
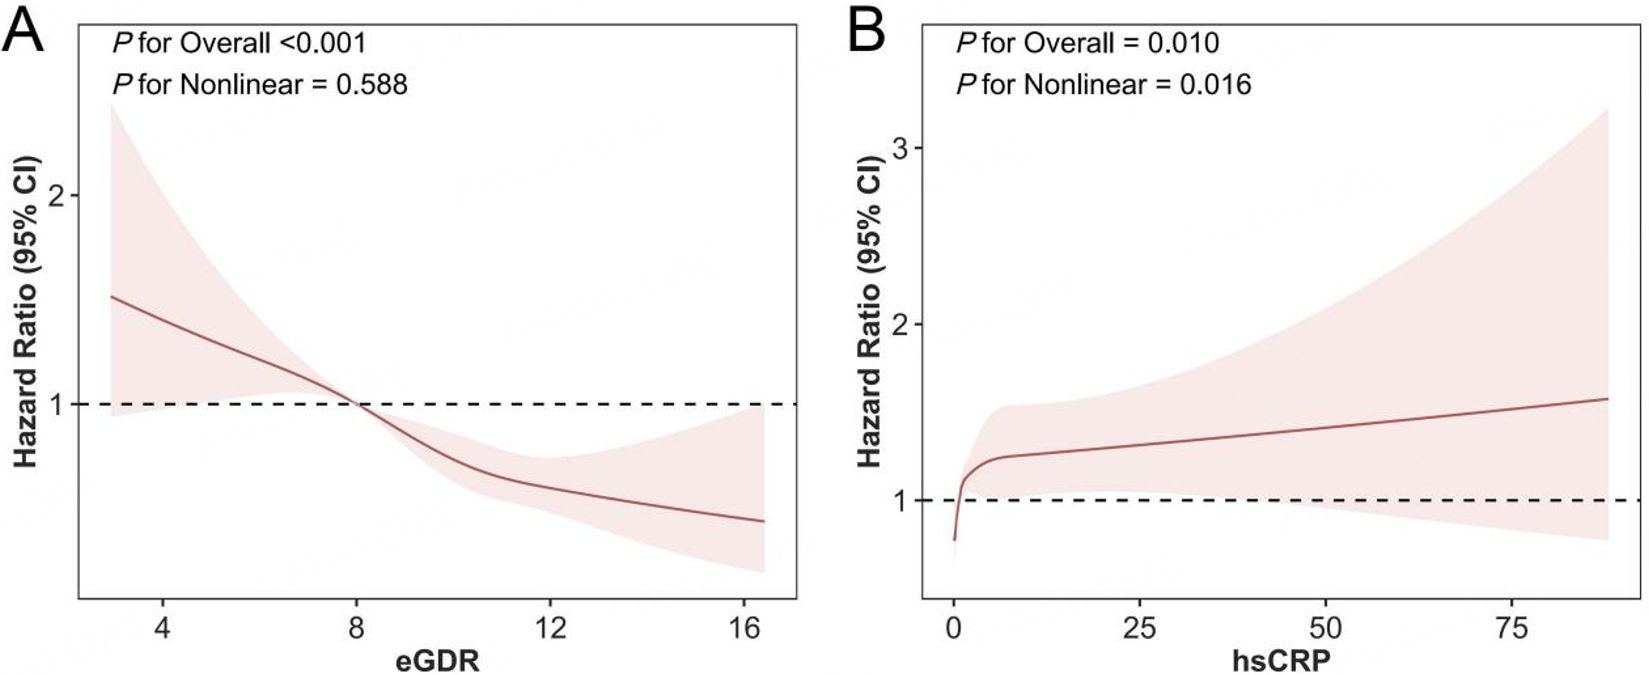
Figure 3. Restricted cubic spline curves for stroke based on eGDR and hsCRP. (A) eGDR; (B) hsCRP. The solid line represents the HR, and the shaded area represents the 95%CI. The horizontal dashed line indicates a HR of 1.0. The adjusted model was selected based on the Boruta algorithm and clinical experience, incorporating adjustments for age, sex, education level, marital status, work status, disability, smoking, alcohol consumption, BMI, hyperlipidemia, DM, HD, lipid-lowering medication, glucose-lowering medication, and antihypertensive medication. CI: Confidence interval; eGDR: estimated glucose disposal rate; hsCRP: high-sensitivity C-reactive protein; BMI: body mass index; DM: diabetes mellitus; HD: heart disease.
Subgroup analysis
The results of the subgroup analysis [Table 3] revealed that no significant interactive effects were detected in any subgroup (all P for interaction > 0.05). In the subgroups of participants with HD, DM, or hyperlipidemia, no statistically significant association was observed; however, the estimates in these subgroups were unstable, with wide confidence intervals due to limited sample sizes and event numbers. Therefore, these null findings should be interpreted as inconclusive rather than evidence of no association, and larger studies are needed to clarify the associations in these populations.
Subgroup analysis
| Subgroup | eGDR < 9.92&hsCRP ≥ 1.03 | eGDR < 9.92&hsCRP < 1.03 | eGDR ≥ 9.92&hsCRP ≥ 1.03 | eGDR ≥ 9.92&hsCRP < 1.03 | P for interaction |
| HR (95%CI) | HR (95%CI) | HR (95%CI) | |||
| Age | 0.156 | ||||
| < 60 | Ref | 0.75 (0.57, 1.00) | 0.58 (0.41, 0.82) | 0.38 (0.27, 0.53) | |
| ≥ 60 | Ref | 0.74 (0.58, 0.94) | 0.78 (0.57, 1.06) | 0.63 (0.46, 0.86) | |
| Sex | 0.254 | ||||
| Female | Ref | 0.79 (0.62, 1.02) | 0.80 (0.58, 1.10) | 0.52 (0.37, 0.72) | |
| Male | Ref | 0.69 (0.53, 0.90) | 0.60 (0.43, 0.83) | 0.47 (0.34, 0.66) | |
| Education | 0.100 | ||||
| Elementary school and below | Ref | 0.72 (0.59, 0.89) | 0.65 (0.49, 0.84) | 0.54 (0.41, 0.70) | |
| Above elementary school | Ref | 0.82 (0.58, 1.17) | 0.78 (0.51, 1.20) | 0.36 (0.22, 0.59) | |
| Disability | 0.903 | ||||
| No | Ref | 0.73 (0.60, 0.90) | 0.63 (0.48, 0.81) | 0.46 (0.36, 0.61) | |
| Yes | Ref | 0.79 (0.55, 1.14) | 0.90 (0.57, 1.44) | 0.57 (0.35, 0.94) | |
| Smoke | 0.307 | ||||
| No | Ref | 0.77 (0.61, 0.98) | 0.83 (0.62, 1.13) | 0.51 (0.37, 0.70) | |
| Yes | Ref | 0.73 (0.55, 0.96) | 0.55 (0.39, 0.78) | 0.48 (0.34, 0.67) | |
| Drink | 0.846 | ||||
| No | Ref | 0.73 (0.58, 0.93) | 0.60 (0.44, 0.81) | 0.43 (0.32, 0.59) | |
| Yes | Ref | 0.76 (0.58, 1.01) | 0.80 (0.57, 1.13) | 0.57 (0.40, 0.82) | |
| BMI | 0.318 | ||||
| < 24 | Ref | 0.59 (0.45, 0.79) | 0.66 (0.49, 0.89) | 0.46 (0.34, 0.62) | |
| ≥ 24 | Ref | 0.84 (0.67, 1.06) | 0.64 (0.44, 0.93) | 0.46 (0.30, 0.69) | |
| HD | 0.069 | ||||
| No | Ref | 0.81 (0.66, 0.99) | 0.75 (0.59, 0.95) | 0.49 (0.38, 0.63) | |
| Yes | Ref | 0.56 (0.38, 0.84) | 0.43 (0.22, 0.84) | 0.58 (0.33, 1.02) | |
| DM | 0.163 | ||||
| No | Ref | 0.72 (0.59, 0.87) | 0.68 (0.54, 0.86) | 0.48 (0.37, 0.61) | |
| Yes | Ref | 1.01 (0.60, 1.70) | 0.45 (0.10, 1.95) | 1.09 (0.40, 3.01) | |
| Hyperlipidemia | 0.275 | ||||
| No | Ref | 0.80 (0.65, 0.97) | 0.68 (0.54, 0.87) | 0.48 (0.38, 0.62) | |
| Yes | Ref | 0.55 (0.35, 0.84) | 0.70 (0.35, 1.41) | 0.63 (0.31, 1.27) |
Sensitivity analysis
To assess the robustness of our main results, we conducted a series of sensitivity analyses
Predictive value of eGDR and hsCRP for incident stroke
Analysis based on ROC curves was further conducted to assess the predictive value of eGDR combined with hsCRP for stroke risk forecasting [Figure 4]. In the overall population, the predictive utility of eGDR (AUC = 0.648) outperformed that of hsCRP (AUC = 0.587), and the joint use of both biomarkers boosted the AUC to 0.679. Among participants with a history of HD, the predictive utility of hsCRP (AUC = 0.606) was marginally superior to that of eGDR (AUC = 0.595), and the joint model additionally elevated the AUC to 0.661 [Figure 4B]. In the non-HD population, the predictive utility of eGDR (AUC = 0.648) was markedly superior to that of hsCRP (AUC = 0.575), and the joint model yielded the peak predictive performance
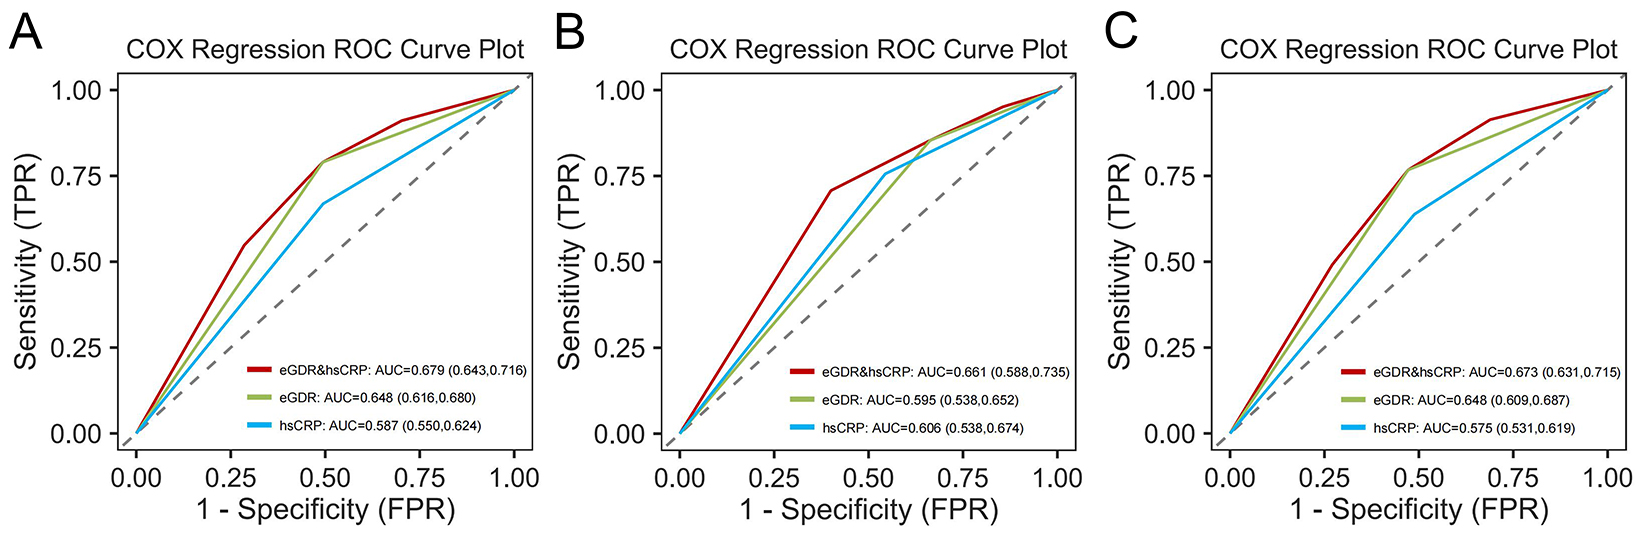
Figure 4. ROC curves for predicting stroke risk using eGDR and hsCRP. (A) Overall population; (B) HD; (C) Non-HD. The ROC analyses evaluated models containing the biomarker(s) only, without clinical covariates. eGDR: Estimated glucose disposal rate; hsCRP: high-sensitivity C-reactive protein; HD: heart disease; ROC: receiver operating characteristic; AUC: area under the curve.
Incremental predictive value of eGDR and hsCRP
To evaluate the incremental predictive value of each biomarker, hsCRP, eGDR, and their combined application were sequentially added into a basic model. Model improvement was quantified through the C-statistic, NRI, IDI, as well as the likelihood ratio test [Table 4]. For the baseline demographic model, the C-statistic stood at 0.719; when hsCRP was added in isolation, it did not yield a statistically meaningful improvement (C-statistic = 0.726, P = 0.302), whereas the inclusion of eGDR elevated the C-statistic to 0.734 (P = 0.059). When both indicators were added together, the model achieved optimal discriminative ability (C-statistic = 0.739, P = 0.037). Reclassification analysis revealed that the NRI associated with the joint model stood at 0.135, which was markedly greater than the corresponding values for models incorporating only hsCRP (0.121) or only eGDR (0.129) (all P < 0.001). The IDI followed a consistent trend, with the combined model showing the largest improvement (0.004), while the single-indicator models both showed an IDI of 0.002. Subsequent likelihood ratio testing corroborated that the joint model delivered the most pronounced improvement in model goodness-of-fit (Estimate = 38.73, P < 0.001), outperforming models incorporating eGDR alone (Estimate = 21.41, P < 0.001) and hsCRP alone (Estimate = 19.13,
Incremental predictive value of eGDR and hsCRP
| C-statistics | NRI | IDI | LR | |||||
| Estimate (95%CI) | P value | Estimate (95%CI) | P value | Estimate (95%CI) | P value | Estimate | P value | |
| Basic model | 0.719 (0.680, 0.758) | Ref | Ref | Ref | ||||
| Basic model + hsCRP | 0.726 (0.689, 0.764) | 0.302 | 0.121 (0.082, 0.16) | < 0.001 | 0.002 (0.000, 0.004) | 0.053 | 19.13 | < 0.001 |
| Basic model + eGDR | 0.734 (0.697, 0.770) | 0.059 | 0.129 (0.094, 0.172) | < 0.001 | 0.002 (0.001, 0.004) | < 0.001 | 21.41 | < 0.001 |
| Basic model + hsCRP + eGDR | 0.739 (0.703, 0.775) | 0.037 | 0.135 (0.087, 0.177) | < 0.001 | 0.004 (0.001, 0.006) | < 0.001 | 38.73 | < 0.001 |
The full combined model was well calibrated, with predicted 9-year stroke risks closely matching observed risks across deciles [Supplementary Figure 3]. Bootstrap internal validation (500 resamples), based on the overall concordance index of the Cox model, yielded an apparent C-statistic of 0.673 and an optimism-corrected C-statistic of 0.665 (optimism = 0.008), suggesting minimal overfitting. DCA showed a net benefit of the combined model over treat-all and treat-none strategies at threshold probabilities of approximately 2%-25%, although the incremental net benefit over the basic model was modest [Supplementary Figure 4].
Mediation analysis
Mediation analysis uncovered the dynamic interplay between combined eGDR and hsCRP in the pathway linking them to stroke risk [Figure 5]. Our mediation modeling results revealed that hsCRP explained 6.40% of the relationship between eGDR and stroke occurrence (P < 0.001); on the other hand, eGDR explained 4.41% of the relationship between hsCRP and stroke occurrence (P < 0.001). This nearly symmetrical pattern suggests that the statistical associations of each biomarker with stroke are partially captured by the other; however, given the observational design and the dichotomization of the variables, these results should be interpreted as a decomposition of statistical associations rather than evidence of causal or biological pathways.
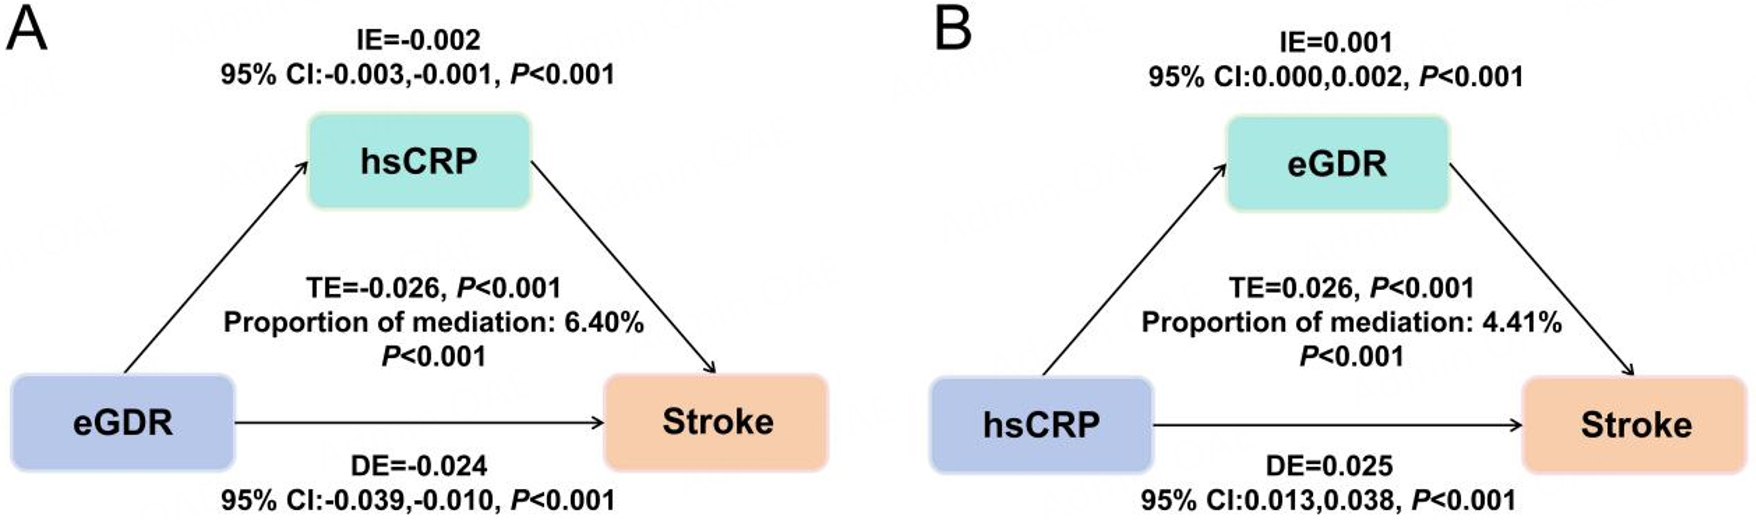
Figure 5. Mediation analysis. (A) hsCRP as a mediator in the relationship between eGDR and incident stroke; (B) eGDR as a mediator in the relationship between hsCRP and incident stroke. Adjustment variables included: age, sex, education level, marital status, work status, disability, smoking, alcohol consumption, BMI, hyperlipidemia, DM, HD, lipid-lowering medication, glucose-lowering medication, and antihypertensive medication. Both eGDR and high-sensitivity C-reactive protein were dichotomized according to their median values. eGDR: Estimated glucose disposal rate; hsCRP: high-sensitivity C-reactive protein; BMI: body mass index; DM: diabetes mellitus; HD: heart disease. IE: indirect effect; DE: direct effect; TE: total effect
No significant interaction between low eGDR and high hsCRP was detected on either scale: the multiplicative product term was not significant (P for interaction = 0.811), and additive interaction measures were close to their null values with confidence intervals crossing them (RERI = 0.129, 95%CI: -0.351-0.538; AP = 0.063, 95%CI: -0.172-0.262; SI = 1.141, 95%CI: 0.744-2.156) [Supplementary Table 10], suggesting that the elevated stroke risk in the double-exposed group largely reflects the combined rather than interactive effects of the two biomarkers.
DISCUSSION
Leveraging data from a nationwide prospective cohort, this study comprehensively examined the link between joint exposure to eGDR and hsCRP and the risk of incident stroke. Our results revealed a strong correlation between combined exposure to eGDR and hsCRP and stroke risk. Relative to the reference group of subjects with low eGDR (< 9.92 mg/kg/min) and elevated hsCRP (≥ 1.03 mg/L), individuals with high eGDR and low hsCRP showed a 51% decrease in the risk of stroke. The crude stroke event proportion in the low eGDR-elevated hsCRP subgroup was 14.44%, while the corresponding figure was only 4.75% in the high eGDR-low hsCRP subgroup, consistent with the graded separation of the Kaplan-Meier curves.
The recognition of IR as a contributing factor to stroke risk was first established in 2003 by Kernan et al., who demonstrated a connection between IR and metabolic, hematological, and cellular events that promote atherosclerosis and thrombosis[8]. Subsequently, numerous large-scale cohort studies have validated this association across different populations. In a large nationwide cohort of over 100,000 Swedish people with DM, lower eGDR levels were linked to a higher risk of first-ever stroke, as well as increased all-cause and cardiovascular mortality after stroke[25]. A retrospective analysis of Chinese stroke registry data further showed that higher eGDR was independently associated with better functional outcomes at 3 months and 1 year following stroke[26]. Two prospective cohort studies also validated a significant inverse relationship between eGDR levels and stroke risk[27]. A recent large-scale prospective analysis of UK Biobank data not only replicated the finding that higher eGDR levels were significantly linked to a lower risk of incident stroke and long-term adverse events, but also further uncovered that inflammatory markers partially mediate this relationship[28]. As a pivotal marker of the inflammatory response, the link between CRP and stroke risk is backed by substantial evidence[14,15,29]. A large meta-analysis identified a continuous positive correlation between CRP concentrations and the likelihood of incident ischemic stroke, as well as all-cause death[14]. A recent systematic review further confirmed that elevated hsCRP levels can independently predict adverse outcomes—including all-cause mortality and recurrent stroke—in patients diagnosed with acute ischemic stroke[30].
Our work demonstrates a modest but statistically significant improvement in stroke risk stratification. An AUC of 0.679 indicates only modest discriminative ability, and the combined model would still yield imperfect risk classification for a substantial proportion of participants; the gains in the C-statistic and IDI, though statistically significant, are incremental rather than transformative. DCA further showed a net benefit only within a limited range of low threshold probabilities (approximately 2%-25%), with little additional benefit over the basic model. Thus, the combined assessment should be regarded as a low-cost complement to comprehensive risk assessment rather than a stand-alone screening tool, and its clinical utility requires confirmation through external validation. Previous investigations have also centered on the joint impact of IR surrogate markers alongside inflammatory markers. Evidence from CHARLS demonstrated a combined association and bidirectional statistical mediation linking hsCRP with metabolic syndrome in relation to stroke susceptibility[31]. Cui et al. verified that the concurrent increase in the triglyceride-glucose (TyG) index and hsCRP markedly elevated the risk of stroke, and a mutual mediating effect existed between the two factors[32]. Xu et al. additionally identified combined interactive and mediating impacts of eGDR and hsCRP in relation to cardiovascular disease[33]. Findings from these studies jointly lend support to the joint contribution of IR and inflammation to vascular events, in line with the graded joint association observed in the present study. Of note, a prospective cohort study by Matsumoto et al. failed to identify the prognostic value of the co-occurrence of these two parameters in predicting stroke[34]; this inconsistency may be explained by differences in study populations and approaches for evaluating IR, suggesting that the clinical applicability of these combined biomarkers warrants further verification across more heterogeneous populations.
A bidirectional regulatory relationship exists between IR and inflammation[35]. Preclinical research has demonstrated that increased CRP concentrations interfere with insulin signal transduction by triggering serine phosphorylation of insulin receptor substrate 1 and inhibiting Akt (protein kinase B) activation, thus compromising glycogen production and cellular glucose absorption[36]. Such metabolic dysregulation and the inflammatory process act in a mutually reinforcing manner. IR can boost the secretion of pro-inflammatory cytokines from adipose tissue, which amplifies systemic inflammatory responses. In turn, this inflammatory state further impairs insulin sensitivity, ultimately forming a vicious cycle. Atherosclerosis, as a lipid-driven chronic inflammatory disease, has plaque instability and subsequent thrombotic events closely linked to the state of systemic inflammation[37]. Clinical findings demonstrate that roughly 60% of individuals with acute myocardial infarction present increased hsCRP levels (≥ 2.0 mg/L), and damage-related molecular patterns derived from myocardial necrosis further enhance the inflammatory response cascade through the activation of Toll-like receptors, the complement system, and reactive oxygen species-related signaling pathways[37].
Our statistical mediation results are compatible with the above-mentioned pathological mechanisms: hsCRP statistically accounted for 6.40% of the association between eGDR and stroke, while eGDR accounted for 4.41% of the association between hsCRP and stroke. Nevertheless, these findings represent statistical mediation only and cannot confirm causal or bidirectional biological pathways, which require validation in experimental and interventional studies. Results derived from the Bogalusa Heart Study further support this interplay, showing that increased hsCRP concentrations are associated with IR and their co-occurrence can accurately forecast the occurrence of DM—an association that remains stable across various metabolic backgrounds[38].
These findings may have implications for stroke risk stratification. Since eGDR and hsCRP can be derived from routinely measured indicators at low cost, their combined assessment could potentially serve as a convenient tool for identifying individuals at elevated stroke risk, particularly in resource-limited primary care settings. However, as this is an observational cohort study, causality cannot be established, and whether such screening or targeted interventions could reduce stroke incidence requires confirmation in prospective and interventional studies. For patients with HD, the predictive performance of the combined indicators appears diminished, and a comprehensive assessment incorporating traditional risk factors may be preferable. Moreover, hsCRP should be regarded as a risk marker rather than a causal factor[39]. Looking ahead, given that metabolic-inflammatory disturbances have been linked to microstructural white matter damage and cognitive impairment[40], future studies incorporating neuroimaging data are warranted to explore whether combined eGDR and hsCRP assessment can identify stroke patients at higher risk of white matter lesions and adverse outcomes. Beyond this, several other directions deserve attention: external validation in other ethnic and younger populations; longitudinal studies with repeated measurements to assess whether trajectories of eGDR and hsCRP better predict stroke risk; experimental research into the mechanisms underlying the insulin resistance-inflammation interplay; and randomized trials to determine whether improving insulin sensitivity or reducing inflammation translates into stroke benefits for stroke prevention.
Our study possesses several major advantages. First, the data were obtained from the nationwide representative, community-based prospective CHARLS cohort. This cohort offered a substantial sample size and long-term follow-up, which guaranteed strong statistical power and improved the external validity of our results. Second, the Boruta algorithm was adopted for feature selection, thereby boosting the accuracy and robustness of our predictive model. Third, to our knowledge, this study is among the first to specifically investigate the association of combined eGDR and hsCRP exposure with incident stroke in Chinese middle-aged and older adults, extending previous work on insulin resistance and inflammatory markers in cardiovascular disease to the stroke outcome. Fourth, multiple imputation was utilized to handle missing data, and a series of sensitivity analyses were conducted, thus enhancing the stability of our research results and confirming the credibility of our conclusions.
Meanwhile, this study is not without certain limitations. First, stroke cases were identified through self-reported physician-diagnosed stroke, which could be susceptible to recall and response biases. Second, the eGDR computation equation was originally established for individuals with type 1 diabetes; although current research confirms its suitability in the general public, its application in varied populations still requires further verification. In addition, hypertension status in the eGDR formula incorporated objectively measured blood pressure in addition to self-reported diagnosis, reducing potential misclassification, although residual misclassification cannot be excluded. Third, despite adjusting for various confounders in the models, unmeasured residual confounding may still exist. Fourth, the median eGDR cutoff (9.92 mg/kg/min) was derived from the present cohort, which included participants with diabetes and had an older age structure; therefore, this cutoff is population-specific and may not be directly generalizable to non-diabetic or younger populations. Fifth, although participants with prevalent stroke at baseline were excluded, the possibility of reverse causation cannot be fully ruled out, as pre-existing subclinical cerebrovascular damage may have influenced both eGDR and hsCRP levels. Finally, stroke is a heterogeneous disease comprising distinct subtypes with different etiologies and risk factor profiles[41]. As stroke events in the CHARLS were ascertained through self-reported physician diagnosis without neuroimaging data or etiological classification, we were unable to differentiate stroke subtypes; whether the association between combined eGDR and hsCRP exposure and stroke risk varies across subtypes warrants investigation in future studies with detailed stroke phenotyping.
In conclusion, this nationwide prospective cohort study suggests that combined exposure to low eGDR and elevated hsCRP is significantly associated with increased stroke risk among Chinese middle-aged and older adults, with bidirectional partial statistical mediation between the two biomarkers. Given their low cost and routine availability, joint assessment of eGDR and hsCRP provides a simple, low-cost complementary tool for stroke risk stratification and early identification of high-risk individuals in primary care settings.
DECLARATIONS
Acknowledgments
The Graphical Abstract was created using BioRender (Link: https://www.biorender.com).
Authors’ contributions
Data collection, methodology, writing—original draft, investigation: Zhao M
Data collection, software, writing—original draft, resources: Wu Y, Jiang L
Methodology, writing—review and editing, project administration: Dai N
Conceptualization, writing—review and editing, formal analysis: Lu F
All authors read and approved the final manuscript.
Availability of data and materials
The CHARLS datasets underpinning the results of the present study are publicly accessible at the official website: https://charls.pku.edu.cn/.
AI and AI-assisted tools statement
Not applicable.
Financial support and sponsorship
The present study received funding from the Parallel Initiative within the Research Ward Excellence Clinical Research Program (BRWEP2024Z014170102).
Conflicts of interest
All authors declared that there are no conflicts of interest.
Ethical approval and consent to participate
The original China Health and Retirement Longitudinal Study was approved by the Biomedical Ethics Review Committee of Peking University (approval No. IRB00001052-11015). Written informed consent was obtained from all participants before participation in the original survey. The present study was a secondary analysis of publicly available, de-identified data and involved no direct contact with participants. Therefore, additional ethical approval and informed consent were waived.
Consent for publication
Not applicable.
Copyright
© The Author(s) 2026
Supplementary Materials
REFERENCES
1. Feigin VL, Stark BA, Johnson CO, et al. Global, regional, and national burden of stroke and its risk factors, 1990-2019: a systematic analysis for the Global Burden of Disease Study 2019. Lancet Neurol. 2021;20:795-820.
2. Feigin VL, Abate MD, Abate YH, et al. Global, regional, and national burden of stroke and its risk factors, 1990-2021: a systematic analysis for the Global Burden of Disease Study 2021. Lancet Neurol. 2024;23:973-1003.
4. Tu W, Zhao Z, Yin P, et al. Estimated burden of stroke in China in 2020. JAMA Netw Open. 2023;6:e231455.
5. Pandian JD, Gall SL, Kate MP, et al. Prevention of stroke: a global perspective. Lancet. 2018;392:1269-78.
6. Hill MA, Yang Y, Zhang L, et al. Insulin resistance, cardiovascular stiffening and cardiovascular disease. Metabolism. 2021;119:154766.
7. Balakumar P, Maung-U K, Jagadeesh G. Prevalence and prevention of cardiovascular disease and diabetes mellitus. Pharmacol Res. 2016;113:600-9.
8. Kernan WN, Inzucchi SE, Viscoli CM, et al. Impaired insulin sensitivity among nondiabetic patients with a recent TIA or ischemic stroke. Neurology. 2003;60:1447-51.
9. Ding P, Zhang H, Wang J, et al. Insulin resistance in ischemic stroke: mechanisms and therapeutic approaches. Front Endocrinol. 2022;13:1092431.
10. Chen Y, Zheng L, Zhou Y, Hou Y, Zhou Y, Shen H. The role of cardiovascular disease in the association between estimated glucose disposal rate and chronic kidney disease. Sci Rep. 2025;15:16034.
11. Huo G, Yao Z, Yang X, Wu G, Chen L, Zhou D. Association between estimated glucose disposal rate and stroke in middle-aged and older chinese adults: a nationwide prospective cohort study. J Am Heart Assoc. 2025;14:e039152.
12. Liao J, Wang L, Duan L, et al. Association between estimated glucose disposal rate and cardiovascular diseases in patients with diabetes or prediabetes: a cross-sectional study. Cardiovasc Diabetol. 2025;24:13.
13. Peng J, Zhang Y, Zhu Y, et al. Estimated glucose disposal rate for predicting cardiovascular events and mortality in patients with non-diabetic chronic kidney disease: a prospective cohort study. BMC Med. 2024;22:411.
14. Kaptoge S, Di Angelantonio E, Lowe G, et al. C-reactive protein concentration and risk of coronary heart disease, stroke, and mortality: an individual participant meta-analysis. Lancet. 2010;375:132-40.
15. Rolver MG, Emanuelsson F, Nordestgaard BG, Benn M. C-reactive protein and prospective cardiometabolic risk: observational and Mendelian randomization study of ischemic stroke and all-cause death. Cardiovasc Diabetol. 2025;25:11.
16. Sabatine MS, Morrow DA, Jablonski KA, et al. Prognostic significance of the Centers for Disease Control/American Heart Association high-sensitivity c-reactive protein cut points for cardiovascular and other outcomes in patients with stable coronary artery disease. Circulation. 2007;115:1528-36.
17. Shahid R, Chu LM, Arnason T, Pahwa P. Association between insulin resistance and the inflammatory marker c-reactive protein in a representative healthy adult Canadian population: results from the Canadian health measures survey. Can J Diabetes. 2023;47:428-34.
18. Chen X, Crimmins E, Hu P, et al. Venous blood-based biomarkers in the China health and retirement longitudinal study: rationale, design, and results from the 2015 wave. Am J Epidemiol. 2019;188:1871-7.
19. of Medical Administration, National Health Commission of the People′s Republic of China. Guideline for diagnosis and treatment of obesity (2024 edition). Chin J Dig Surg. 2024;23:1237-60.
20. Mcevoy JW, Mccarthy CP, Bruno RM, et al. 2024 ESC guidelines for the management of elevated blood pressure and hypertension. Eur Heart J. 2024;45:3912-4018.
22. Vanderweele TJ, Ding P. Sensitivity analysis in observational research: introducing the E-value. Ann Intern Med. 2017;167:268-74.
23. Alba AC, Agoritsas T, Walsh M, et al. Discrimination and calibration of clinical prediction models: users’ guides to the medical literature. JAMA. 2017;318:1377.
24. Vanderweele TJ. Mediation analysis: a practitioner's guide. Annu Rev Public Health. 2016;37:17-32.
25. Zabala A, Darsalia V, Lind M, et al. Estimated glucose disposal rate and risk of stroke and mortality in type 2 diabetes: a nationwide cohort study. Cardiovasc Diabetol. 2021;20:202.
26. Lu Z, Xiong Y, Feng X, et al. Insulin resistance estimated by estimated glucose disposal rate predicts outcomes in acute ischemic stroke patients. Cardiovasc Diabetol. 2023;22:225.
27. Han Y, Zhang K, Luo Y, et al. Relationship between stroke and estimated glucose disposal rate: results from two prospective cohort studies. Lipids Health Dis. 2024;23:392.
28. Huang X, Dong P, Xu Y, et al. Associations of estimated glucose disposal rate with stroke risk and poststroke adverse outcomes: a prospective cohort study. CNS Neurosci Ther. 2025;31:e70420.
29. Zhou Y, Han W, Gong D, Man C, Fan Y. Hs-CRP in stroke: a meta-analysis. Clin Chim Acta. 2016;453:21-7.
30. Chen L, Wang M, Yang C, Wang Y, Hou B. The role of high-sensitivity C-reactive protein serum levels in the prognosis for patients with stroke: a meta-analysis. Front Neurol. 2023;14:1199814.
31. Gao Y, Duan Z, Li J, et al. Combined effect of chronic inflammation and insulin resistance on stroke: a cohort study and mediation analysis. Eur J Med Res. 2025;30:1056.
32. Cui C, Liu L, Qi Y, et al. Joint association of TyG index and high sensitivity C-reactive protein with cardiovascular disease: a national cohort study. Cardiovasc Diabetol. 2024;23:156.
33. Xu L, Ma J, Xu Y. The effects of estimated glucose disposal rate and high sensitivity C-reactive protein on risk of incident cardiovascular diseases in middle-aged and elderly Chinese adults: a nationwide prospective cohort study. Lipids Health Dis. 2025;24:234.
34. Matsumoto K, Fujita N, Ozaki M, Tominaga T, Ueki Y, Miyake S. Coexistence of insulin resistance and inflammation effectively predicts cardiac disease but not stroke in Japanese patients with type 2 diabetes mellitus. Diabetes Res Clin Pract. 2006;74:316-21.
35. Shoelson SE, Lee J, Goldfine AB. Inflammation and insulin resistance. J Clin Investig. 2006;116:1793-801.
36. Xi L, Xiao C, Bandsma RH, Naples M, Adeli K, Lewis GF. C-reactive protein impairs hepatic insulin sensitivity and insulin signaling in rats: role of mitogen-activated protein kinases. Hepatology. 2011;53:127-35.
37. Lawler PR, Bhatt DL, Godoy LC, et al. Targeting cardiovascular inflammation: next steps in clinical translation. Eur Heart J. 2021;42:113-31.
38. Yan Y, Li S, Liu Y, et al. Temporal relationship between inflammation and insulin resistance and their joint effect on hyperglycemia: the Bogalusa Heart Study. Cardiovasc Diabetol. 2019;18:109.
39. Ridker PM. A test in context: high-sensitivity C-reactive protein. J Am Coll Cardiol. 2016;67:712-23.
40. Segura B, Jurado MÁ, Freixenet N, Bargalló N, Junqué C, Arboix A. White matter fractional anisotropy is related to processing speed in metabolic syndrome patients: a case-control study. BMC Neurol. 2010;10:64.
Cite This Article
 Open Access
How to Cite
Download Citation
Export Citation File:
Type of Import
Tips on Downloading Citation
Citation Manager File Format
Type of Import
Direct Import: When the Direct Import option is selected (the default state), a dialogue box will give you the option to Save or Open the downloaded citation data. Choosing Open will either launch your citation manager or give you a choice of applications with which to use the metadata. The Save option saves the file locally for later use.
Indirect Import: When the Indirect Import option is selected, the metadata is displayed and may be copied and pasted as needed.
About This Article
Copyright

Data & Comments
Data
0










Comments
Comments must be written in English. Spam, offensive content, impersonation, and private information will not be permitted. If any comment is reported and identified as inappropriate content by OAE staff, the comment will be removed without notice. If you have any queries or need any help, please contact us at [email protected].