

fig4

Impact of estimated glucose disposal rate and high-sensitivity C-reactive protein on the risk of new-onset stroke: a nationwide prospective cohort study

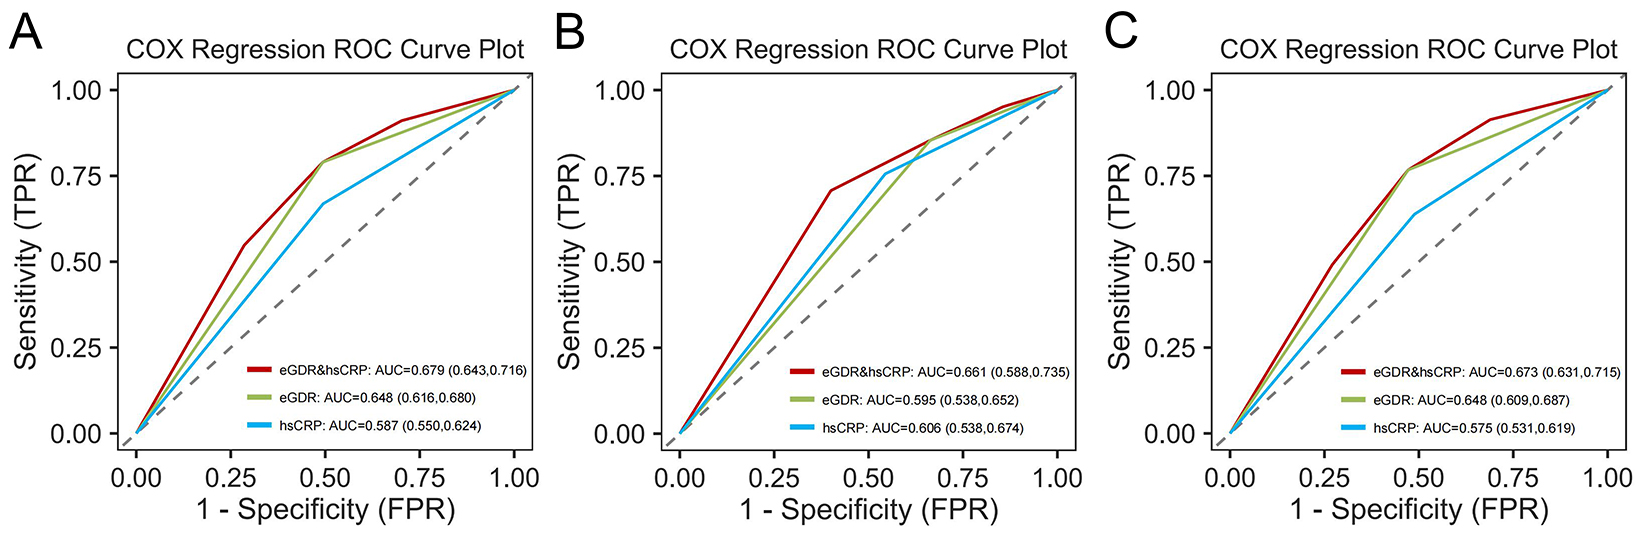
Figure 4. ROC curves for predicting stroke risk using eGDR and hsCRP. (A) Overall population; (B) HD; (C) Non-HD. The ROC analyses evaluated models containing the biomarker(s) only, without clinical covariates. eGDR: Estimated glucose disposal rate; hsCRP: high-sensitivity C-reactive protein; HD: heart disease; ROC: receiver operating characteristic; AUC: area under the curve.


The Journal of Cardiovascular Aging
ISSN 2768-5993 (Online)

Portico

All published articles are preserved here permanently:

https://www.portico.org/publishers/oae/

Portico

All published articles are preserved here permanently:

https://www.portico.org/publishers/oae/


