

fig2
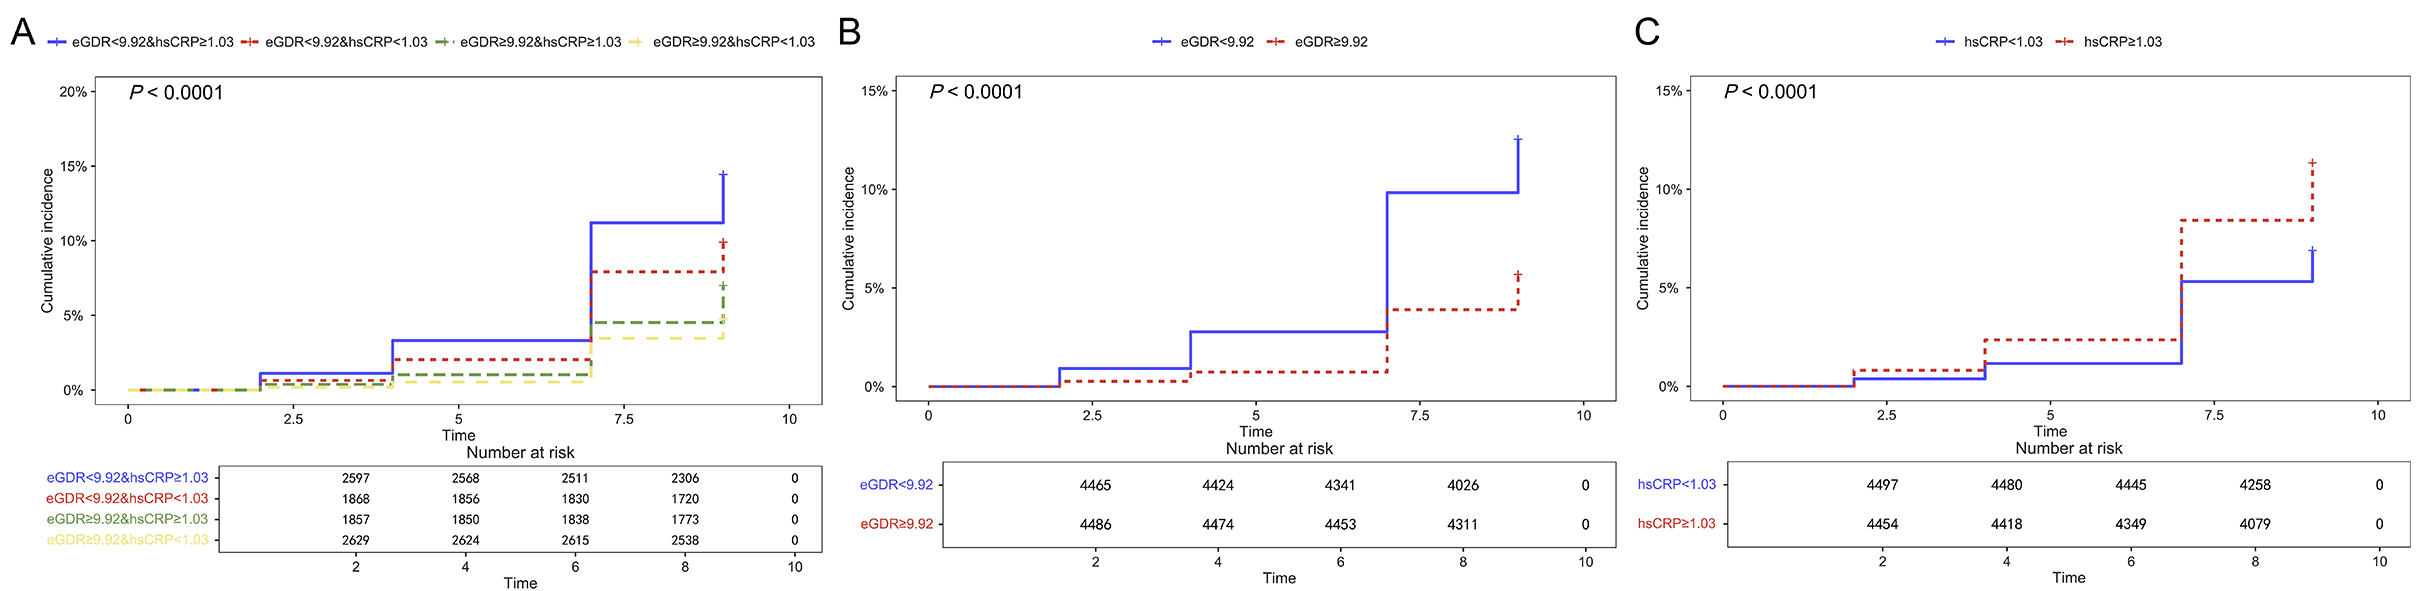
Figure 2. Kaplan-Meier plots of cumulative stroke incidence based on eGDR, hsCRP, and combined eGDR & hsCRP groups. (A) eGDR & hsCRP; (B) eGDR; (C) hsCRP. The y-axis represents the cumulative incidence of stroke, estimated as 1 minus the Kaplan-Meier survival probability. Participants were stratified using the median values of eGDR (9.92 mg/kg/min) and hsCRP (1.03 mg/L) as cutoffs. Log-rank tests showed significant differences among the groups in all panels (all P < 0.001). eGDR: Estimated glucose disposal rate; hsCRP: high-sensitivity C-reactive protein.




