

fig3
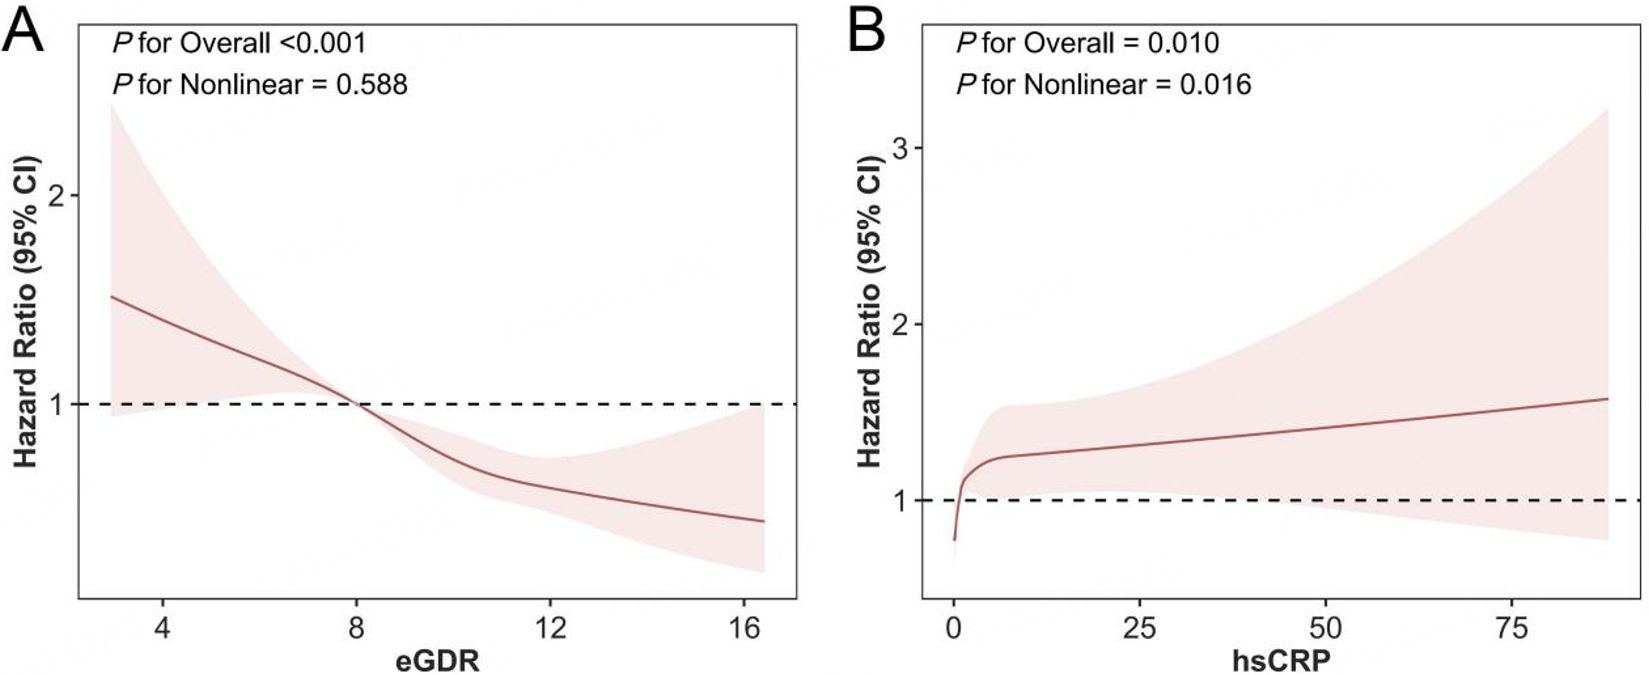
Figure 3. Restricted cubic spline curves for stroke based on eGDR and hsCRP. (A) eGDR; (B) hsCRP. The solid line represents the HR, and the shaded area represents the 95%CI. The horizontal dashed line indicates a HR of 1.0. The adjusted model was selected based on the Boruta algorithm and clinical experience, incorporating adjustments for age, sex, education level, marital status, work status, disability, smoking, alcohol consumption, BMI, hyperlipidemia, DM, HD, lipid-lowering medication, glucose-lowering medication, and antihypertensive medication. CI: Confidence interval; eGDR: estimated glucose disposal rate; hsCRP: high-sensitivity C-reactive protein; BMI: body mass index; DM: diabetes mellitus; HD: heart disease.




