

fig1
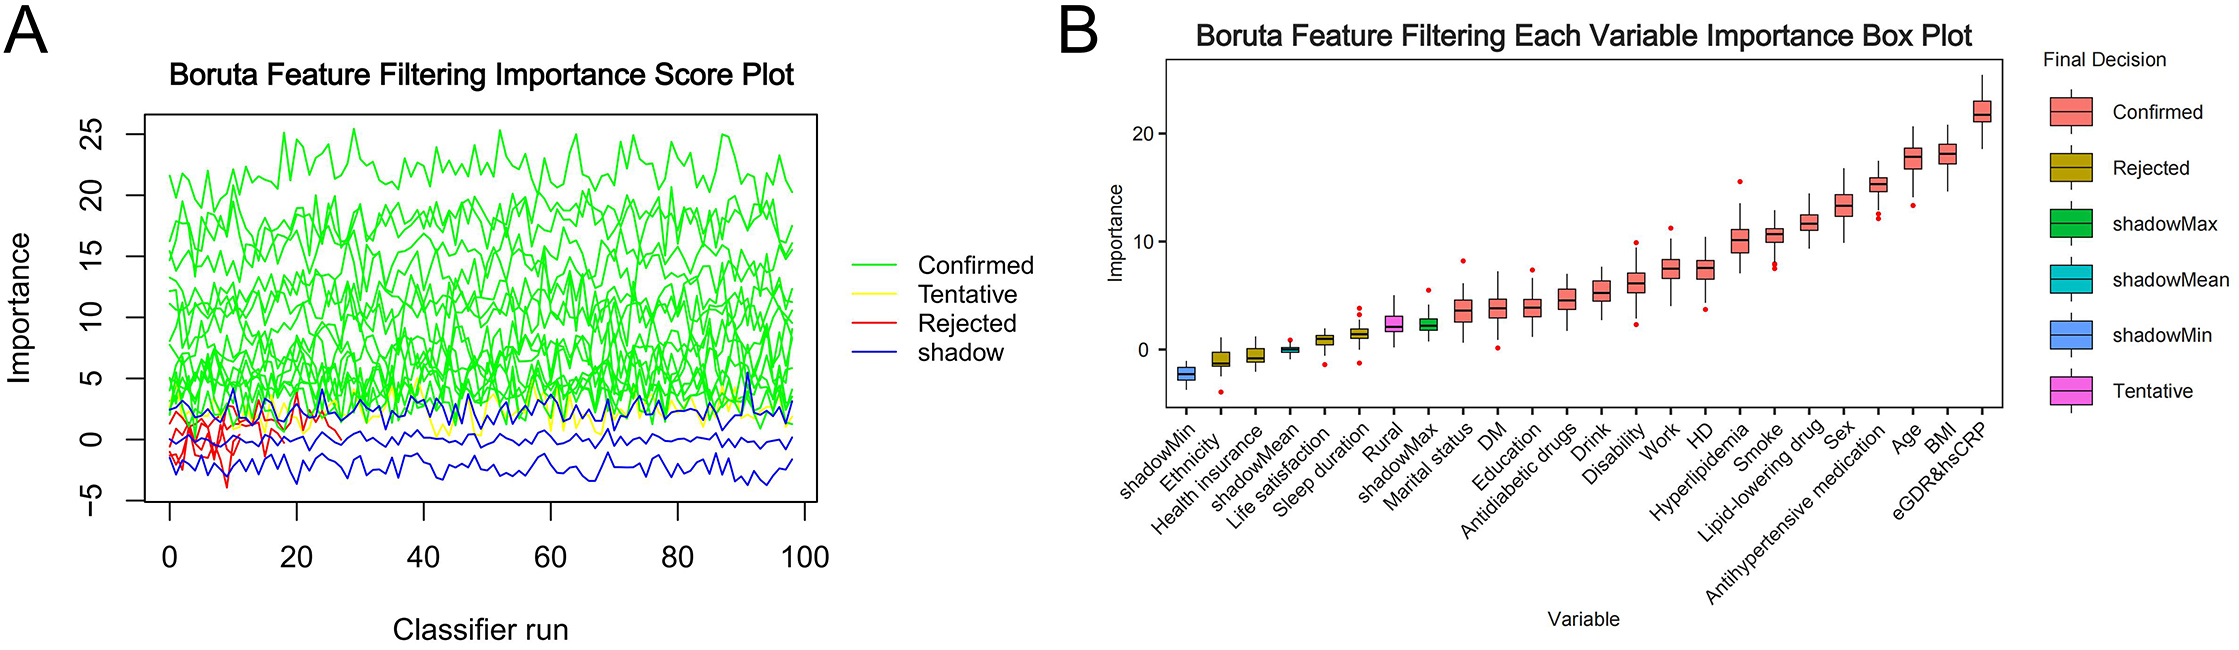
Figure 1. Feature selection for stroke based on the Boruta algorithm. (A) importance trajectory across Boruta runs; (B) boxplot of variable importance (Z-values) by final decision. The horizontal axis in (A and B) represents the number of classifier runs and the names of each variable, respectively, while the vertical axis represents the Z-value of each variable. Red boxes and lines represent variables confirmed by the model calculation, purple represents tentative attributes, and yellow represents rejected variables. eGDR: Estimated glucose disposal rate; hsCRP: high-sensitivity C-reactive protein; BMI: body mass index; DM: diabetes mellitus; HD: heart disease.




