



Deep learning-based prognostic prediction in ischemic heart failure using SPECT myocardial perfusion imaging
 0
0 Abstract
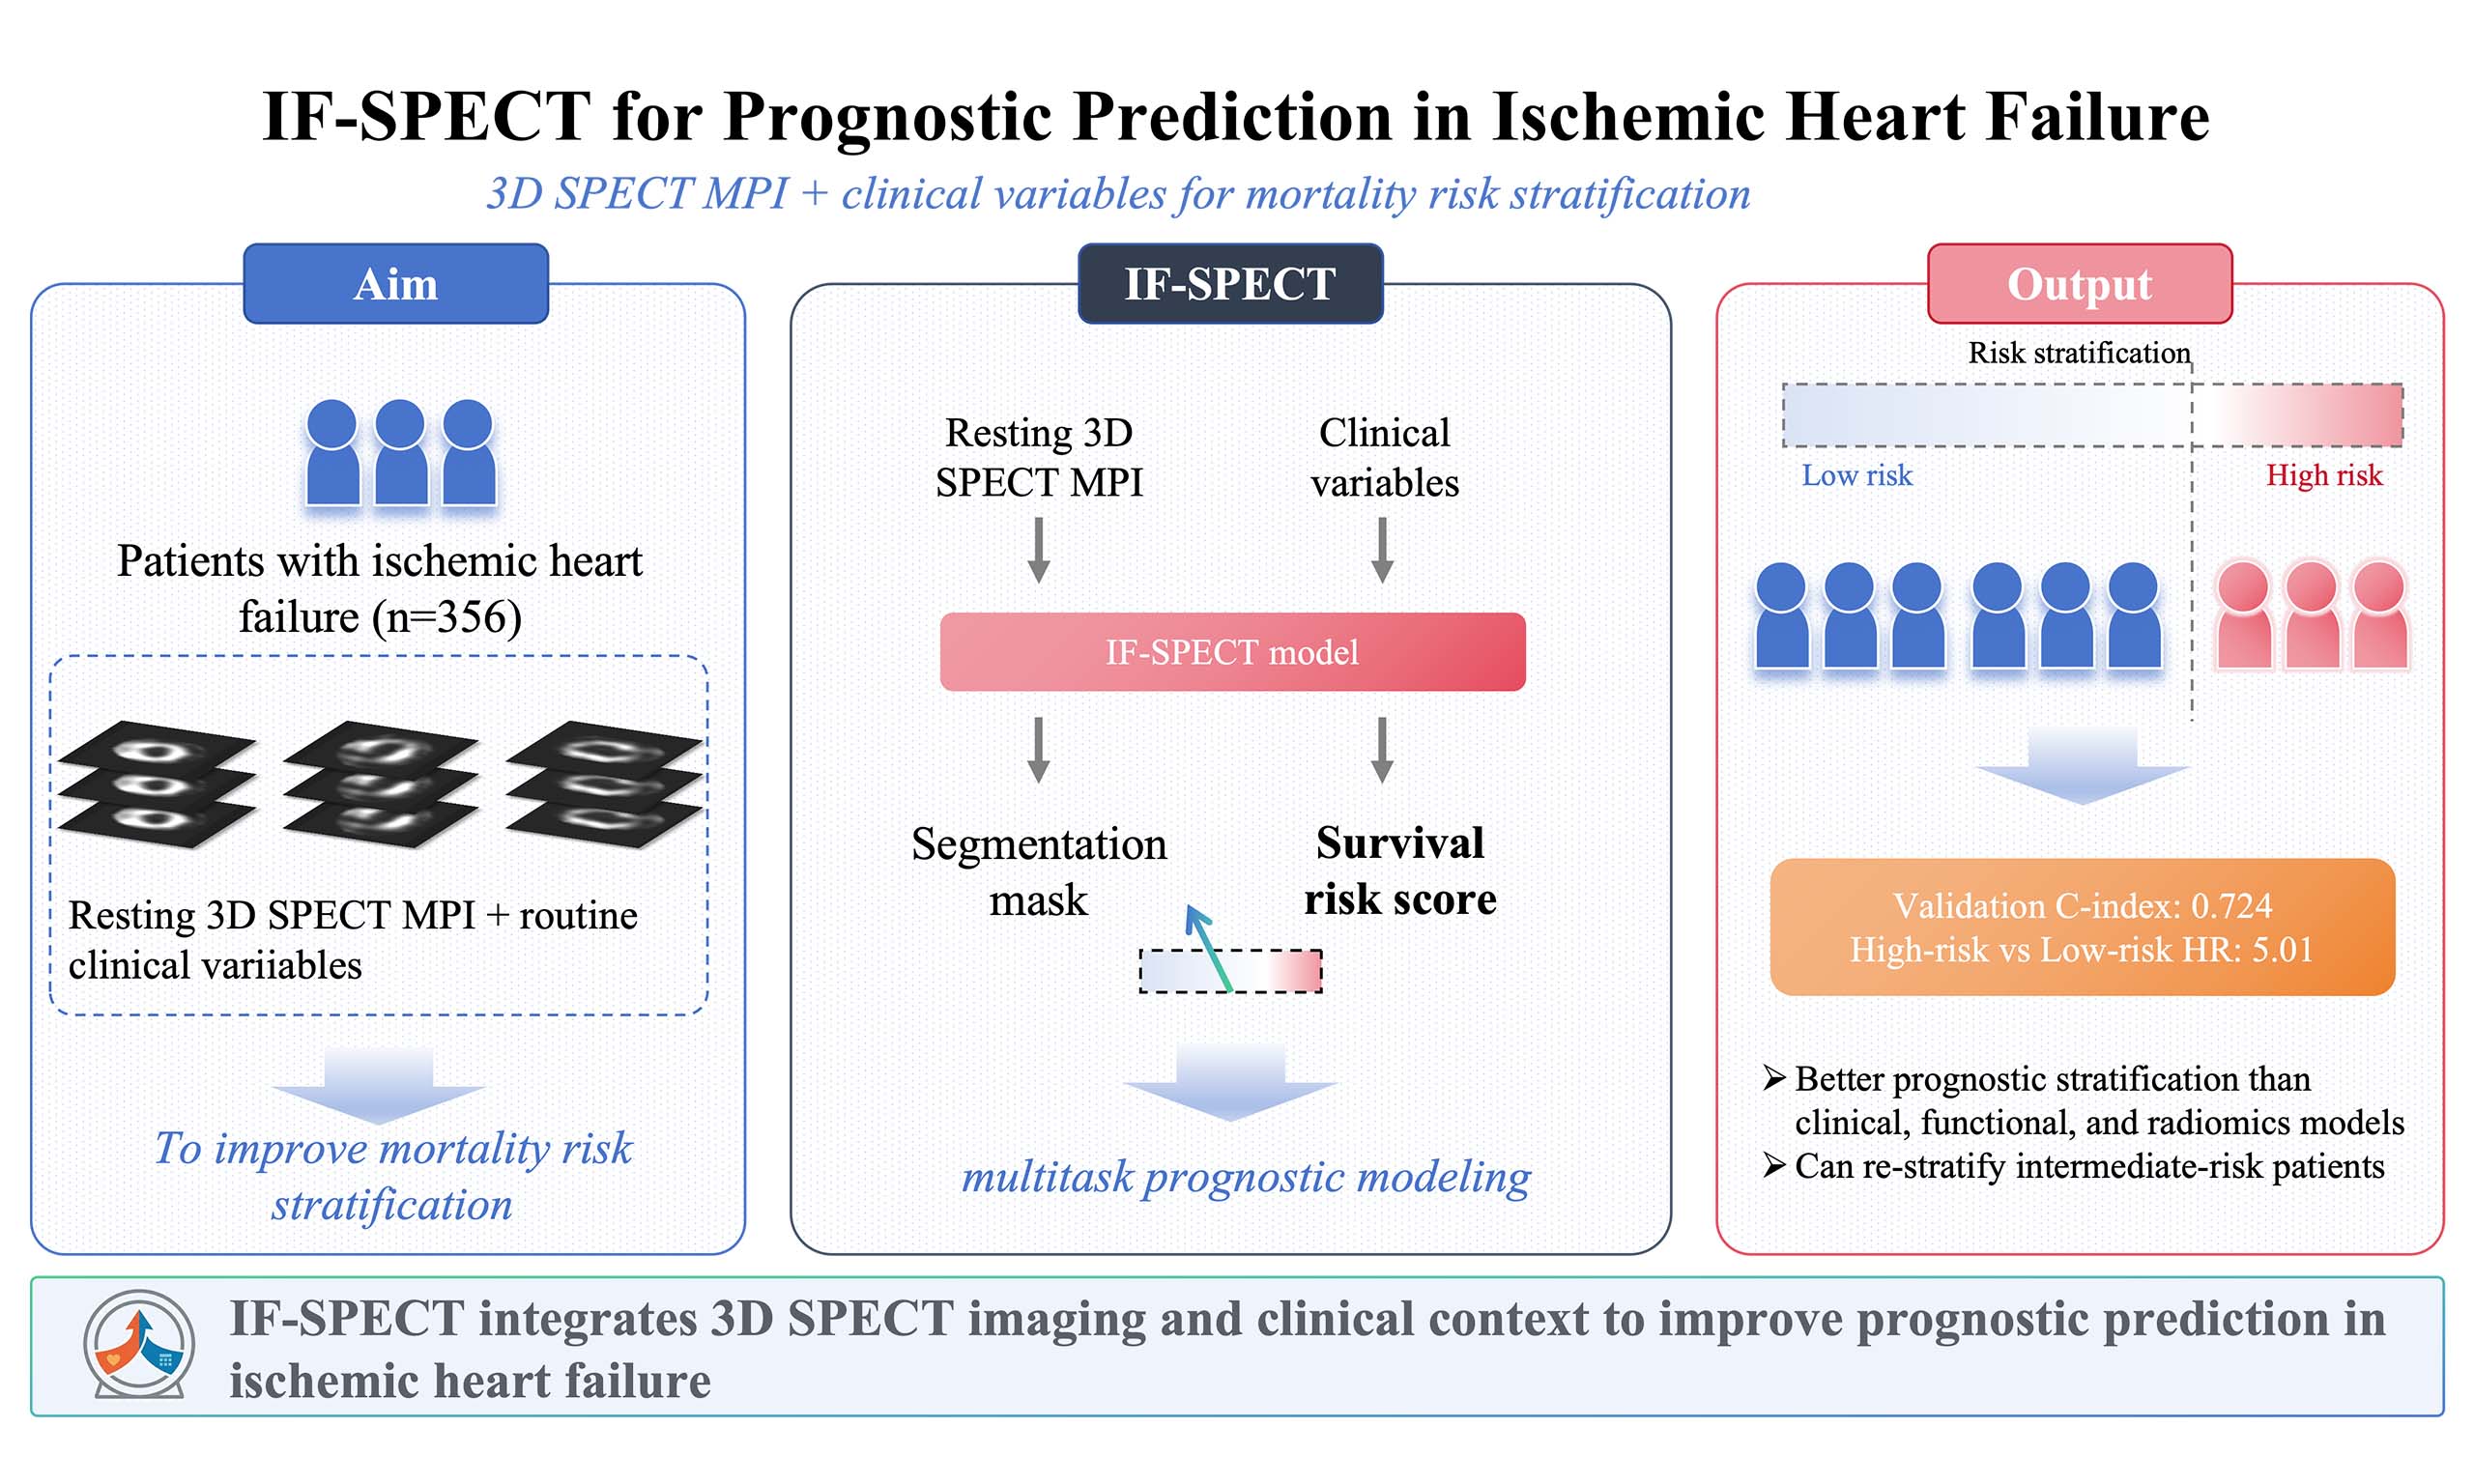
Aim: This study aimed to develop and validate a multitask deep learning model, termed the information fusion model for single-photon emission computed tomography (SPECT)-based prognosis (IF-SPECT), for predicting all-cause mortality in patients with ischemic heart failure (IHF).
Methods: We retrospectively enrolled 356 patients with IHF who underwent resting-state SPECT myocardial perfusion imaging at Beijing Anzhen Hospital between 2017 and 2022. The cohort was divided into a training set (n = 213) and a validation set (n = 143). IF-SPECT uses a 3D U-Net backbone with a structure-aware module to simultaneously perform left ventricular segmentation (auxiliary task) and survival prediction (main task). A deep learning-derived risk score was generated from 3D SPECT images and then integrated with clinical variables (age, sex, body mass index, and NYHA_3_4) in the final prognostic model.
Results: IF-SPECT achieved the highest C-index in the validation cohort (0.724; 95%CI: 0.621-0.814), outperforming both the clinical and radiomics models in paired bootstrap testing. In the validation cohort, patients classified as high-risk by IF-SPECT had a significantly higher risk of all-cause mortality than those in the low-risk group (HR: 5.01; 95%CI: 2.17-11.59; P < 0.001). Exploratory subgroup analyses suggested that IF-SPECT further restratified patients within the low HM_TPD subgroup into distinct prognostic categories.
Conclusion: IF-SPECT provides a promising approach for prognostic risk stratification in IHF by combining a deep learning-derived imaging risk score with routine clinical variables.
Keywords
INTRODUCTION
Ischemic heart failure (IHF) represents an advanced and critical stage of coronary artery disease and remains a leading cause of morbidity and mortality worldwide[1,2]. Despite substantial advances in guideline-directed medical therapy, long-term outcomes for patients with IHF remain poor, with persistently high rates of all-cause mortality and rehospitalization[3,4]. Accurate prognostic stratification is therefore central to clinical decision-making, as it guides both treatment intensity and the identification of candidates for advanced device therapy or heart transplantation.
Current guidelines emphasize multidimensional risk assessment; however, widely used methods often fail to fully characterize the heterogeneous risk profiles of patients with IHF[4,5]. Traditionally, clinicians have relied on clinical characteristics and left ventricular ejection fraction (LVEF), the cornerstone of risk stratification, to predict outcomes. However, LVEF reflects only global systolic function and does not capture the spatial heterogeneity of myocardial injury[6,7]. To address this limitation, single-photon emission computed tomography (SPECT)-derived semiquantitative parameters, such as (total perfusion deficit (TPD), %LV), have been introduced and have shown prognostic value for major adverse cardiovascular events (MACEs)[8]. More recently, radiomics has emerged as a method for quantifying perfusion heterogeneity beyond visual interpretation, including myocardial perfusion imaging (MPI) SPECT-based coronary artery disease (CAD) diagnosis and risk classification[9]. Nevertheless, these conventional approaches remain limited: TPD relies on threshold-based volumetric summaries that disregard higher-order information, whereas radiomics depends on predefined, handcrafted features that are sensitive to segmentation variability and image noise[10]. Consequently, accurate stratification of patients, particularly those with intermediate-risk profiles, remains a major clinical challenge.
Deep learning (DL), particularly convolutional neural networks, enables data-driven extraction of complex features directly from medical images and has shown promise in nuclear cardiology[11]. In SPECT MPI, recent studies have expanded DL applications to automated CAD diagnosis, explainable model deployment, and AI-enhanced perfusion scoring[12-15]. At present, many DL applications in SPECT imaging still rely on 2D polar maps (bull's-eye plots) or related 2D perfusion representations as input[16-18]. However, transformation from 3D to 2D inevitably causes loss of volumetric spatial geometry[19]. Recent multicenter work has further emphasized external validation and incorporation of clinical information in DL-based MP-SPECT prediction models[20]. Moreover, most existing models focus exclusively on imaging data, potentially overlooking the systemic nature of heart failure, whereas clinical variables provide complementary prognostic information[21-23]. Standard DL approaches are also frequently criticized for limited interpretability[24], raising concerns that models may inadvertently focus on background noise rather than true myocardial pathology.
In this retrospective study, we aimed to develop and validate an Information Fusion deep learning model (IF-SPECT) for predicting all-cause mortality in patients with IHF. Specifically, we investigated whether a deep learning-derived risk score generated from 3D SPECT images and subsequently combined with clinical variables could yield superior prognostic performance compared with standard clinical scores, quantitative SPECT parameters, and radiomics analysis. Furthermore, we evaluated the model's clinical utility in identifying high-risk individuals among patients classified as having intermediate anatomical severity.
MATERIALS AND METHODS
Study population
This retrospective study included 356 patients diagnosed with IHF who underwent resting-state SPECT MPI at Beijing Anzhen Hospital between 2017 and 2022. This study used only de-identified secondary data. According to the official ethics exemption documentation issued by the Ethics Committee of Beijing Anzhen Hospital (No. 2026056x), the study met the criteria for exemption from ethics review because it involved no direct contact with human participants and no risk of harm to participant rights or interests. Accordingly, no direct informed-consent process was conducted in this retrospective study. Patients were enrolled according to established IHF guidelines[4,5] and the availability of complete imaging and follow-up data. Detailed inclusion and exclusion criteria, together with the patient enrollment flowchart, are provided in Supplementary Figure 1.
All patients underwent standardized resting SPECT/CT imaging using a Siemens system with IQ-SPECT technology. Images were reconstructed using the Flash-3D algorithm with CT-based attenuation and scatter correction. For deep learning input, raw images underwent standardized preprocessing, including resampling, cropping of the left ventricle volume of interest (VOI), and Z-score intensity normalization. Detailed acquisition parameters and preprocessing pipelines (including data augmentation strategies) are described in the Supplementary Materials. Baseline clinical variables, including age, sex, body mass index (BMI), and New York Heart Association-related data, were obtained from electronic medical records. For model construction, New York Heart Association functional classification (NYHA) was dichotomized as NYHA_3_4 (I-II vs. III-IV). Missing values were handled only for the clinical variables used in the final IF-SPECT model (age, sex, BMI, and NYHA_3_4). Missing values in the clinical variables used in the final IF-SPECT model were handled using K-nearest neighbor imputation (k = 5)[25]. Imputation was performed separately within the training and validation cohorts to avoid information leakage. Treatment-strategy information and HM_TPD were available only in a subset of 99 patients who had paired 18F-fluorodeoxyglucose-related viability assessment; therefore, these variables show a high proportion of missing values in the overall cohort and were used only for exploratory subgroup analyses rather than as input variables in the final IF-SPECT model.
To ensure independent evaluation, the cohort was divided into a training set (n = 213, 60%) and a validation set (n = 143, 40%) using stratified random sampling to maintain balanced event rates.
The IF-SPECT model development
We propose IF-SPECT, a multitask deep learning framework for survival prediction (Figure 1; detailed architecture in Figure 2). The model adopts a 3D U-Net[26,27] as the backbone encoder-decoder architecture and introduces left ventricular (LV) segmentation as an auxiliary task to guide the network's attention toward the myocardium[28,29], using a mask-guided strategy with expert-annotated supervision at the decoder output. During encoding, feature maps are further processed by a structure-aware module to enhance the representation of myocardial geometry and perfusion defects through spatial attention[30] and channel attention[31]. The deep imaging features extracted from the network bottleneck are first projected into a deep learning-based risk score, which serves as an independent imaging biomarker for survival analysis[32]. In the final stage, to incorporate clinical context, the deep learning-derived risk score is entered into a multivariate Cox proportional hazards model[33] alongside structured clinical variables (age, BMI, sex, and NYHA_3_4) to establish the final IF-SPECT predictive model. The detailed model architecture and training process are provided in the Supplementary Materials.
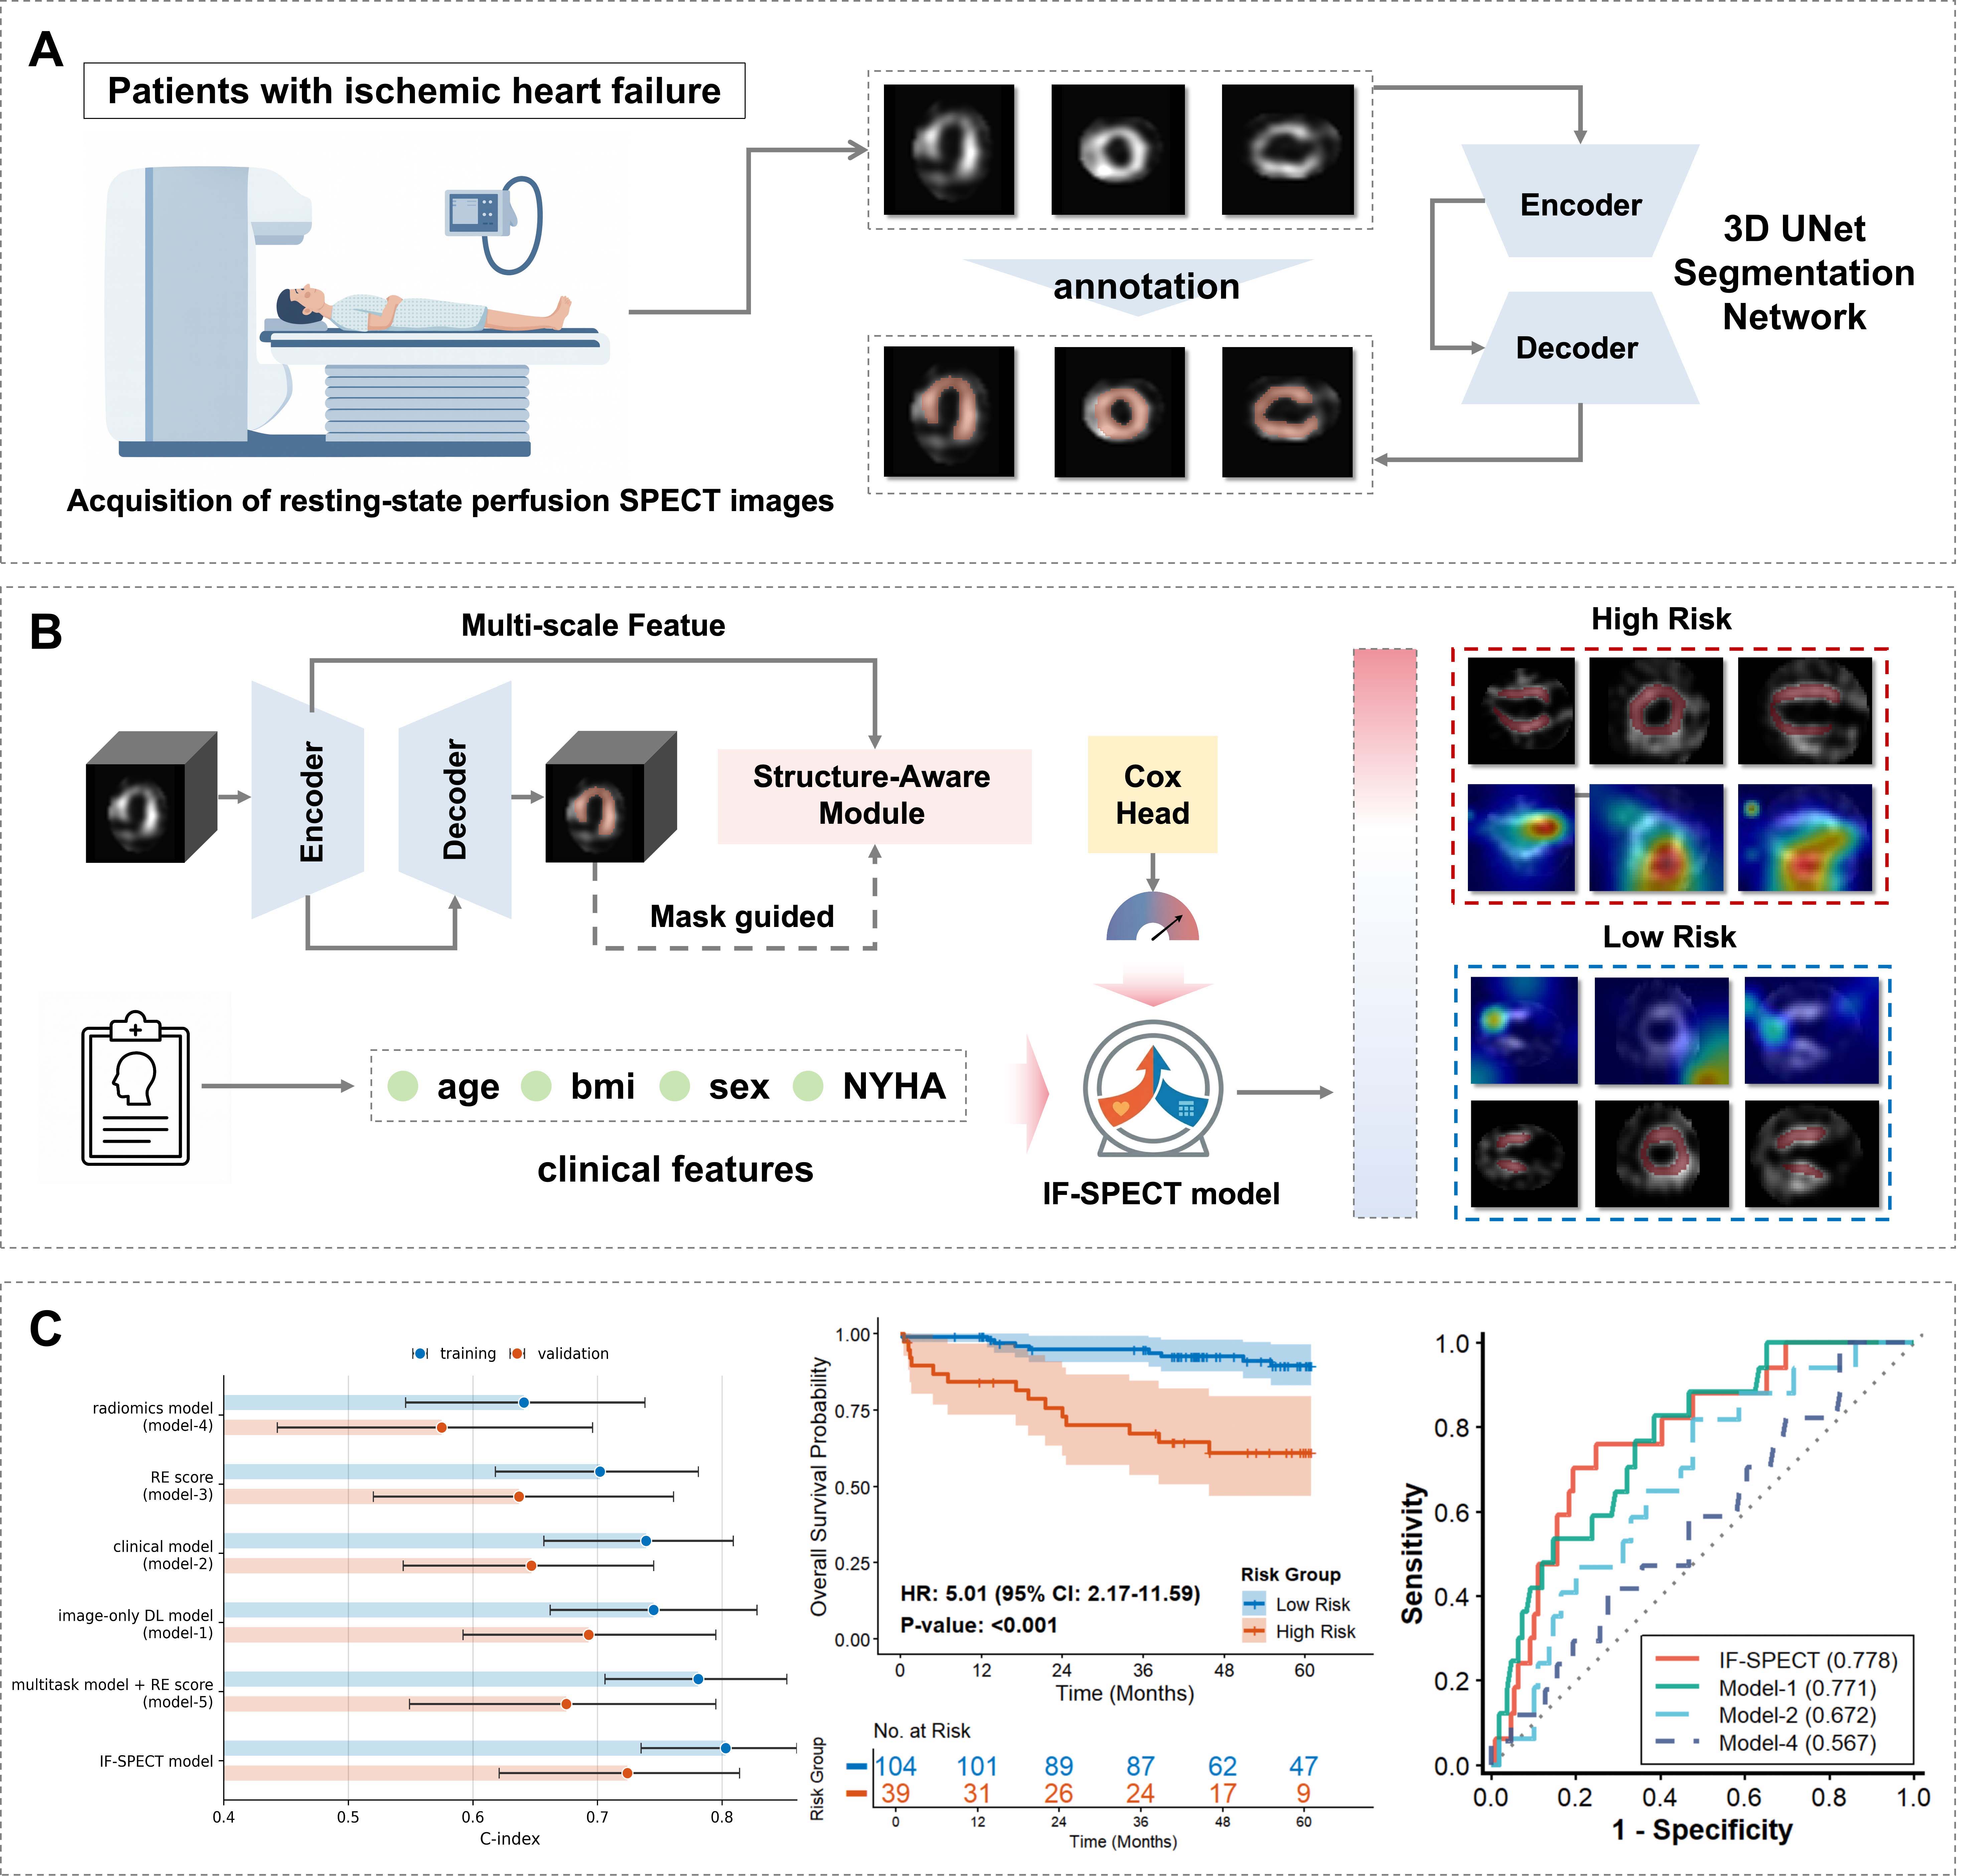
Figure 1. Overview of the study. (A) Acquisition and segmentation of resting-state perfusion SPECT images using a 3D U-Net. (B) Overall architecture of the multitask deep learning model. The neural network processes resting 3D SPECT images to generate a deep learning-derived imaging risk score, with left ventricular segmentation serving as an auxiliary task. The imaging risk score is subsequently combined with age, sex, BMI, and NYHA_3_4 in a multivariable Cox model to generate the final prognostic estimate. (C) Model performance evaluation using the C-index, Kaplan-Meier survival analysis, and time-dependent ROC curves.
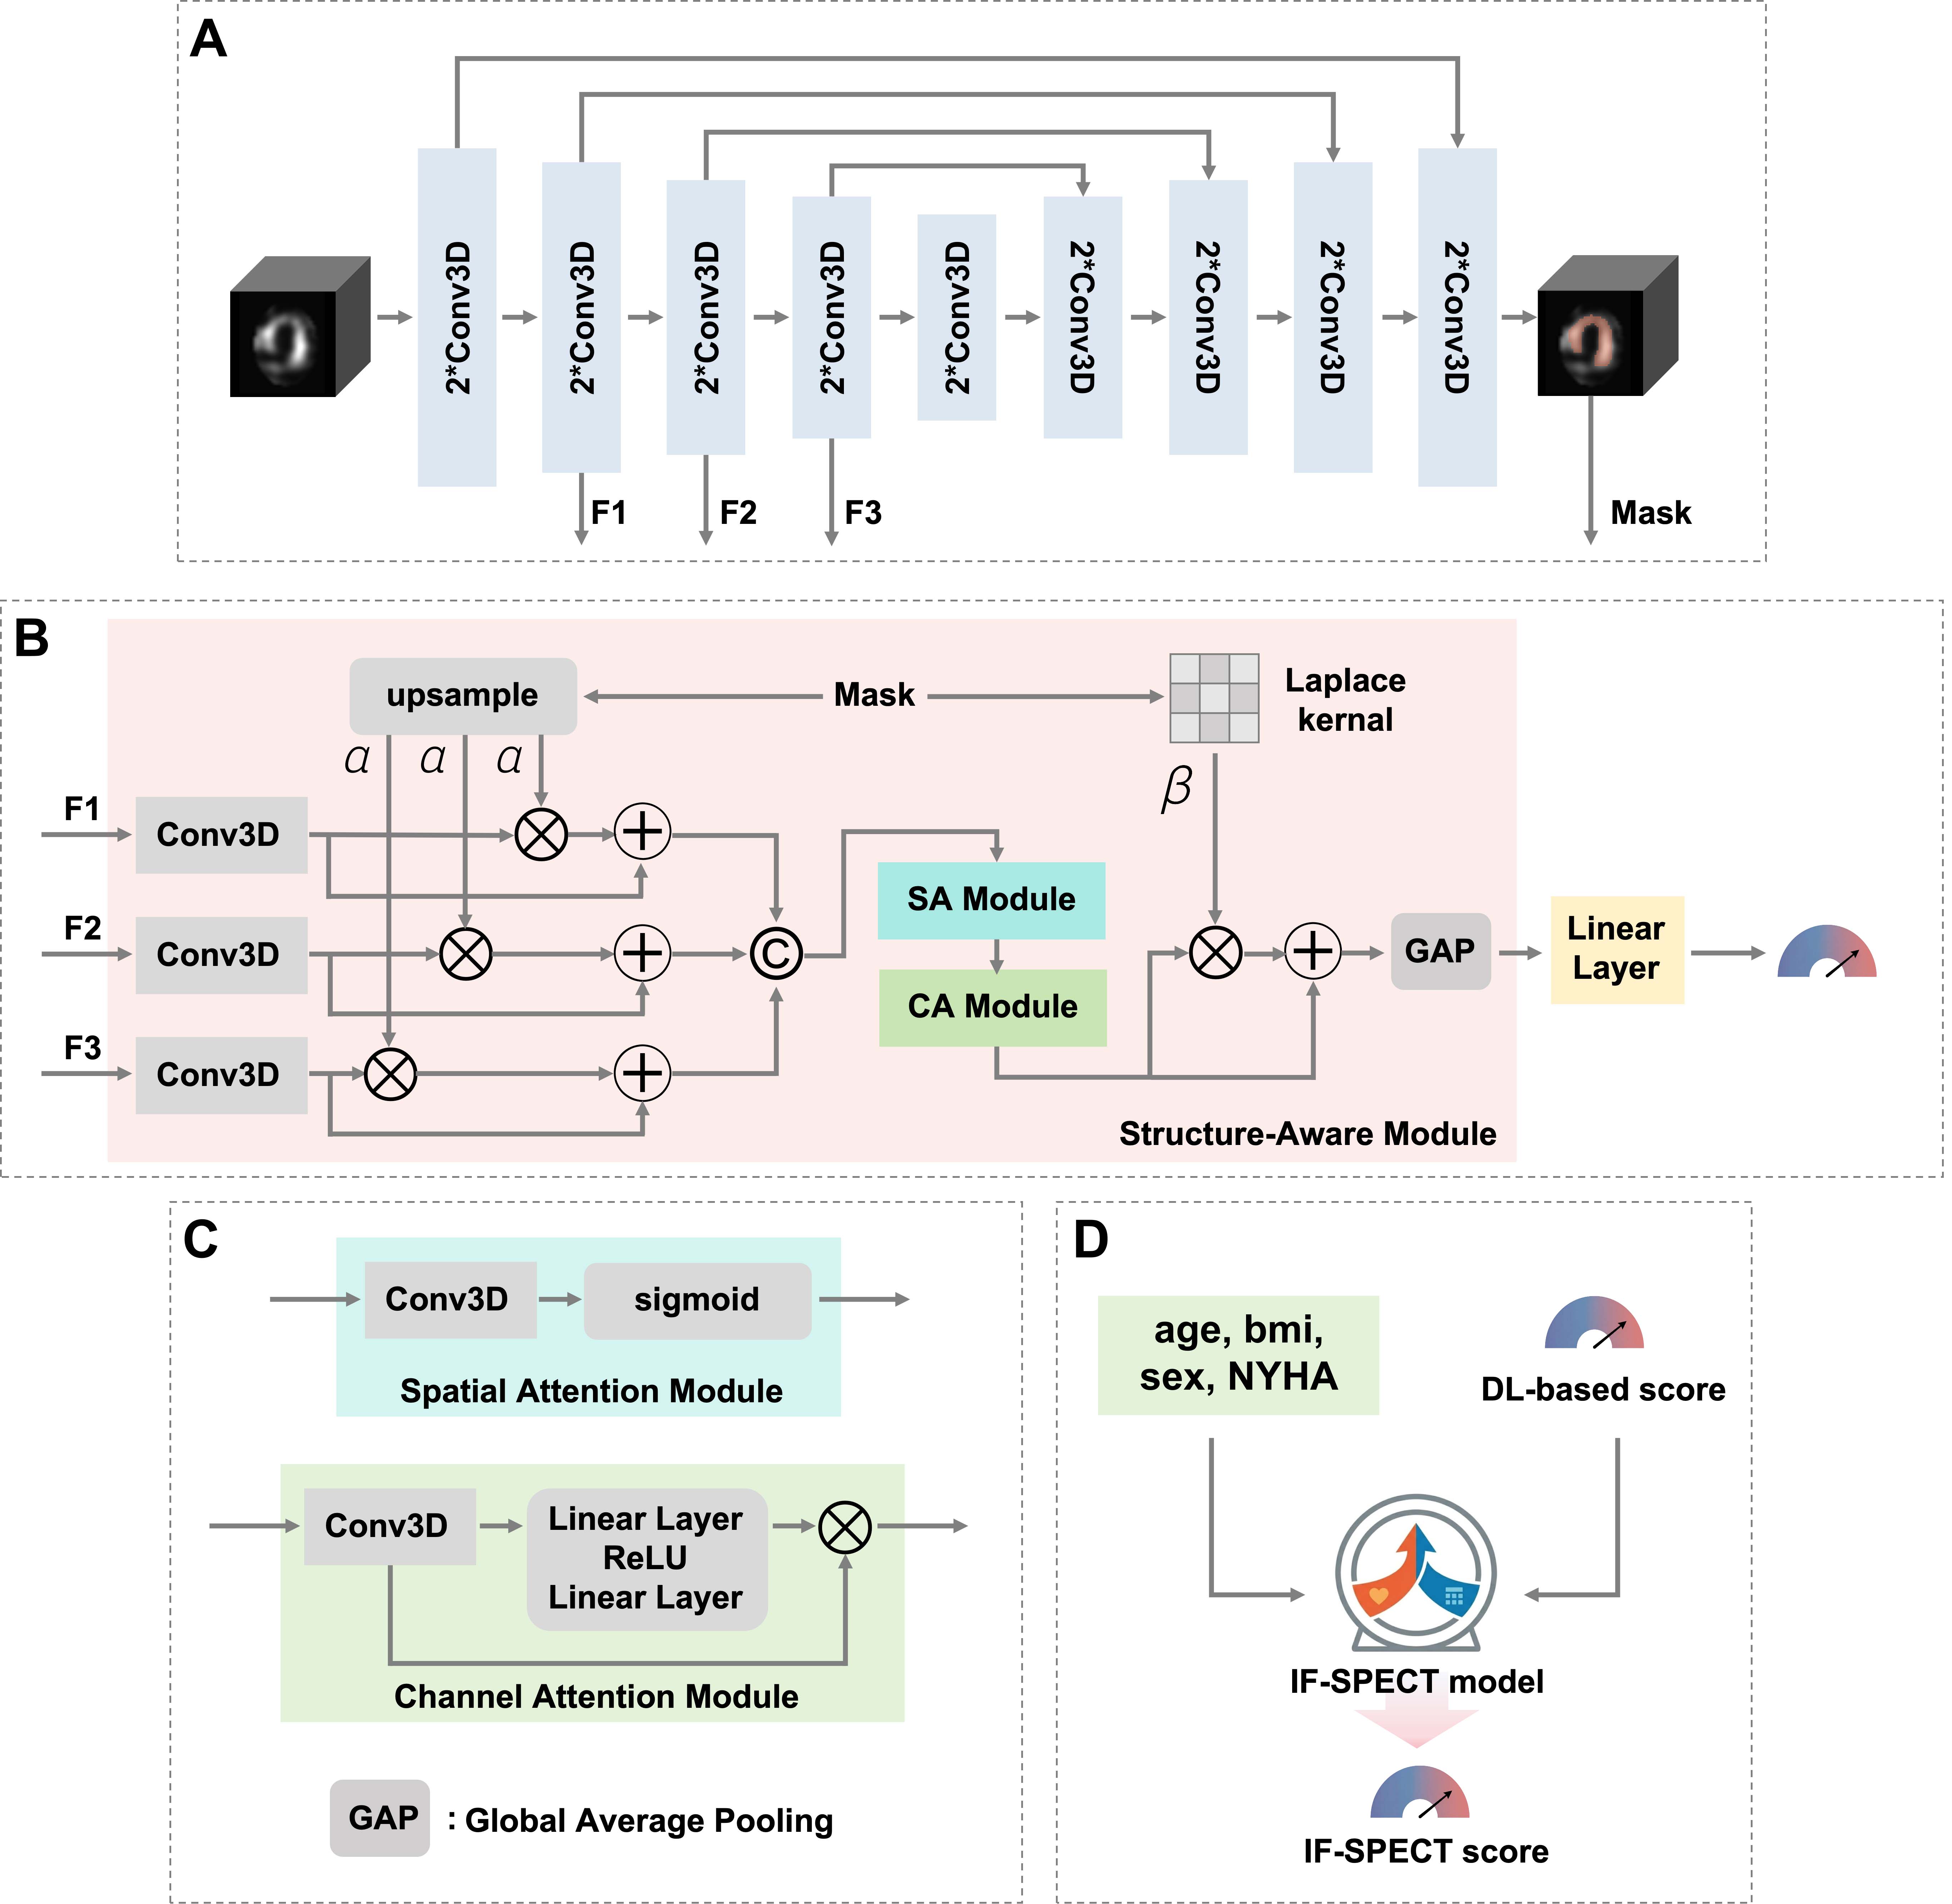
Figure 2. The overall architecture of the proposed IF-SPECT model. (A) The 3D U-Net backbone used for extracting multi-scale features (F1, F2, F3) and generating the segmentation mask. (B) The Structure-Aware Module: This module enhances feature representation using upsampled masks and a Laplace kernel, aggregating features via Spatial Attention (SA) and Channel Attention (CA) modules. (C) Detailed structure of the Spatial Attention Module (top) and Channel Attention Module (bottom). (D) Final prognostic modeling: the DL-based risk score is combined with clinical characteristics (age, BMI, sex, NYHA_3_4) in a multivariable Cox model to generate the final IF-SPECT score.
Model evaluation and comparison design
To comprehensively evaluate the prognostic performance and clinical value of IF-SPECT, we performed the following comparative and stratified analyses.
Comparison models
To benchmark the prognostic performance of the proposed IF-SPECT model, we developed and evaluated five comparison models representing different methodological approaches. Model-1 (image-only DL) used the same deep learning architecture as IF-SPECT but was trained exclusively on imaging data, without clinical variables. Model-2 (clinical model) was a standard multivariate Cox proportional hazards model constructed using only structured clinical variables. Model-3 (conventional functional model) relied on standard quantitative functional parameters derived from clinical software, specifically end-diastolic volume (EDV), end-systolic volume (ESV), and ejection fraction (EF). Model-4 (radiomics model) was constructed using a rigorous feature selection pipeline: extracted features[34] underwent Z-score normalization, univariate Cox screening (P < 0.05), and removal of highly correlated variables (r > 0.9), followed by least absolute shrinkage and selection operator (LASSO)[35] Cox regression to determine the final signature. Finally, Model-5 (integrated quantitative model) assessed the additive value of the deep learning approach by integrating the deep learning-derived risk score with conventional functional parameters (EDV, ESV, and EF) through multivariate Cox regression.
Assessment of incremental value
To determine whether IF-SPECT provides independent prognostic information beyond established risk factors, we performed multivariate Cox proportional hazards regression analysis. The IF-SPECT risk score was entered into the model together with potential clinical confounders, including age, sex, BMI, NYHA class, and conventional volumetric parameters.
Risk stratification strategy
Patients were categorized into high-risk and low-risk groups based on the predicted IF-SPECT scores. To ensure robust generalization and avoid data leakage, the cutoff value was prespecified as the 66th percentile (upper tertile) of the risk scores derived strictly from the training cohort. This threshold was then applied unchanged to the internal validation cohort. Furthermore, to assess clinical utility in ambiguous cases, we performed exploratory restratification analyses. HM_TPD was available only in a subset of patients and was not used as an input variable in the final IF-SPECT model. Therefore, analyses involving HM_TPD were performed as exploratory subgroup analyses using all patients with available HM_TPD measurements, regardless of assignment to the training or validation cohort.
Interpretability analysis
To enhance model transparency and verify that predictions were driven by biologically plausible regions, Gradient-weighted Class Activation Mapping (Grad-CAM)[36] was used to generate visual saliency maps. In addition, t-distributed Stochastic Neighbor Embedding (t-SNE)[37] was used to visualize the high-dimensional feature space and assess clustering separation between risk groups.
Statistical analysis
Continuous variables were expressed as median (interquartile range [IQR]) and compared using the Mann-Whitney U test. Categorical variables were presented as counts (percentages) and compared using the chi-square test or Fisher's exact test, as appropriate.
The primary endpoint was all-cause mortality, which was ascertained by telephone follow-up. Follow-up time was calculated from the date of SPECT MPI to the date of death or last available follow-up. Prognostic performance was evaluated using the Concordance Index (C-index)[38] and time-dependent receiver operating characteristic (ROC)[39] curves for 1-year and 3-year survival. The 95% confidence intervals (CIs) were estimated by bootstrapping with 1,000 resamples. Paired bootstrap testing was used to compare the C-index and time-dependent AUC values between IF-SPECT and the comparator models. Survival curves were estimated using the Kaplan-Meier method and compared using the log-rank test. Multivariable associations were assessed using Cox proportional hazards regression, with results expressed as hazard ratios (HRs) and 95%CIs.
All statistical analyses were performed using Python (v3.12) and R software. A two-sided P value < 0.05 was considered statistically significant.
RESULTS
Baseline characteristics
The study cohort comprised 356 patients with confirmed IHF. Baseline demographic and clinical characteristics for the training (n = 213) and validation (n = 143) cohorts are summarized in Table 1. The study population was predominantly male (88.2%), with a median age of 59 years (IQR: 52-65). The training and validation cohorts included 34 and 23 deaths, respectively. The median follow-up was 1,553 days (IQR: 1,164-1,825) in the training cohort and 1,645 days (IQR: 1,141-1,825) in the validation cohort.
Clinical characteristics of patients in the training cohort and validation cohort
| Characteristics | Training cohort (n = 213) | Validation cohort (n = 143) | P value | |
| Age | 59.00 (52.00-65.00) | 59.00 (50.50-65.00) | 0.738 | |
| Sex | male | 192 (90.1%) | 122 (85.3%) | 0.182 |
| female | 21 (9.9%) | 21 (14.7%) | ||
| BMI | 25.18 (22.94-27.68) | 25.22 (23.33-27.10) | 0.878 | |
| Treatment | yes | 11 (5.2%) | 9 (6.3%) | 0.974 |
| no | 48 (22.5%) | 31 (21.7%) | ||
| unknown | 154 (72.3%) | 103 (72.0%) | ||
| HM_TPD Group | 1 | 28 (13.1%) | 20 (14.0%) | 0.974 |
| 2 | 30 (14.1%) | 20 (14.0%) | ||
| unknown | 155 (72.8%) | 103 (72.0%) | ||
| NYHA_3_4 | 0 | 112 (52.6%) | 75 (52.4%) | 0.712 |
| 1 | 100 (46.9%) | 68 (47.6%) | ||
| unknown | 1 (0.5%) | 0 (0.0%) | ||
| RE_EDV | 194.00 (148.00-259.50) | 200.00 (155.00-252.00) | 0.716 | |
| unknown | 2 | 2 | ||
| RE_ESV | 151.00 (107.00-212.50) | 160.00 (112.00-211.00) | 0.678 | |
| unknown | 2 | 2 | ||
| RE_EF | 22.00 (17.00-28.00) | 21.00 (16.00-27.00) | 0.443 | |
| unknown | 2 | 2 |
No statistically significant differences were observed between the training and validation sets with respect to age, sex, BMI, NYHA functional class, or history of comorbidities (all P > 0.05), indicating a balanced distribution of baseline covariates. Conventional quantitative functional parameters, including EDV and ESV, were also balanced between the two groups. This balanced distribution provided a reliable basis for model training and validation. Additional clinical characteristics are provided in Supplementary Table 1.
Prognostic performance and incremental value
The prognostic accuracy of the proposed IF-SPECT model was evaluated using the C-index and time-dependent ROC curves and was compared with five alternative models [Table 2 and Supplementary Table 2]. In the training cohort, IF-SPECT achieved a C-index of 0.803 (95%CI: 0.735-0.869), outperforming the radiomics-based model (Model-4; C-index: 0.641) and the standard clinical model (Model-2; C-index: 0.739). Paired bootstrap testing confirmed significant C-index improvements over the clinical model
Comparison of C-index values between the IF-SPECT model and comparator models in the training and validation cohorts
| Model | Training cohort (n = 213) | Validation cohort (n = 143) |
| Model-1 | 0.745 (0.662-0.828) | 0.693 (0.592-0.795) |
| Model-2 | 0.739 (0.657-0.809) | 0.647 (0.544-0.745) |
| Model-3 | 0.702 (0.618-0.781) | 0.637 (0.520-0.761) |
| Model-4 | 0.641 (0.546-0.738) | 0.575 (0.443-0.696) |
| Model-5 | 0.781 (0.706-0.852) | 0.675 (0.549-0.795) |
| IF-SPECT | 0.803 (0.735-0.869) | 0.724 (0.621-0.814) |
This performance advantage was sustained in the internal validation cohort. IF-SPECT achieved the highest C-index of 0.724 (95%CI: 0.621-0.814), demonstrating superior generalization compared with the clinical variables-only model (Model-2; 0.647) and standard quantitative perfusion parameters (Model-3; 0.637). In paired bootstrap testing, IF-SPECT significantly improved the validation C-index compared with the clinical model (P = 0.008) and radiomics model (P = 0.008), supporting its incremental prognostic value beyond standard clinical variables and handcrafted radiomic features. Time-dependent ROC analysis confirmed the model's short- and long-term predictive capability [Figure 3A-D]. In the validation cohort, IF-SPECT achieved an AUC of 0.828 (95%CI: 0.756-0.900) for 1-year mortality and 0.778 (95%CI: 0.667-0.889) for 3-year mortality, exceeding the performance of the standard clinical model (1-year AUC: 0.734; 3-year AUC: 0.672).
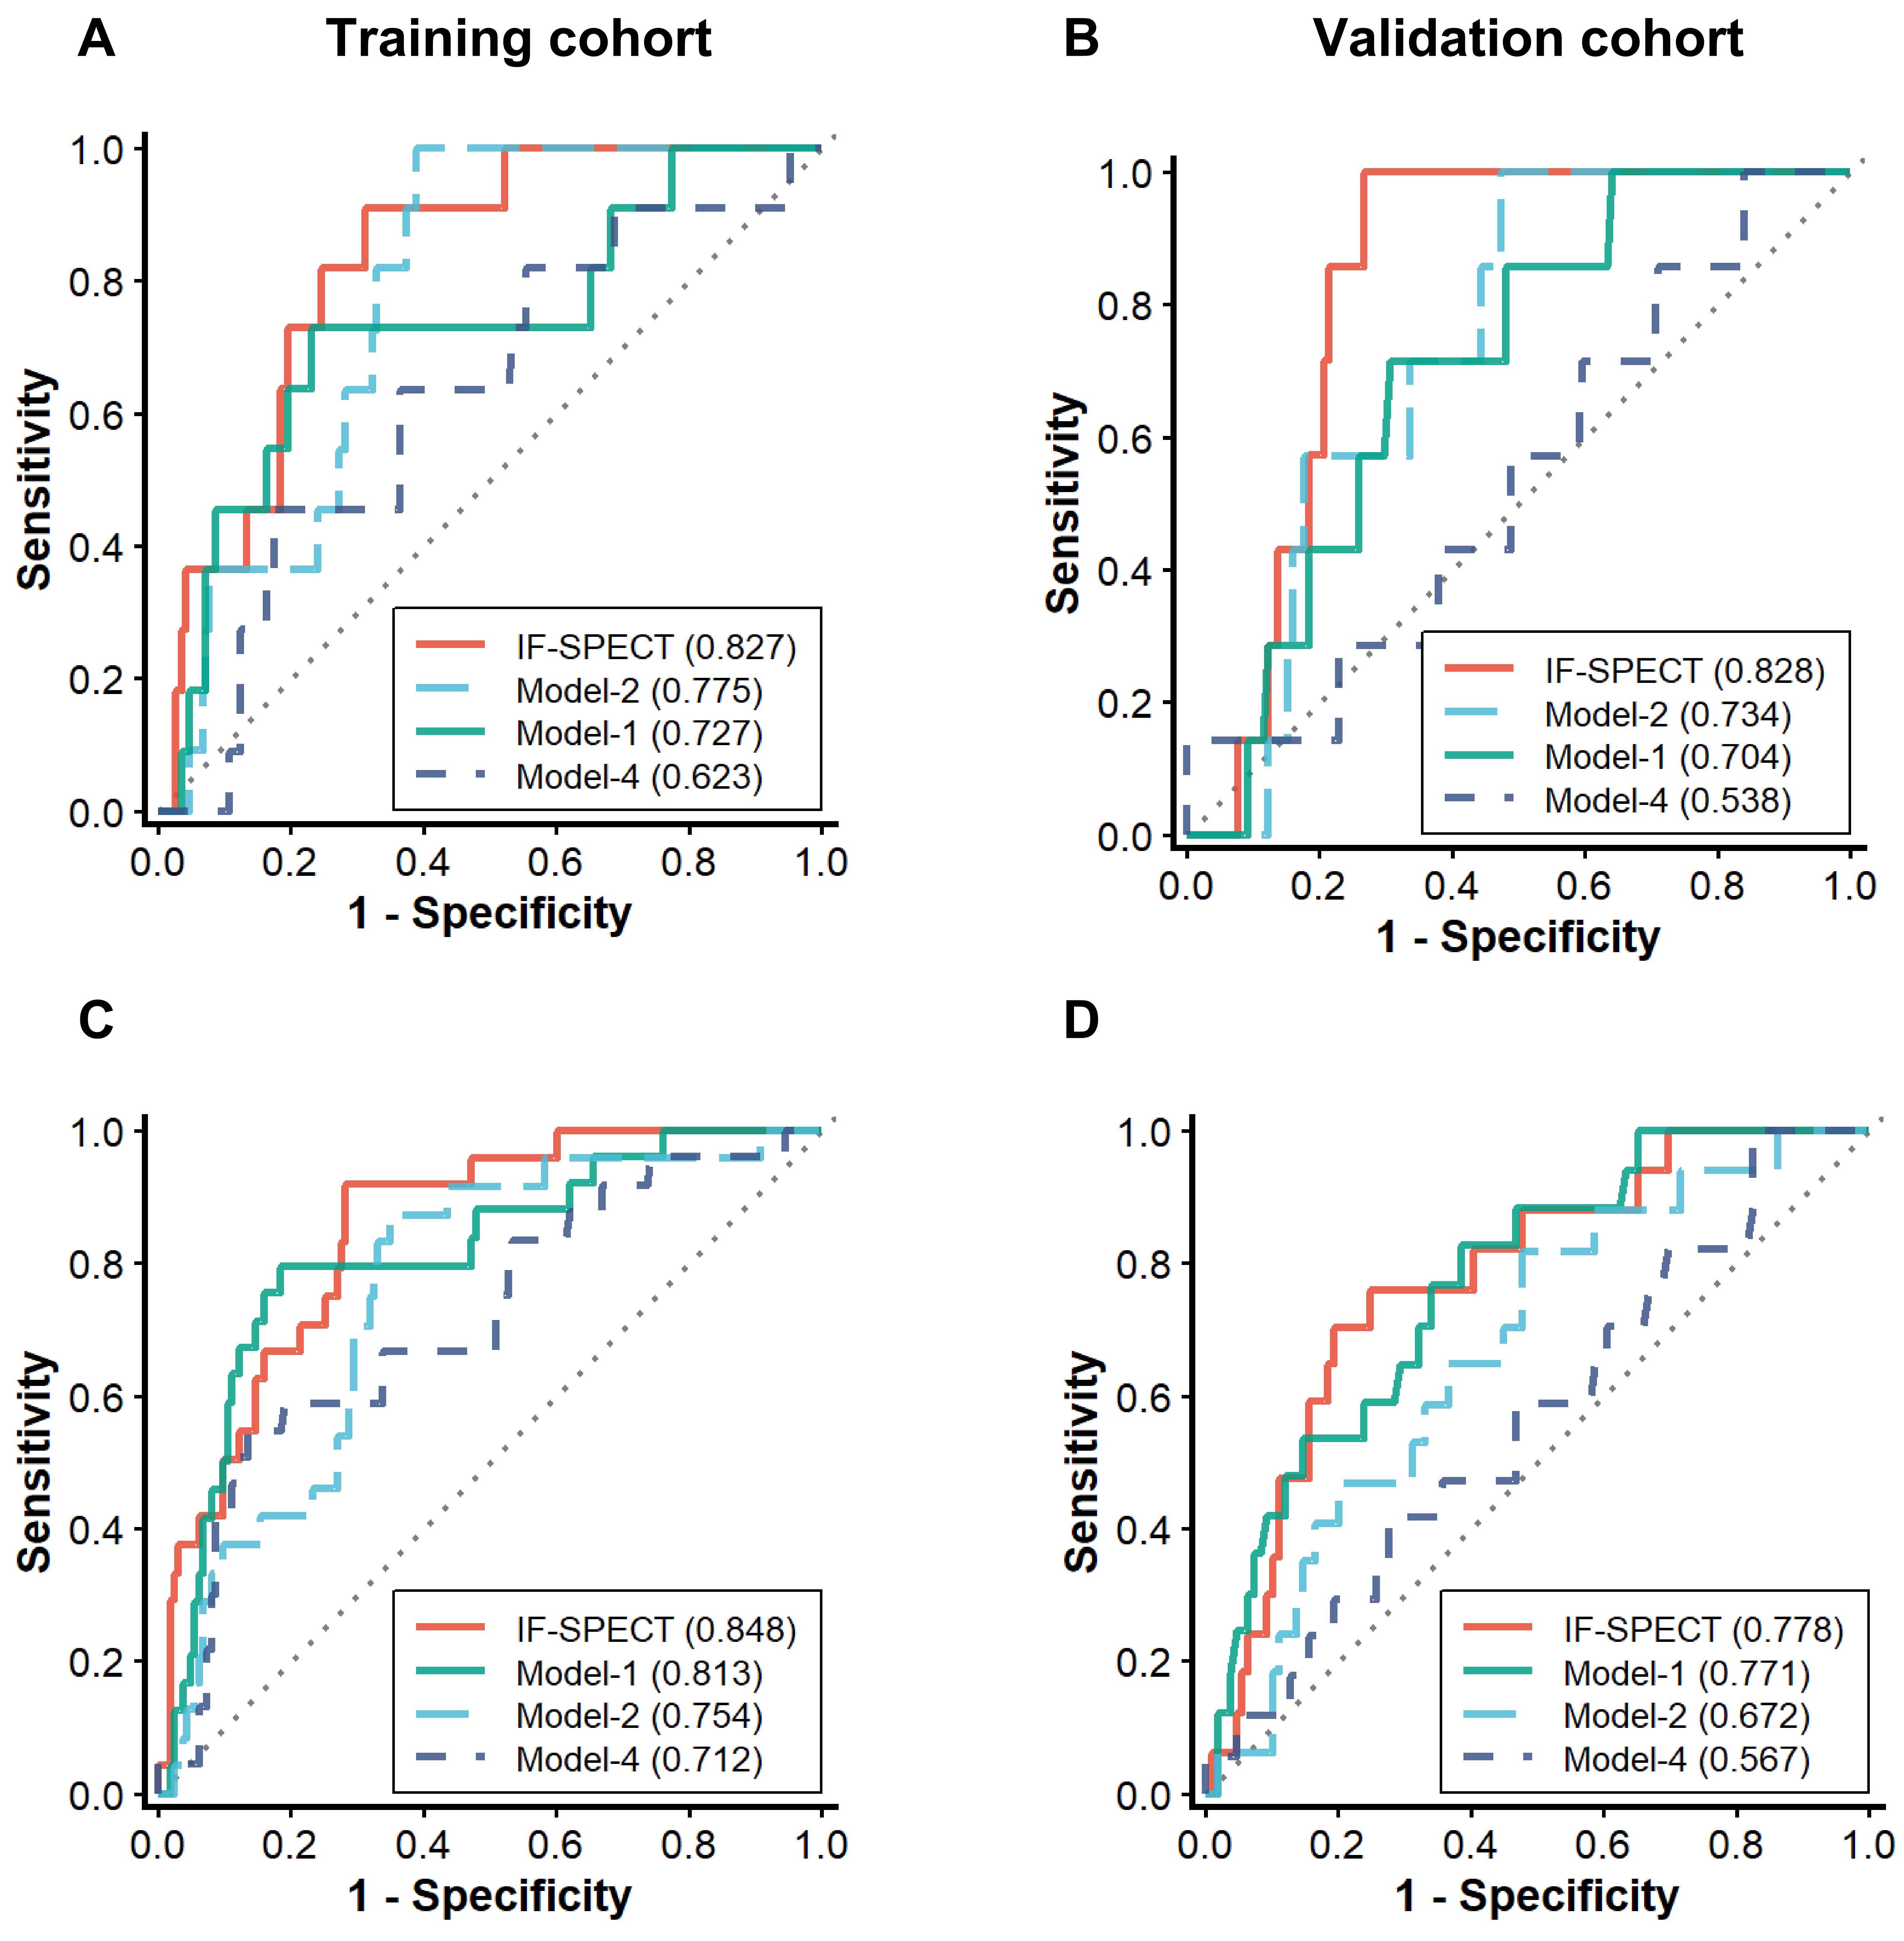
Figure 3. Receiver operating characteristic (ROC) curves for all-cause mortality prediction. (A and B) ROC curves for 1-year all-cause mortality prediction in the training and validation cohorts, respectively. (C and D) ROC curves for 3-year all-cause mortality prediction in the training and validation cohorts, respectively.
To determine whether IF-SPECT provides independent prognostic value beyond established clinical risk factors, we performed multivariate Cox proportional hazards regression analysis. After adjustment for potential confounders, including age, sex, BMI, NYHA functional class, and standard quantitative parameters (LVEF, EDV, and ESV), the IF-SPECT risk score remained a strong and independent predictor of all-cause mortality (hazard ratio [HR]: 4.13; 95%CI: 1.94-8.79; P < 0.001) [Supplementary Table 3 and Supplementary Figure 2]. This result indicates that deep learning-derived features provide significant incremental value over traditional clinical and volumetric indices.
Risk stratification and clinical restratification
Based on the risk scores generated by IF-SPECT, patients in the validation cohort were stratified into high-risk and low-risk groups. To ensure robust generalization, the cutoff was prespecified as the 66th percentile (upper tertile) of the training cohort risk scores and then applied unchanged to the validation cohort. Kaplan-Meier survival analysis revealed distinct and sustained divergence in survival trajectories between the two groups [Figure 4A and B]. Patients classified as high-risk by IF-SPECT had a significantly higher rate of all-cause mortality than those in the low-risk group in the validation cohort (HR: 5.01; 95%CI: 2.17-11.59;
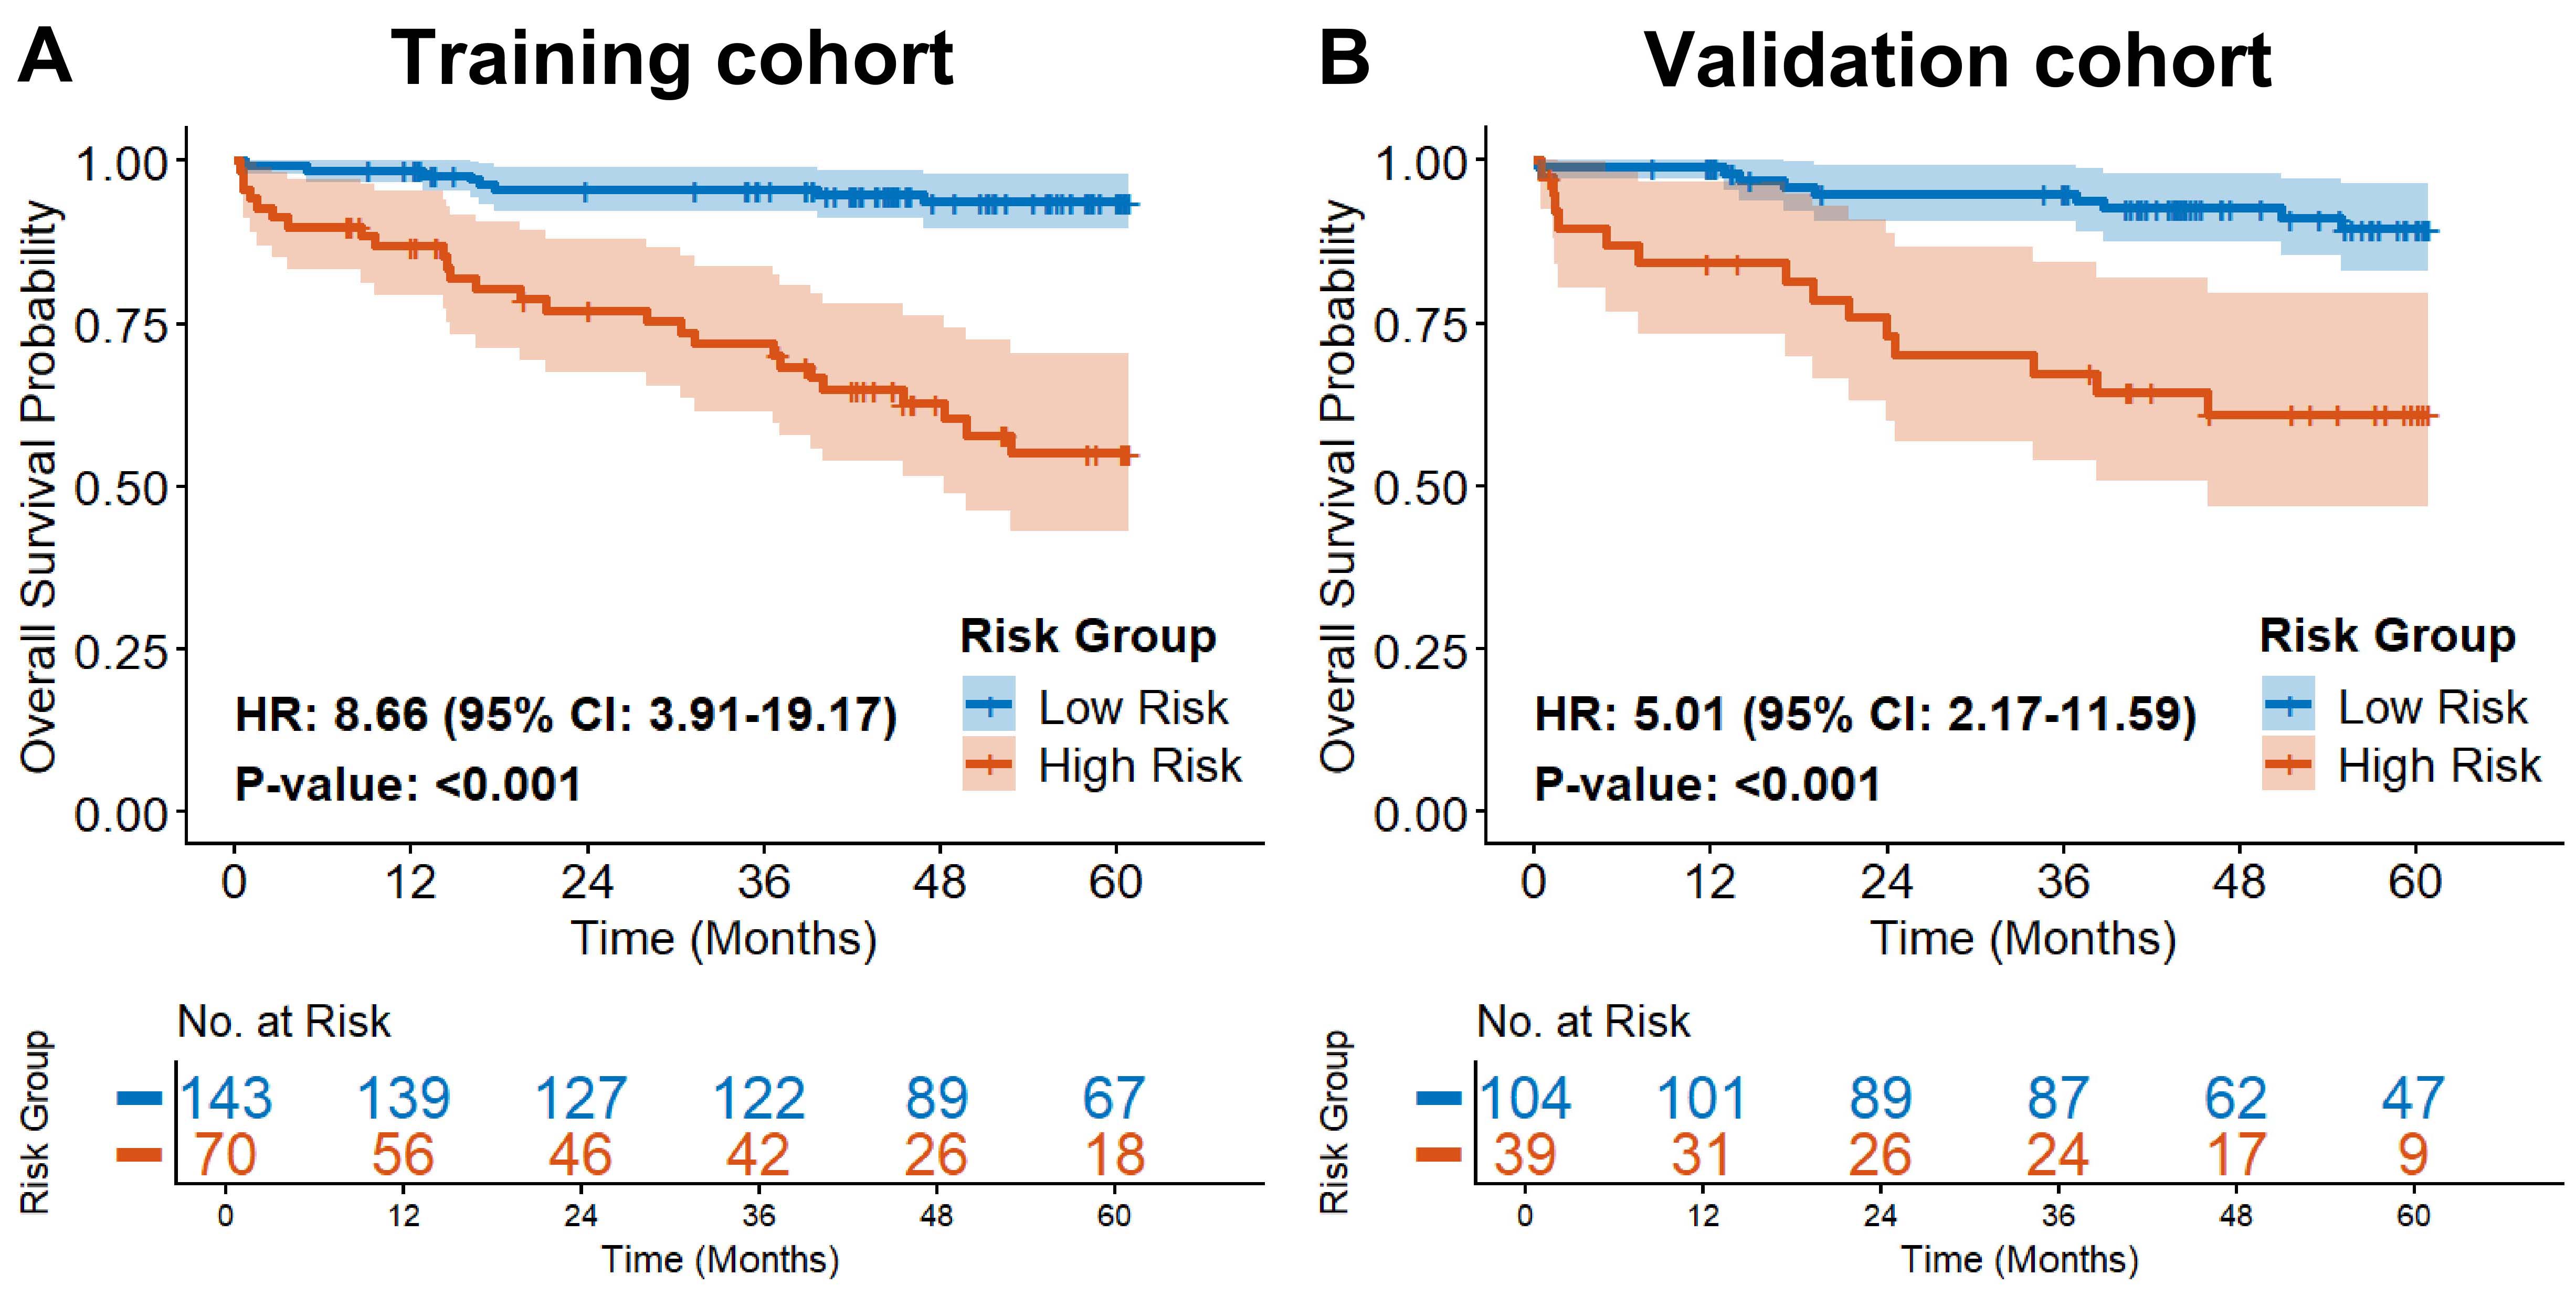
Figure 4. Kaplan-Meier survival analysis. (A and B) Kaplan-Meier survival curves for the training and validation cohorts, respectively. Patients were stratified into high-risk and low-risk groups using the 66th percentile of IF-SPECT risk scores derived from the training cohort. The same cutoff was applied to the validation cohort. Hazard ratios (HRs) with 95% confidence intervals are shown in each panel.
To further demonstrate the model's clinical utility, we performed exploratory stratified analyses according to available treatment-strategy information and anatomical severity. As shown in Figure 5A and B, among patients with available treatment information, treatment strategy was categorized as maintenance/non-revascularization management (treatment strategy = 0) or revascularization strategy (treatment strategy = 1; PCI or CABG). In the maintenance/non-revascularization subgroup, IF-SPECT identified a high-risk subset with significantly elevated mortality risk (HR: 7.55; 95%CI: 2.53-22.51; P < 0.001). In the revascularization-strategy subgroup, no deaths occurred during follow-up; therefore, the hazard ratio was not estimable. These treatment-strategy subgroup findings should be interpreted as exploratory.
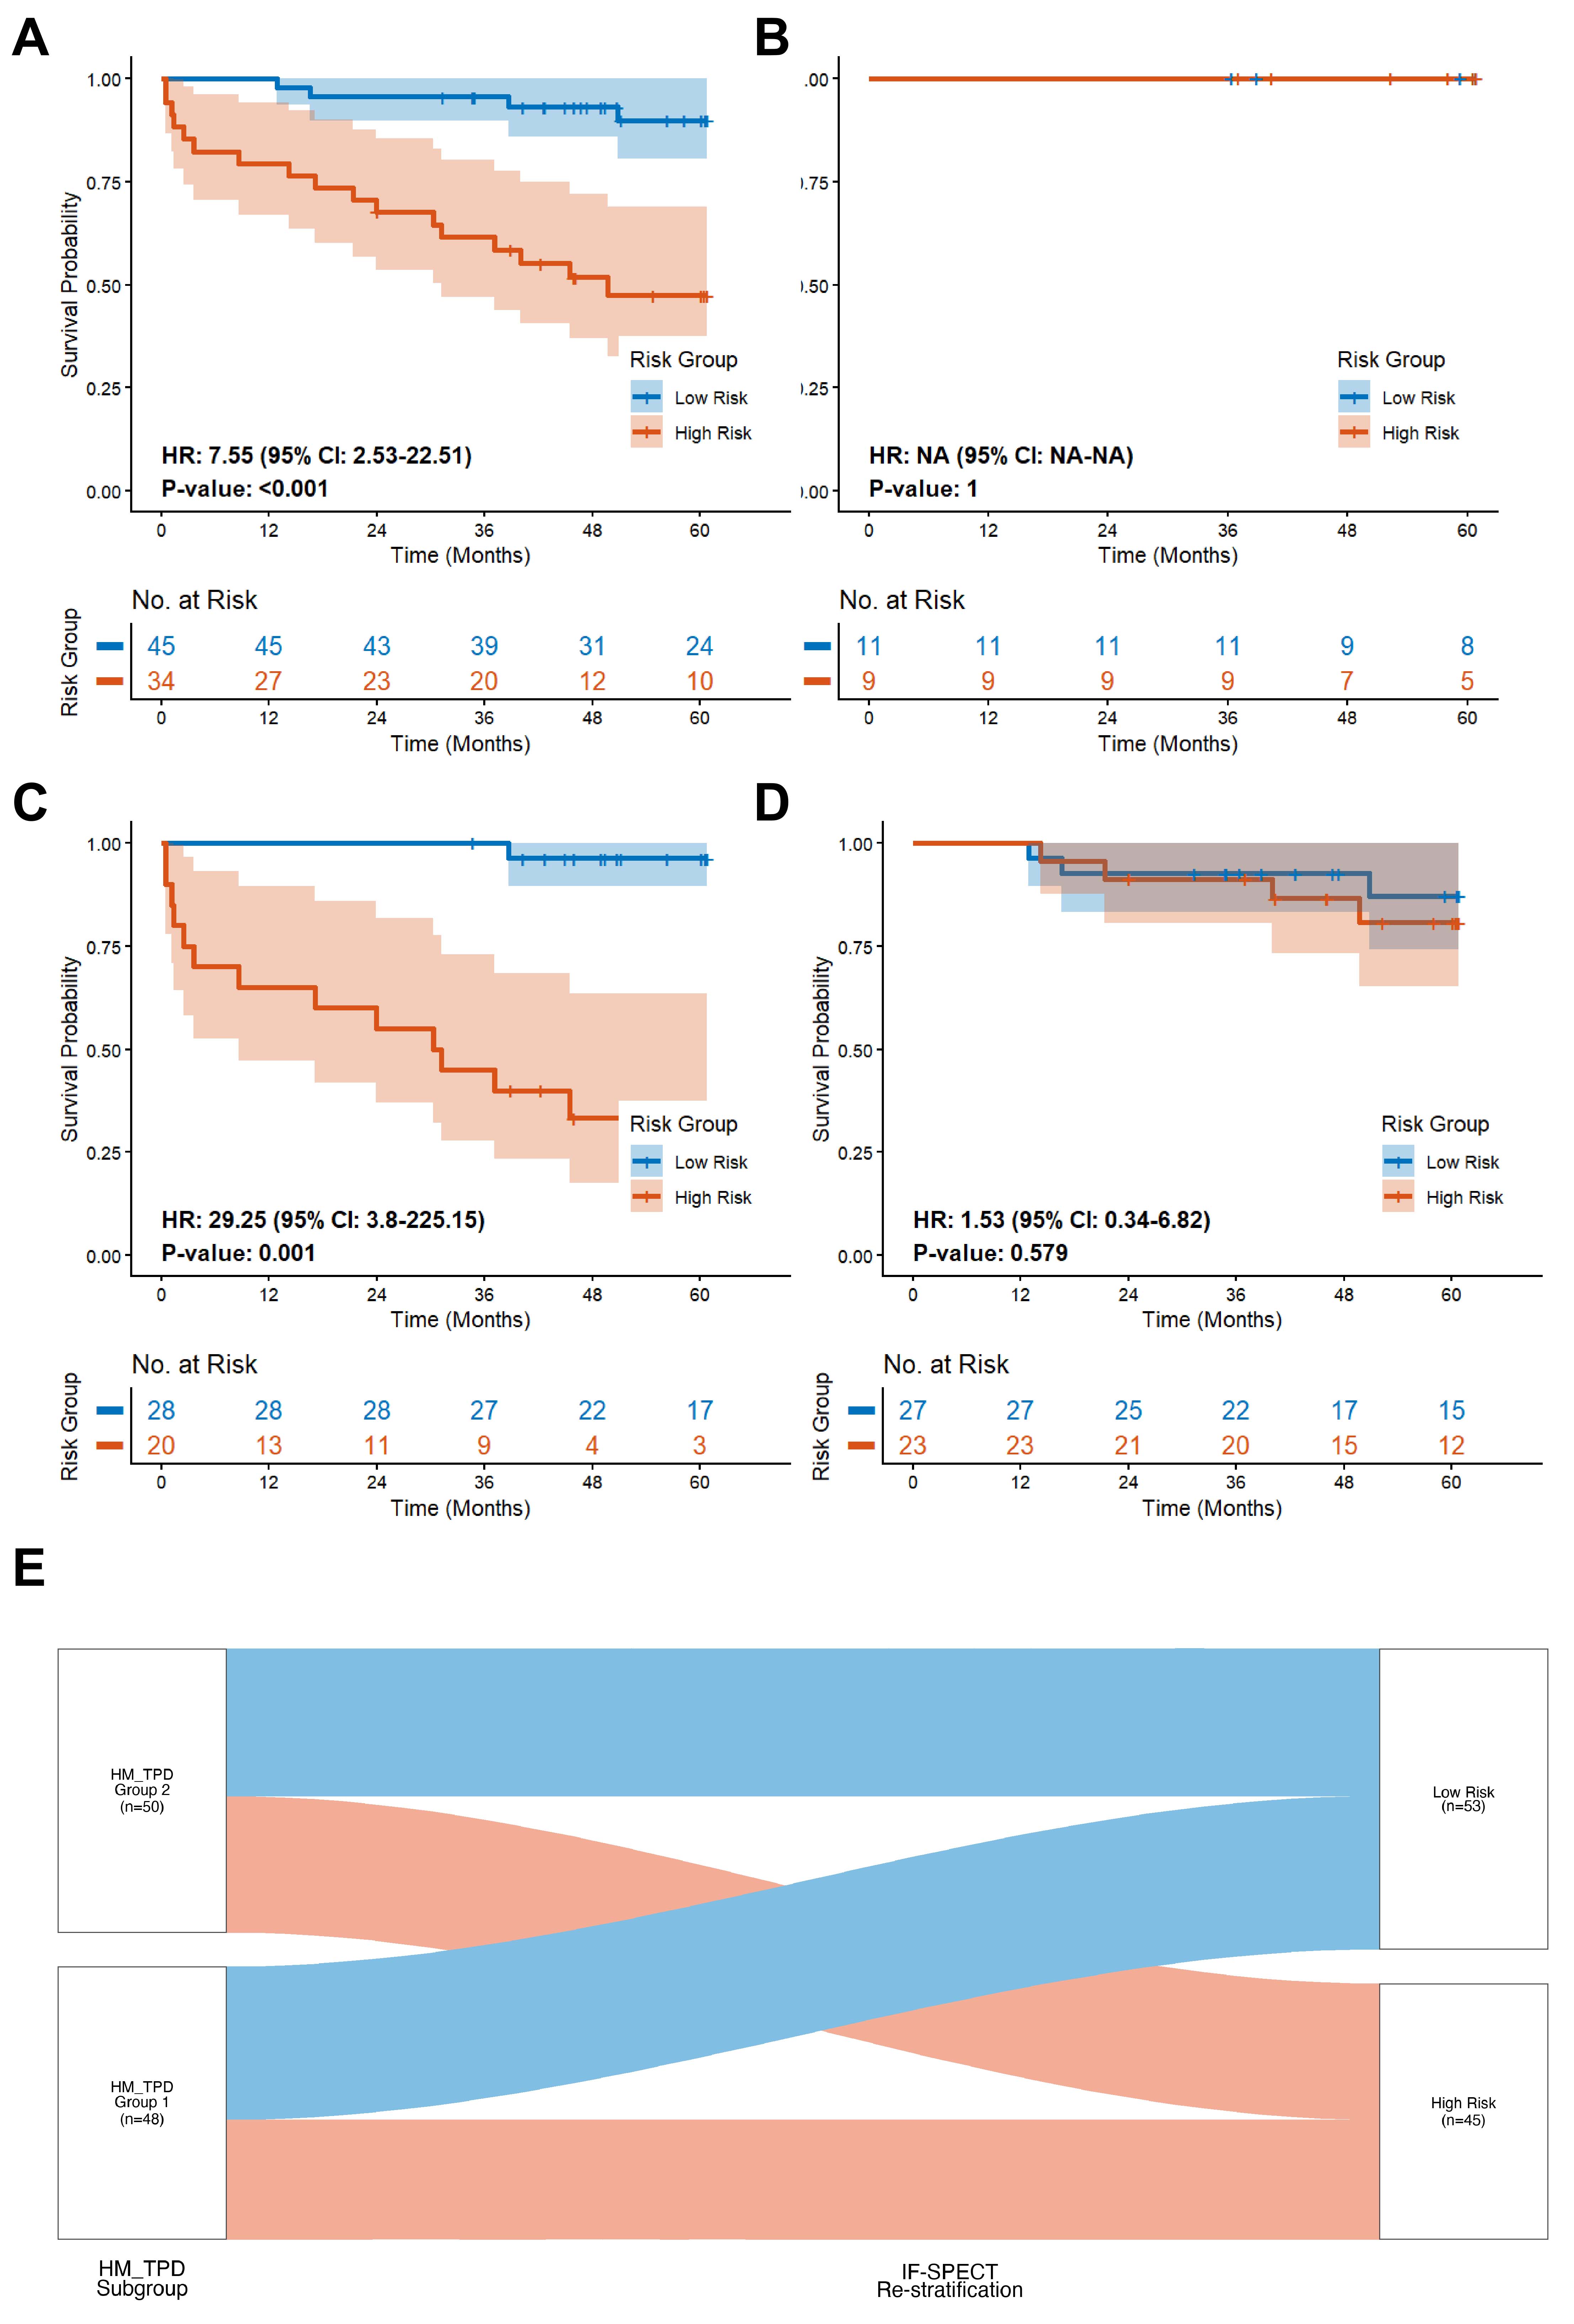
Figure 5. Subgroup survival analysis and clinical risk restratification by the IF-SPECT model. (A and B) Kaplan-Meier survival analysis stratified by available treatment-strategy information. Treatment strategy = 0 indicates maintenance/non-revascularization management, whereas treatment strategy = 1 indicates revascularization strategy (PCI or CABG). In (B), no events occurred in the revascularization-strategy subgroup; therefore, the hazard ratio was not estimable. (C and D) Kaplan-Meier survival analysis stratified by HM_TPD index-defined subgroups. HM_TPD group 1 represents a low HM_TPD index (< 0.3), and HM_TPD group 2 represents a high HM_TPD index
We then evaluated whether IF-SPECT could refine risk assessment within subgroups defined by the HM_TPD index, which reflects the relationship between hibernating myocardium and total perfusion defect burden. Because HM_TPD was available only in a subset of patients, this analysis included all patients with available HM_TPD measurements regardless of assignment to the training or validation cohort. The low HM_TPD subgroup (HM_TPD group 1; HM_TPD < 0.3; n = 48) was further reclassified by IF-SPECT into distinct prognostic categories [Figure 5C and D]. Within this subgroup, patients identified as high-risk by IF-SPECT had a markedly increased risk of mortality (HR: 29.25; 95%CI: 3.80-225.15; P = 0.001). The Sankey diagram [Figure 5E] illustrates this exploratory restratification pattern without implying direct treatment recommendations.
Model interpretability
To verify that the model's predictions were driven by biologically plausible features, we used Gradient-weighted Class Activation Mapping (Grad-CAM)[36]. The resulting saliency maps (Figure 6, left) confirmed that the Structure-Aware Module effectively focused the network's attention on the left ventricular myocardium. In high-risk patients, hotspots of high attention consistently corresponded to areas of severe perfusion defects, scarring, or extensive ischemia. In contrast, low-risk patients showed diffuse or minimal activation patterns.
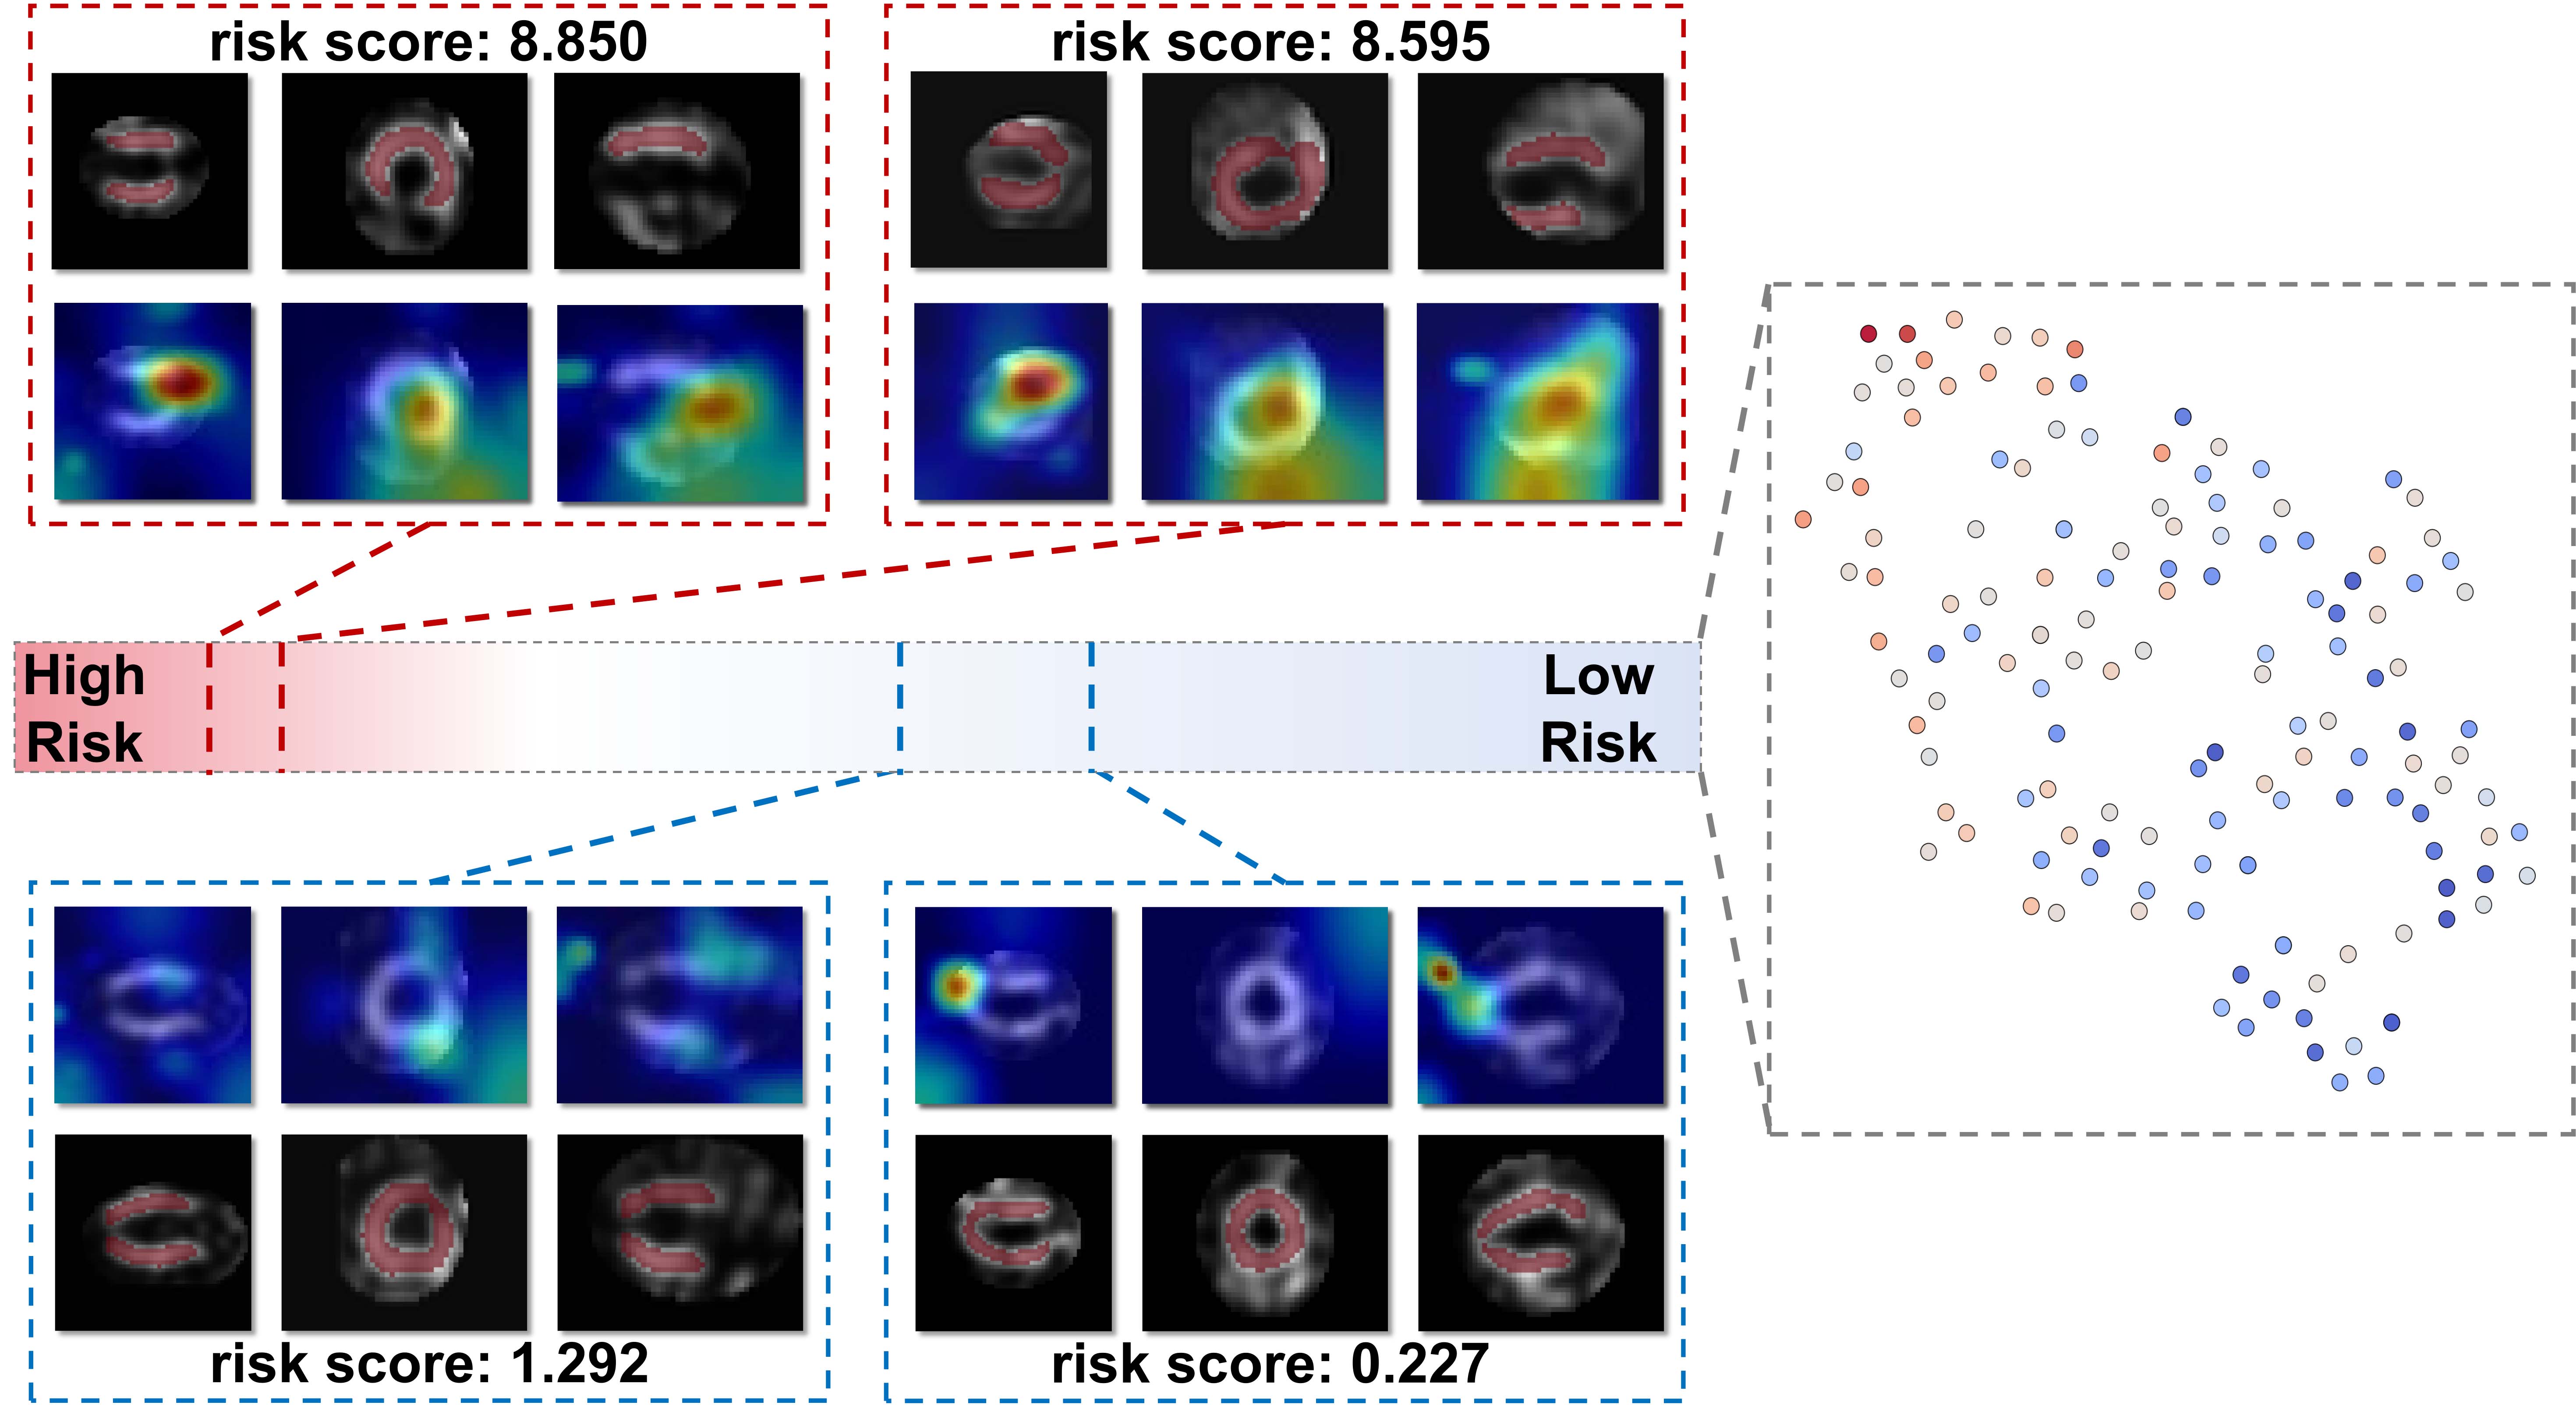
Figure 6. Visualization of risk stratification results and feature distribution. (Left) Representative cases from the high-risk (red dashed boxes) and low-risk (blue dashed boxes) groups. The top row of each panel shows the input images, whereas the bottom row displays the corresponding saliency maps or attention heatmaps, highlighting regions that contributed to the risk score. (Right) t-SNE visualization of feature embeddings in the test set, showing separation between risk levels.
Importantly, although these spatial focal points aligned with clinically recognized infarct and peri-infarct zones, the model's superior prognostic performance suggests that it extracts high-dimensional, nonlinear features from these regions, capturing subtle pathological heterogeneity beyond standard visual assessment.
Furthermore, t-distributed stochastic neighbor embedding (t-SNE)[37] visualization of the feature space (Figure 6, right) showed clear clustering separation between high-risk and low-risk patients. This suggests that IF-SPECT learns a discriminative feature representation that effectively encodes the phenotypic heterogeneity of ischemic heart failure.
DISCUSSION
The present study describes the development and validation of IF-SPECT, a novel multitask deep learning framework designed to predict all-cause mortality in patients with IHF. To the best of our knowledge, this is one of the first studies to combine raw 3D voxel-level SPECT MPI features with structured clinical variables for survival prediction. In the IF-SPECT workflow, a deep learning-derived imaging risk score is generated from the 3D SPECT data and then integrated with clinical variables in a final Cox prognostic model. The principal finding of this investigation is that IF-SPECT showed the highest prognostic performance among the evaluated models and effectively restratified patients deemed to be at intermediate risk by conventional anatomical criteria.
Comparison with 2D approaches
Unlike previous deep learning studies in nuclear cardiology that primarily relied on 2D polar maps (bull's-eye plots) or segmental scoring systems[12-14], IF-SPECT operates directly on raw 3D voxel-level data. Although polar maps provide a concise summary of perfusion, the projection process inevitably results in information loss, particularly with respect to 3D spatial geometry and local wall-thickness variations. Recent studies have begun to recognize this limitation and have advocated polar map-free 3D algorithms to capture the full volumetric context[19]. By preserving the native 3D architecture, our model can capture complex volumetric patterns of myocardial damage that may be obscured in 2D representations, which likely contributes to its superior predictive performance.
Mechanistic interpretation of model performance
The superior prognostic performance of IF-SPECT, compared with single-modality or standard quantitative models, can be attributed to two key design features: auxiliary task learning and the incorporation of complementary clinical information in the final prognostic model.
First, the incorporation of left ventricular segmentation as an auxiliary task serves as a critical regularizer during model training. In standard black-box survival networks, there is a risk that the model may learn spurious correlations from background noise or extra-cardiac uptake (e.g., liver or bowel activity). By explicitly constraining the network to segment the left ventricle, we enforce an anatomical focus, directing the model's attention toward the myocardium. This mimics the cognitive workflow of a human expert, who implicitly defines cardiac boundaries before assessing perfusion defects. The Grad-CAM visualizations [Figure 6] support this mechanism, showing that the model's attention in high-risk patients is concentrated on myocardial regions with perfusion abnormalities rather than imaging artifacts.
Second, combining the deep learning-derived risk score with clinical variables in the final prognostic model addresses the systemic nature of heart failure. Prognosis in IHF is driven not only by the extent of myocardial damage but also by the patient's physiological reserve and systemic comorbidities. Our results demonstrate that while the image-only deep learning model achieved respectable performance (C-index: 0.693), incorporation of clinical variables (age, BMI, sex, and NYHA_3_4) yielded a further performance gain (C-index: 0.724). This confirms that imaging and clinical data provide complementary prognostic information: the SPECT images characterize the specific myocardial substrate, while clinical variables capture the broader physiological context.
Clinical implications
The most clinically relevant implication of our findings is the ability of the model to refine risk assessment for patients in the intermediate-risk category. In clinical practice, decision-making is relatively straightforward for patients with normal scans (low risk) or extensive infarction (high risk). However, a substantial proportion of patients with IHF present with intermediate perfusion deficits (e.g., TPD of 10%-20%), creating ambiguity regarding the need for aggressive interventions such as implantable cardioverter-defibrillators (ICDs) or cardiac resynchronization therapy (CRT).
Our subgroup analysis suggested that, within the low HM_TPD subgroup representing a scar-dominant or low-hibernating-myocardium phenotype, IF-SPECT identified a high-risk subset with markedly increased mortality risk (HR: 29.25). This suggests that the deep learning model may detect subtle, higher-order phenotypic features that are smoothed out or overlooked by global volumetric metrics. Because treatment-strategy information was incomplete and retrospectively collected, these findings should be viewed as exploratory risk-stratification patterns rather than direct treatment recommendations.
Limitations
Several limitations of this study merit consideration. First, as a single-center retrospective analysis, the sample size (n = 356) was relatively modest, and potential selection bias cannot be entirely excluded. Although internal validation using stratified random sampling yielded robust results, the generalizability of IF-SPECT requires further validation in large, multicenter external cohorts to ensure applicability across different scanner types, imaging protocols, and patient populations. This need is consistent with recent expert recommendations noting that acquisition protocols, scanner platforms, patient populations, and representative training datasets remain major barriers to AI translation in nuclear cardiology[40]. Second, treatment-strategy, valve-disease, and several exploratory clinical variables had substantial missingness and were not used as final model inputs; therefore, subgroup analyses involving these variables should be interpreted cautiously. Third, the current model predicts all-cause mortality and does not directly identify reversible abnormalities or specify interventions such as revascularization, valve intervention, CRT/ICD implantation, or heart transplantation. Future prospective studies integrating longitudinal treatment response, cardiac-specific outcomes, and external validation cohorts are warranted to evaluate whether IF-SPECT can inform individualized management beyond risk stratification.
In addition, although the model successfully integrates basic clinical variables, potential unmeasured confounders, such as specific biomarkers (e.g., NT-proBNP) and detailed medication profiles (e.g., adherence to guideline-directed medical therapy), were not included in the current model. Integrating these granular biological and therapeutic data could further enhance predictive precision.
Finally, the primary endpoint was all-cause mortality. Although this is a robust and objective outcome, future studies are warranted to investigate the model's predictive value for cardiac-specific mortality and MACE.
Conclusion
In conclusion, the IF-SPECT model represents a promising tool for the prognostic assessment of ischemic heart failure. By combining a multitask deep learning-derived imaging risk score from 3D SPECT images with clinical variables in a final Cox model, it provides accurate, personalized risk stratification that surpasses conventional methods. The model's ability to reclassify intermediate-risk patients highlights its potential clinical value. Future research should focus on prospective, multi-center evaluation to establish its clinical utility in patient management.
DECLARATIONS
Authors’ contributions
Made substantial contributions to the conception and design of the study and performed data analysis and interpretation: Xu W, An Y, Tang Z, Tian J, Yun M, Liu Z, Zhang X
Performed data acquisition: Meng J, Xu X, Zhao Y, Xiong M, Yun M
Designed the model and performed the analysis: Xu W, Yun M, Liu Z
Drafted and reviewed the manuscript: Xu W, Zhang S, Yun M, Liu Z, Zhang X
Availability of data and materials
Code is available online at https://github.com/WhenZzz/IF-SPECT. All original data supporting the findings of this study are available from the corresponding author upon reasonable request.
AI and AI-assisted tools statement
During the preparation of this manuscript, the AI tool ChatGPT with GPT-5.5 Instant (version 5.5, released 2026-05-05) was used solely for language editing. The tool did not influence the study design, data collection, analysis, interpretation, or the scientific content of the work. All authors take full responsibility for the accuracy, integrity, and final content of the manuscript.
Financial support and sponsorship
This research was funded by the Beijing Municipal Natural Science Foundation (No. L256013), the National Key R&D Program of China (No. 2021YFA1301603), and the Young Elite Scientists Sponsorship Program by the China Association for Science and Technology (2023QNRC001).
Conflicts of interest
All authors declared that there are no conflicts of interest.
Ethical approval and consent to participate
This study used only de-identified secondary data and was granted exemption from ethics review by the Ethics Committee of Beijing Anzhen Hospital (No. 2026056x). The exemption documentation states that the study involved no direct contact with human participants and no risk of harm to participant rights or interests. Accordingly, no direct informed-consent process was conducted in this retrospective study.
Consent for publication
Not applicable.
Copyright
© The Author(s) 2026.
Supplementary Materials
REFERENCES
1. Ran J, Zhou P, Wang J, et al. Global, regional, and national burden of heart failure and its underlying causes, 1990-2021: results from the global burden of disease study 2021. Biomark Res. 2025;13:16.
2. Tsao CW, Aday AW, Almarzooq ZI, et al. Heart disease and stroke statistics—2023 update: a report from the american heart association. Circulation. 2023;147:8.
3. Mcmurray JJ, Solomon SD, Inzucchi SE, et al. Dapagliflozin in patients with heart failure and reduced ejection fraction. N Engl J Med. 2019;381:1995-2008.
4. Heidenreich PA, Bozkurt B, Aguilar D, et al. 2022 ACC/AHA/HFSA guideline for the management of heart failure. J Card Fail. 2022;28:e1-e167.
5. Mcdonagh TA, Metra M, Adamo M, et al. 2021 ESC guidelines for the diagnosis and treatment of acute and chronic heart failure: developed by the Task Force for the diagnosis and treatment of acute and chronic heart failure of the European Society of Cardiology (ESC). With the special contribution of the Heart Failure Association (HFA) of the ESC. Eur J Heart Fail. 2022;24:4-131.
6. Goldberger JJ, Boineau A, Boineau R, et al. Risk stratification for sudden cardiac death: a plan for the future. Circulation. 2014;219:4.
7. Pocock SJ, Ariti CA, Mcmurray JJ, et al. Predicting survival in heart failure: a risk score based on 39 372 patients from 30 studies. Eur Heart J. 2013;34:1404-13.
8. Hachamovitch R, Berman DS, Shaw LJ, et al. Incremental prognostic value of myocardial perfusion single photon emission computed tomography for the prediction of cardiac death: differential stratification for risk of cardiac death and myocardial infarction. Circulation. 1998;97:535-43.
9. Amini M, Pursamimi M, Hajianfar G, et al. Machine learning-based diagnosis and risk classification of coronary artery disease using myocardial perfusion imaging SPECT: a radiomics study. Sci Rep. 2023;13:14920.
10. Leslie WD, Bryanton M, Goertzen A, Slomka P. Prediction of 2-year major adverse cardiac events from myocardial perfusion scintigraphy and clinical risk factors. J Nucl Cardiol. 2022;29:1956-63.
11. Miller RJ, Slomka PJ. Artificial intelligence in nuclear cardiology: an update and future trends. Semin Nucl Med. 2024;54:648-57.
12. Betancur J, Commandeur F, Motlagh M, et al. Deep learning for prediction of obstructive disease from fast myocardial perfusion SPECT. JACC Cardiovascular Imaging. 2018;11:1654-63.
13. Kusumoto D, Akiyama T, Hashimoto M, et al. A deep learning-based automated diagnosis system for SPECT myocardial perfusion imaging. Sci Rep. 2024;14:13583.
14. Miller RJ, Kavanagh P, Lemley M, et al. Artificial intelligence-enhanced perfusion scoring improves the diagnostic accuracy of myocardial perfusion imaging. J Nucl Med. 2025;66:648-53.
15. Hajianfar G, Gharibi O, Sabouri M, et al. Artificial intelligence-powered coronary artery disease diagnosis from SPECT myocardial perfusion imaging: a comprehensive deep learning study. Eur J Nucl Med Mol Imaging. 2025;52:3019-35.
16. Papandrianos NI, Apostolopoulos ID, Feleki A, Apostolopoulos DJ, Papageorgiou EI. Deep learning exploration for SPECT MPI polar map images classification in coronary artery disease. Ann Nucl Med. 2022;36:823-33.
17. Zahiri N, Asgari R, Razavi-Ratki S, Parach A. Deep learning analysis of polar maps from SPECT myocardial perfusion imaging for prediction of coronary artery disease. Res Sq. 2021.
18. Qiao X, Wang H, Meng H, et al. Multi-modality deep learning-based [68Ga]Ga-DOTA-FAPI-04 PET polar map generation: potential value in detecting reactive fibrosis after myocardial infarction. Eur J Nucl Med Mol Imaging. 2024;51:3944-59.
19. Ko C, Lin S, Huang C, et al. Polar map-free 3D deep learning algorithm to predict obstructive coronary artery disease with myocardial perfusion CZT-SPECT. Eur J Nucl Med Mol Imaging. 2022;50:376-86.
20. Du Y, Wang B, Lin C, et al. Deep learning-based obstructive coronary artery disease prediction from myocardial perfusion SPECT. Eur J Nucl Med Mol Imaging. 2025;53:2686-96.
21. Gao Z, Liu X, Kang Y, et al. Improving the prognostic evaluation precision of hospital outcomes for heart failure using admission notes and clinical tabular data: multimodal deep learning model. J Med Internet Res. 2024;26:e54363.
22. Wang J, Wang Y, Duan S, et al. Multimodal data-driven prognostic model for predicting long-term prognosis in patients with ischemic cardiomyopathy and heart failure with preserved ejection fraction after coronary artery bypass grafting: a multicenter cohort study. J Am Heart Assoc. 2024;13:e036970.
23. Huang S, Pareek A, Seyyedi S, Banerjee I, Lungren MP. Fusion of medical imaging and electronic health records using deep learning: a systematic review and implementation guidelines. NPJ Digit Med. 2020;3:136.
24. Dhar T, Dey N, Borra S, Sherratt RS. Challenges of deep learning in medical image analysis—improving explainability and trust. IEEE Trans Technol Soc. 2023;4:68-75.
25. Murti DMP, Pujianto U, Wibawa AP, Akbar MI. K-nearest neighbor (K-NN) based missing data imputation. In 2019 5th International Conference on Science in Information Technology (ICSITech); 2019 Oct 23-24; Yogyakarta, Indonesia; pp. 83-8.
26. Ronneberger O, Fischer P, Brox T. U-net: convolutional networks for biomedical image segmentation. In: Navab N, Hornegger J, Wells WM, Frangi AF, editors. Medical image computing and computer-assisted intervention - MICCAI 2015. Cham: Springer International Publishing; 2015, pp. 234-41.
27. Isensee F, Jaeger PF, Kohl SAA, Petersen J, Maier-Hein KH. nnU-Net: a self-configuring method for deep learning-based biomedical image segmentation. Nat Methods. 2020;18:203-11.
28. Hu C, Xia Y, Zheng Z, et al. AI-based large-scale screening of gastric cancer from noncontrast CT imaging. Nat Med. 2025;31:3011-9.
29. Hu Y, Xiang Y, Zhou Y, et al. AI-based diagnosis of acute aortic syndrome from noncontrast CT. Nat Med. 2025;31:3832-44.
30. Hu J, Shen L, Sun G. Squeeze-and-excitation networks. In 2018 IEEE/CVF Conference on Computer Vision and Pattern Recognition; 18-23 June 2018; Salt Lake City, UT, USA.
31. Woo S, Park J, Lee J, Kweon IS. CBAM: convolutional block attention module. In: Ferrari V, Hebert M, Sminchisescu C, Weiss Y, editors. Computer vision - ECCV 2018. Cham: Springer International Publishing; 2018. pp. 3-19.
32. Katzman JL, Shaham U, Cloninger A, Bates J, Jiang T, Kluger Y. DeepSurv: personalized treatment recommender system using a Cox proportional hazards deep neural network. BMC Med Res Methodol. 2018;18:24.
33. Cox DR. Regression models and life-tables. J R Stat Soc Series B Stat Methodol. 1972;34:187-202.
34. Lambin P, Rios-Velazquez E, Leijenaar R, et al. Radiomics: extracting more information from medical images using advanced feature analysis. Eur J Cancer. 2012;48:441-6.
35. Tibshirani R. Regression shrinkage and selection via the lasso. J R Stat Soc Series B Stat Methodol. 1996;58:267-88.
36. Selvaraju RR, Cogswell M, Das A, Vedantam R, Parikh D, Batra D. Grad-CAM: visual explanations from deep networks via gradient-based localization. In Proceedings of the 2017 IEEE International Conference on Computer Vision (ICCV). Venice, Italy; 22-29 October 2017; pp. 618-26.
37. Van der Maaten L, Hinton G. Visualizing data using t-SNE. J Mach Learn Res. 2008;9:2579-605. Available from: https://www.jmlr.org/papers/v9/vandermaaten08a.html [Last accessed on 20 Jul 2026].
38. Harrell FE, Califf RM, Pryor DB, Lee KL, Rosati RA. Evaluating the yield of medical tests. JAMA. 1982;247:2543-6.
39. Heagerty PJ, Lumley T, Pepe MS. Time-dependent ROC curves for censored survival data and a diagnostic marker. Biometrics. 2004;56:337-44.
Cite This Article
 Open Access
How to Cite
Download Citation
Export Citation File:
Type of Import
Tips on Downloading Citation
Citation Manager File Format
Type of Import
Direct Import: When the Direct Import option is selected (the default state), a dialogue box will give you the option to Save or Open the downloaded citation data. Choosing Open will either launch your citation manager or give you a choice of applications with which to use the metadata. The Save option saves the file locally for later use.
Indirect Import: When the Indirect Import option is selected, the metadata is displayed and may be copied and pasted as needed.
About This Article
Special Topic
Copyright

Data & Comments
Data
0










Comments
Comments must be written in English. Spam, offensive content, impersonation, and private information will not be permitted. If any comment is reported and identified as inappropriate content by OAE staff, the comment will be removed without notice. If you have any queries or need any help, please contact us at [email protected].