

fig4
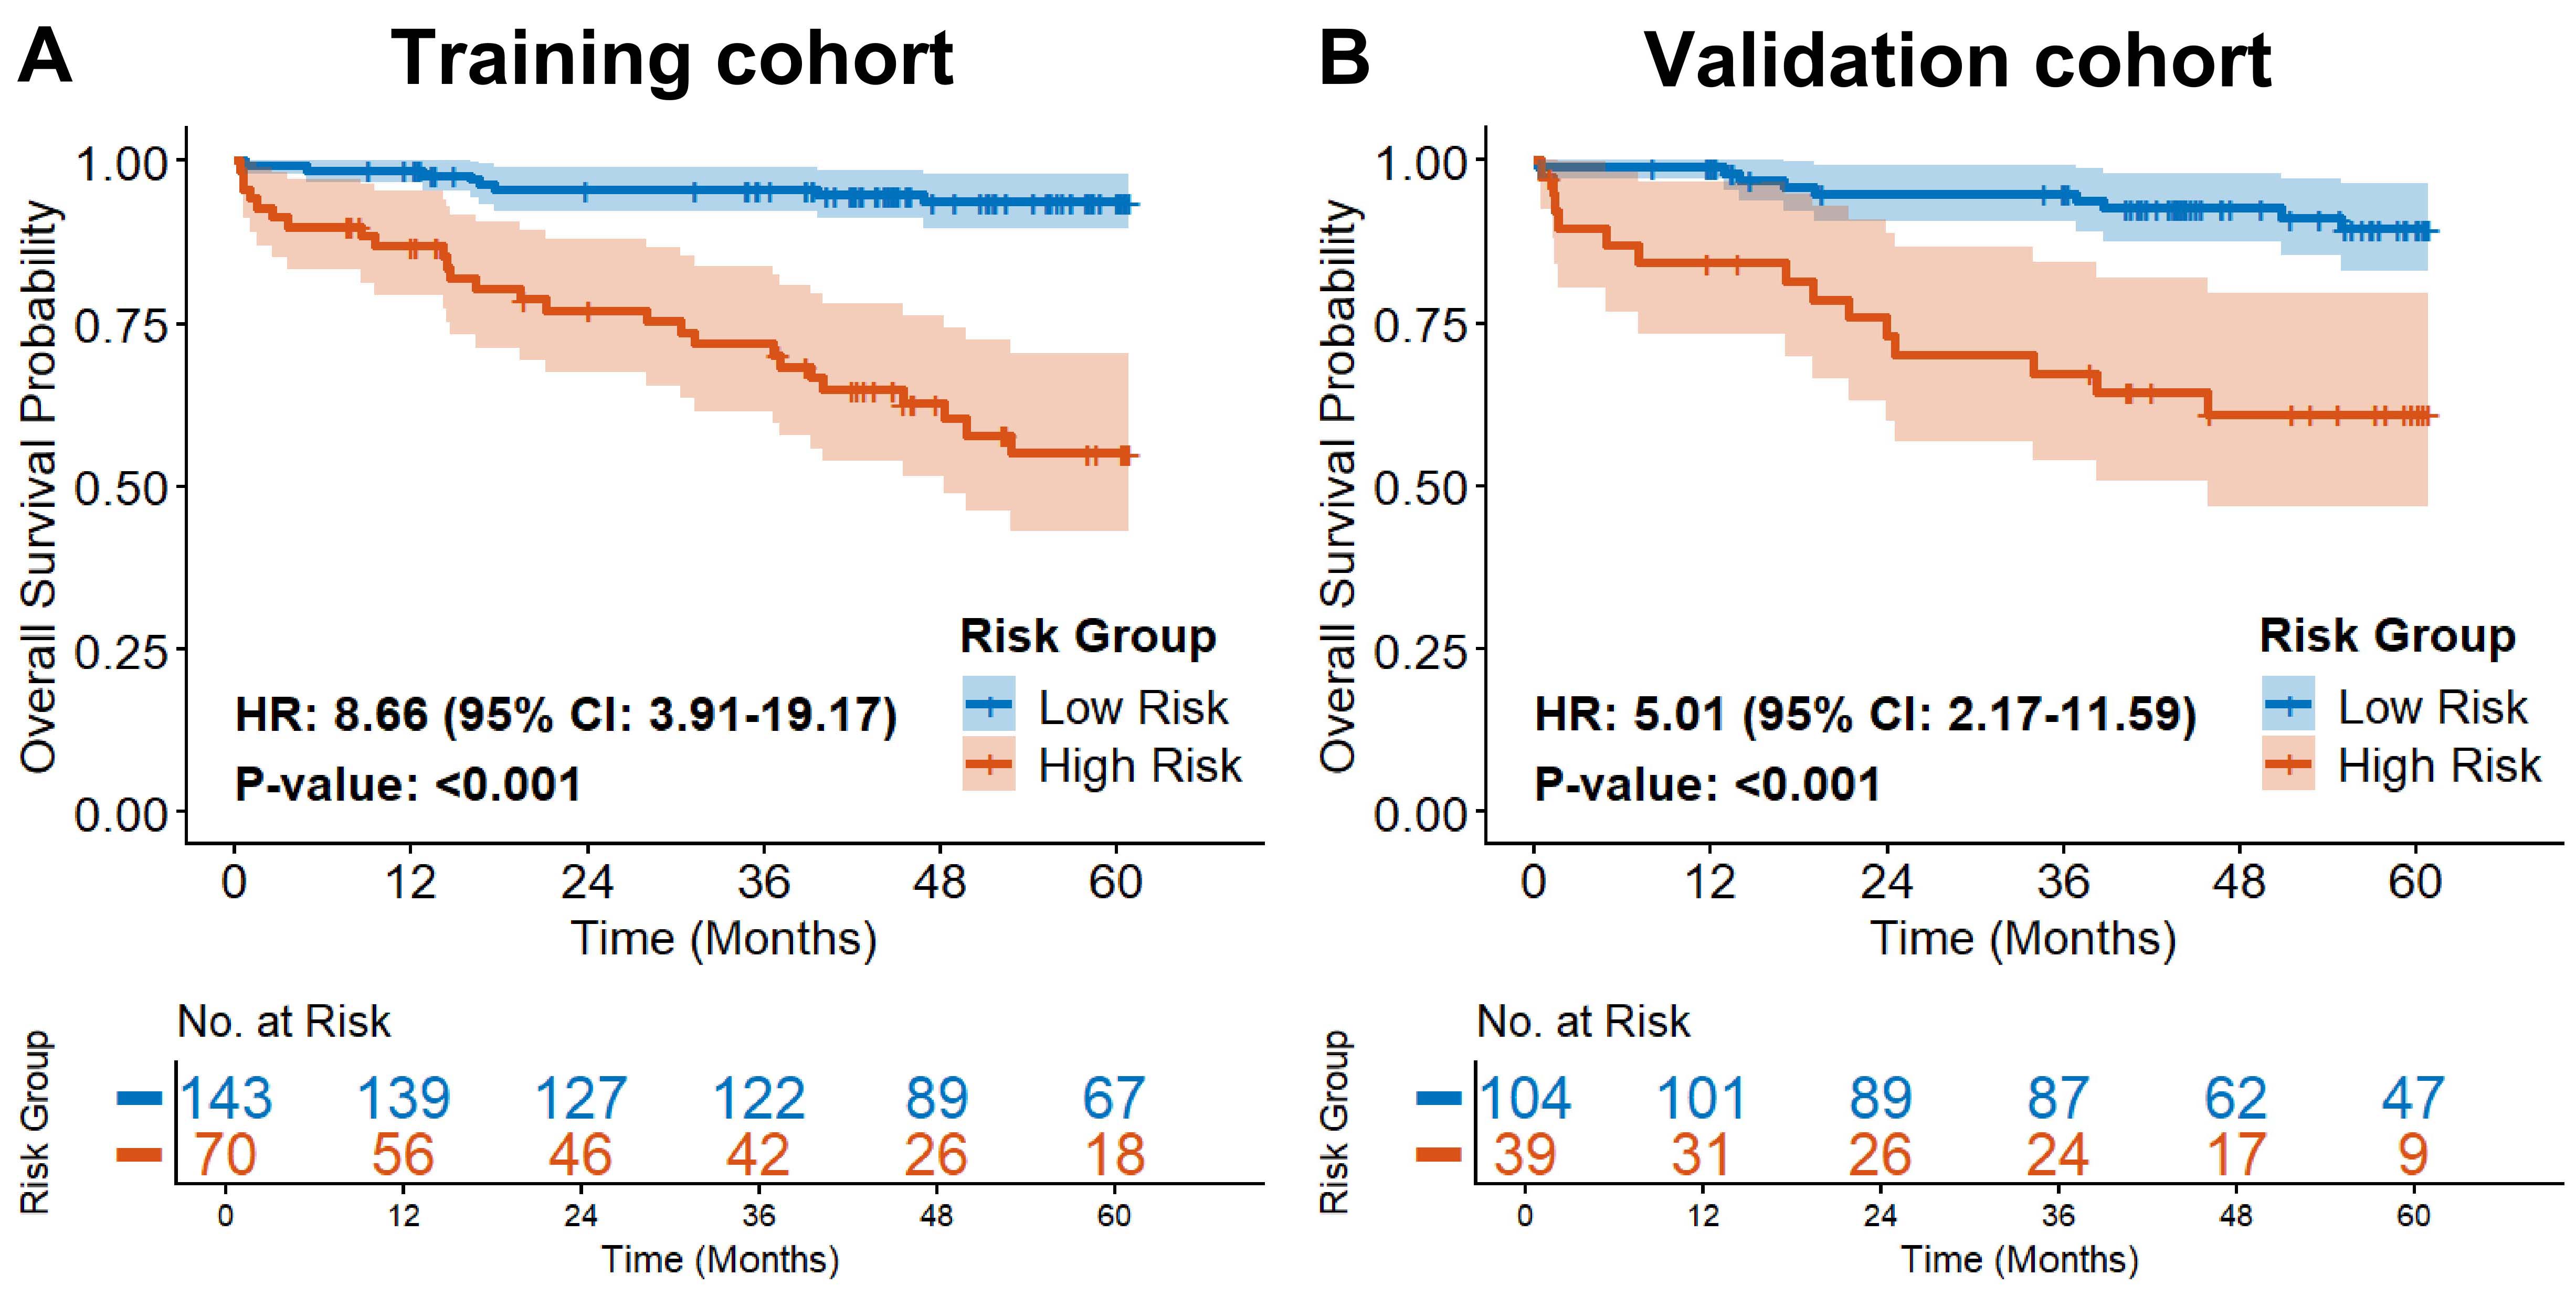
Figure 4. Kaplan-Meier survival analysis. (A and B) Kaplan-Meier survival curves for the training and validation cohorts, respectively. Patients were stratified into high-risk and low-risk groups using the 66th percentile of IF-SPECT risk scores derived from the training cohort. The same cutoff was applied to the validation cohort. Hazard ratios (HRs) with 95% confidence intervals are shown in each panel.




