

fig3
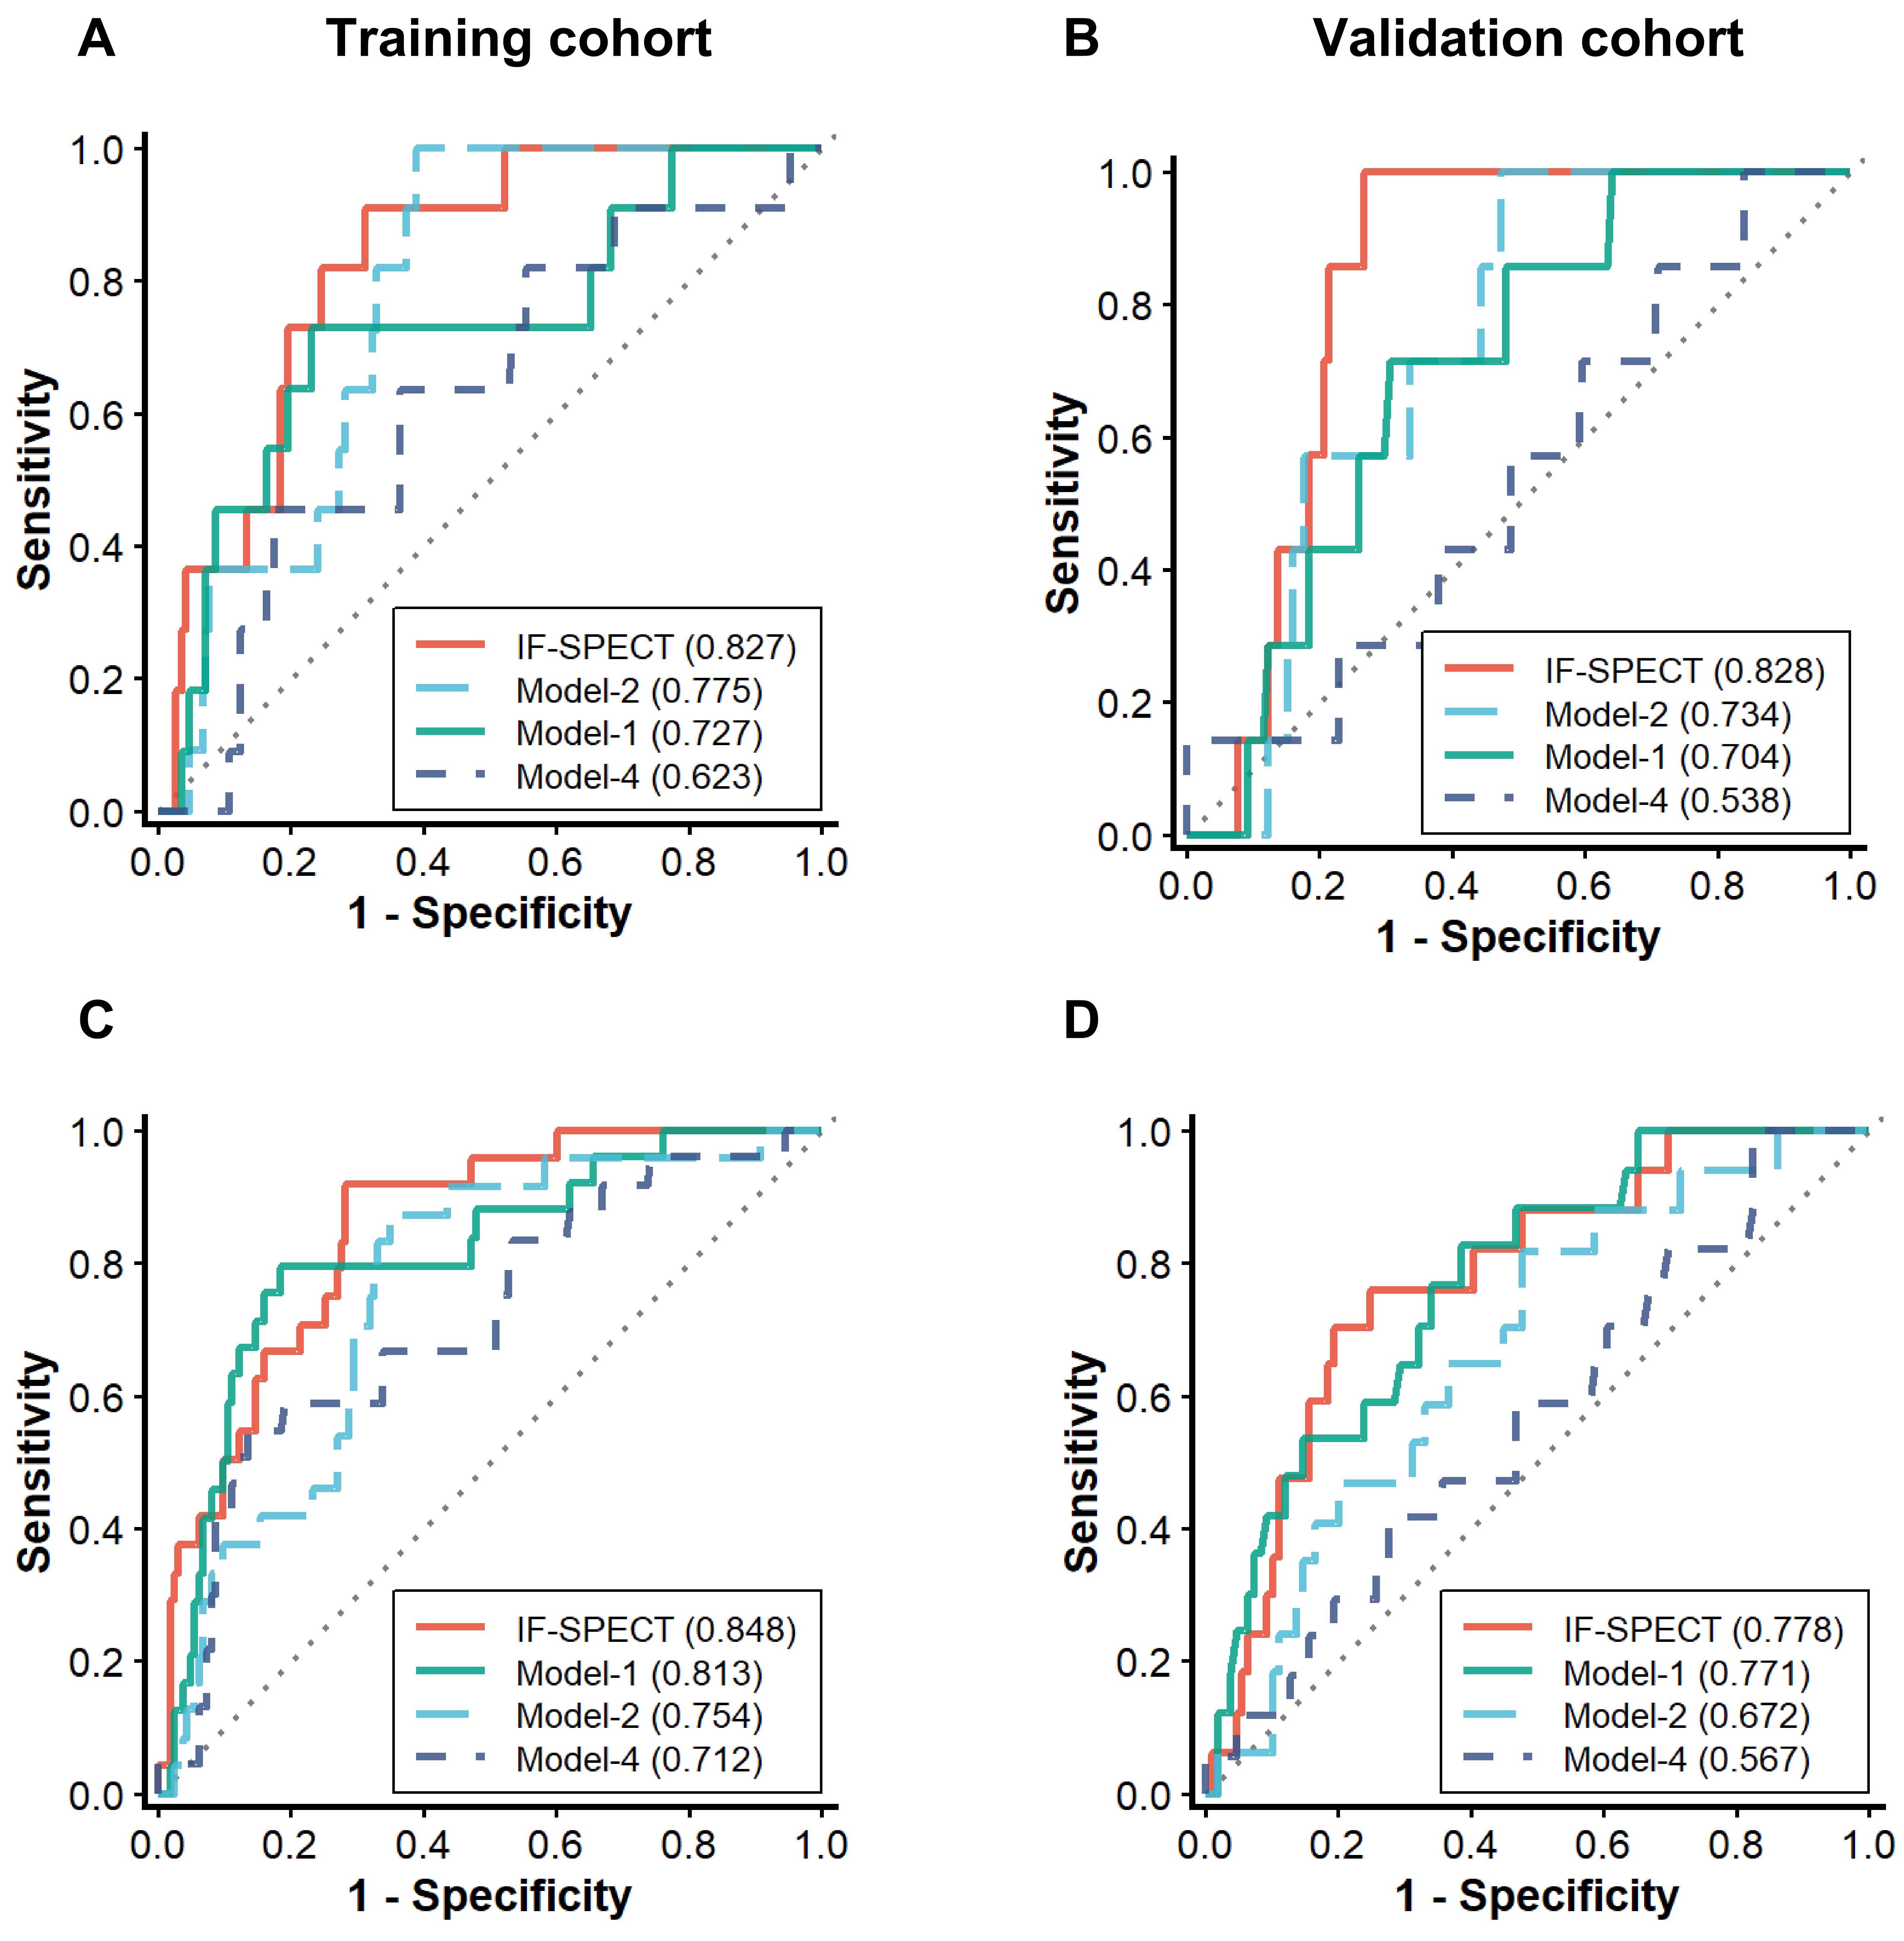
Figure 3. Receiver operating characteristic (ROC) curves for all-cause mortality prediction. (A and B) ROC curves for 1-year all-cause mortality prediction in the training and validation cohorts, respectively. (C and D) ROC curves for 3-year all-cause mortality prediction in the training and validation cohorts, respectively.




