

fig5
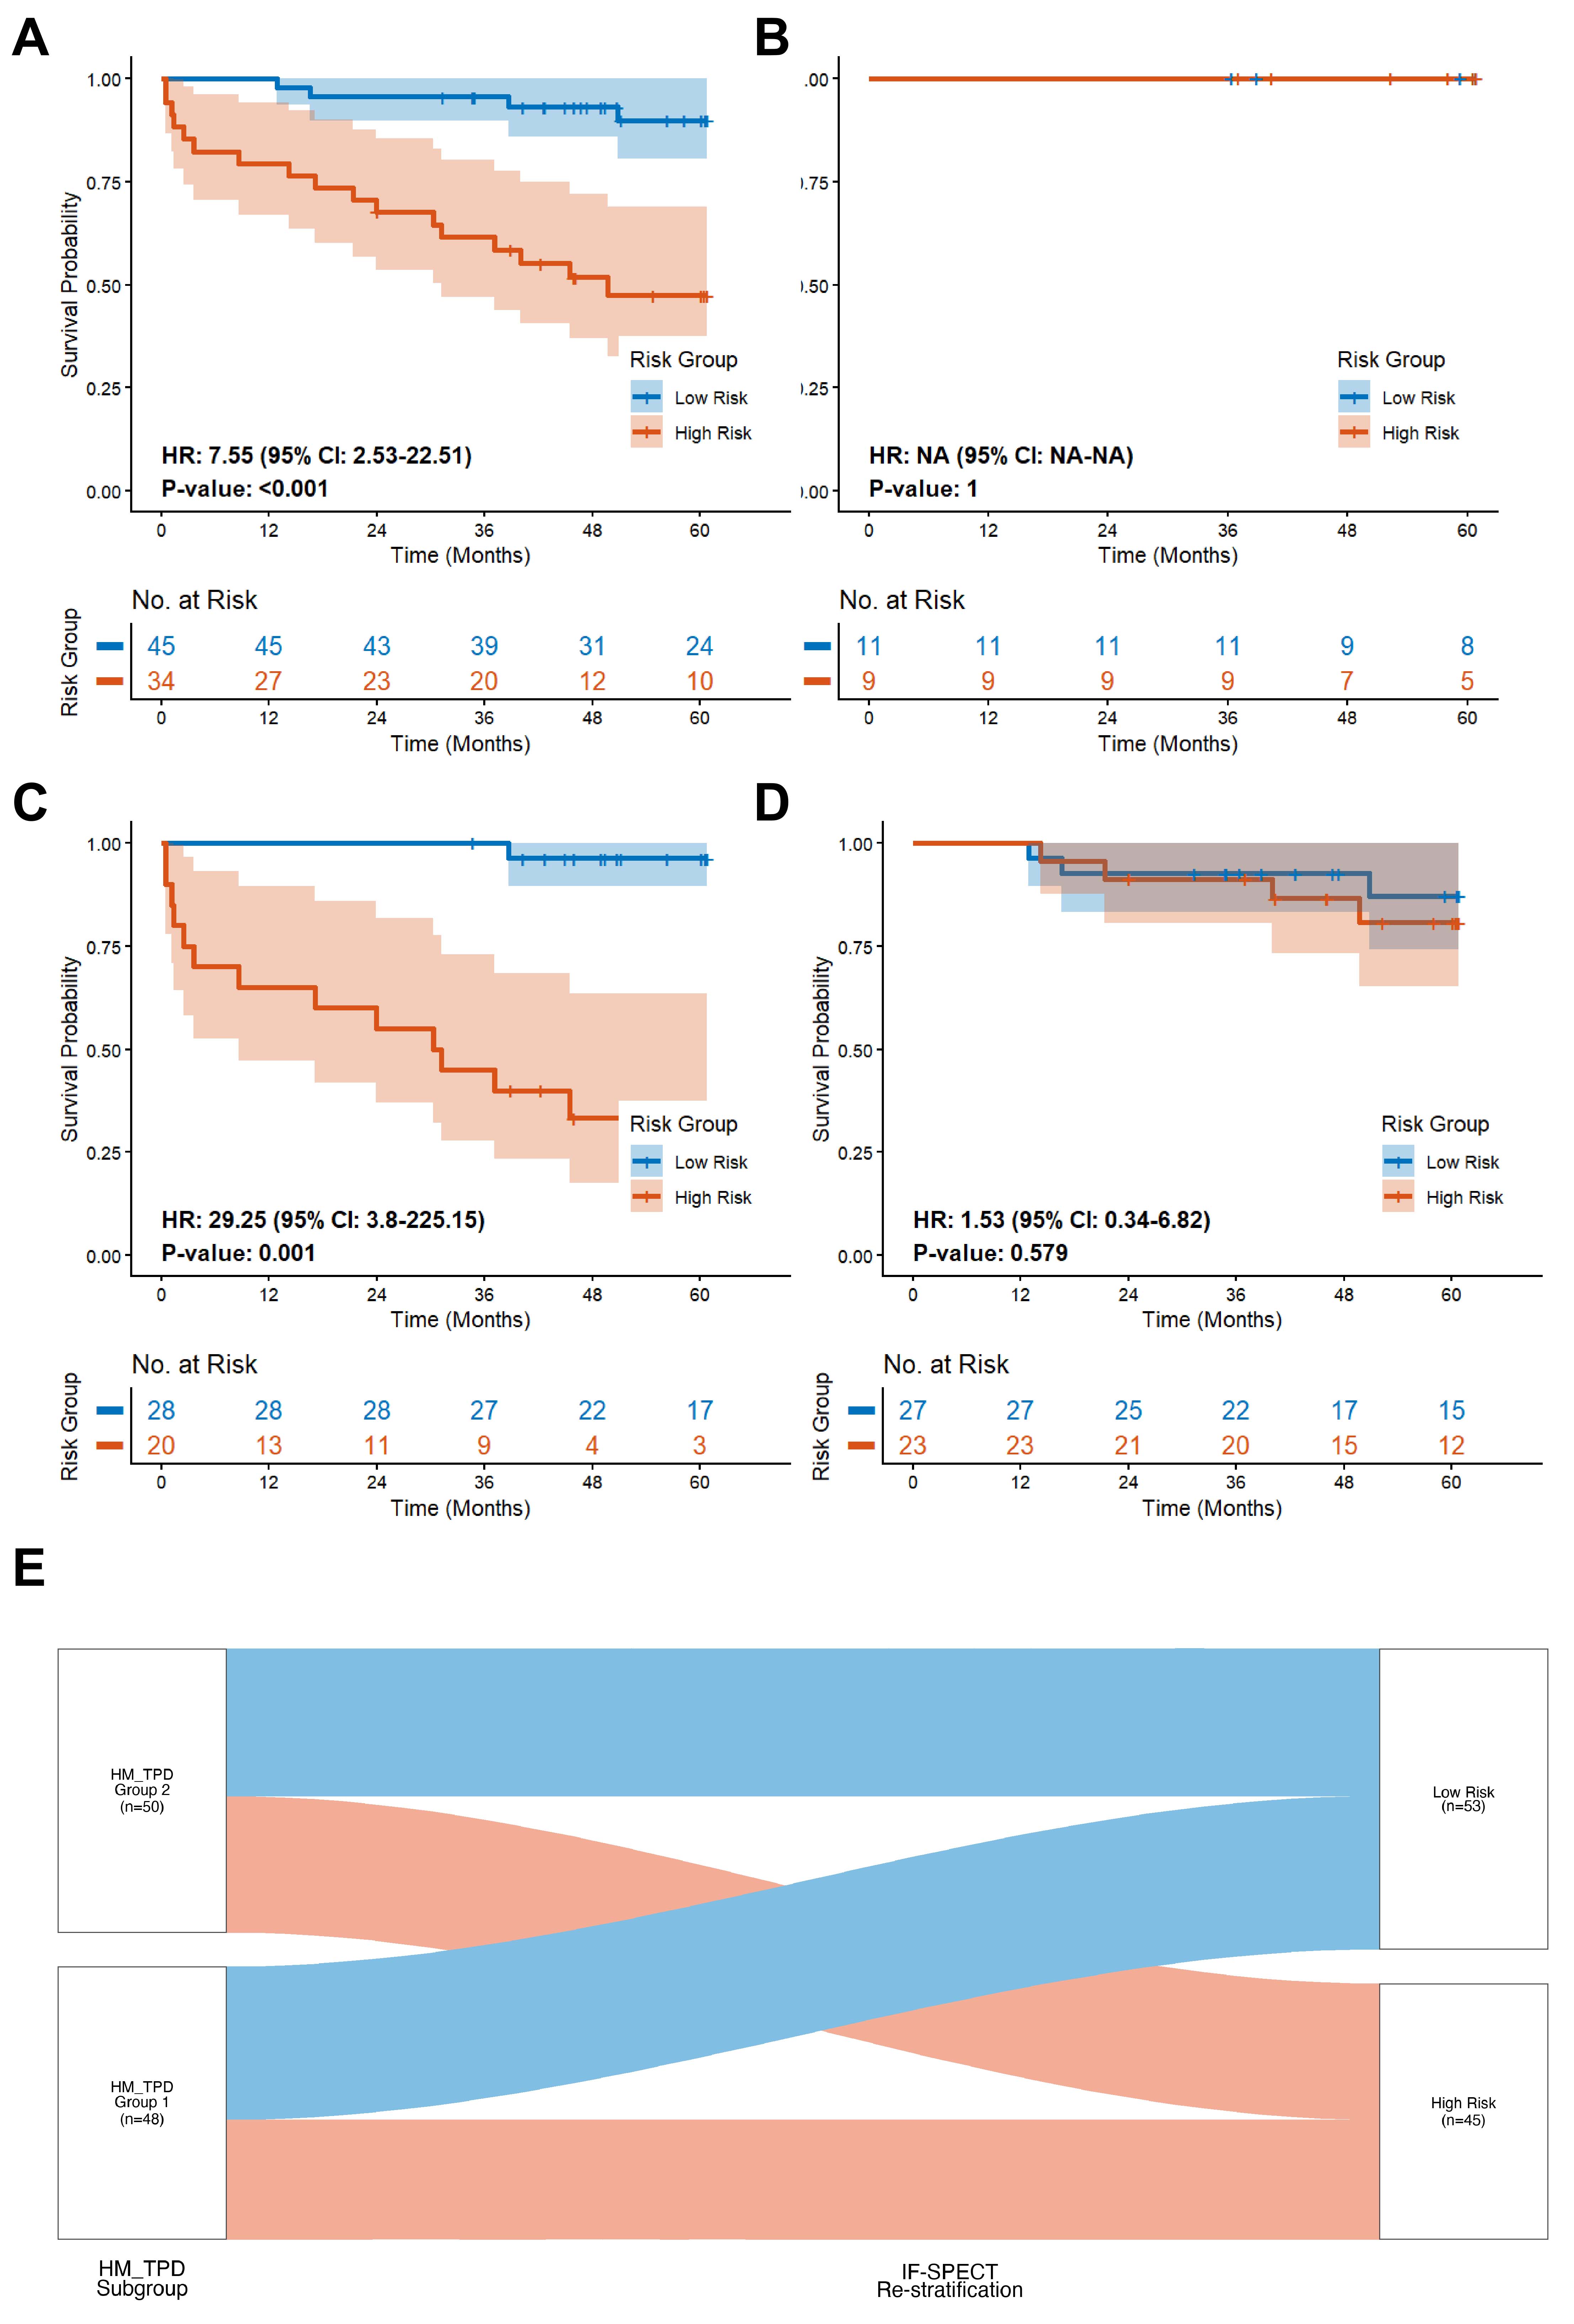
Figure 5. Subgroup survival analysis and clinical risk restratification by the IF-SPECT model. (A and B) Kaplan-Meier survival analysis stratified by available treatment-strategy information. Treatment strategy = 0 indicates maintenance/non-revascularization management, whereas treatment strategy = 1 indicates revascularization strategy (PCI or CABG). In (B), no events occurred in the revascularization-strategy subgroup; therefore, the hazard ratio was not estimable. (C and D) Kaplan-Meier survival analysis stratified by HM_TPD index-defined subgroups. HM_TPD group 1 represents a low HM_TPD index (< 0.3), and HM_TPD group 2 represents a high HM_TPD index




