


A kirigami-enabled mechanoreceptor-inspired tactile sensor with spatially multidirectional force decoding
 0
0 Abstract
Flexible tactile sensors capable of resolving complex mechanical stimuli are essential for advanced electronic skins. However, simultaneous perception of force magnitude, direction, and dynamic loading remains challenging without complex circuitry. Here, we report a kirigami-enabled, skin-inspired flexible sensor that achieves spatially distributed receptor-like responses through a three-dimensional (3D) laser-induced graphene (LIG) network. By transferring LIG from a kirigami-engineered polyimide substrate, we transform a planar conductive layer into a 3D architecture with height-dependent electrical characteristics. This structural differentiation enables spatially-encoded electromechanical transduction, where heterogeneous sensitivities across the 3D-LIG network translate simple stimuli into high-dimensional signal features. Consequently, the architecture inherently decouples force amplitude from dynamic loading through its non-linear deformation profiles. By further leveraging kirigami-induced anisotropy, the sensor achieves simultaneous resolution of multidirectional force vectors without requiring complex peripheral circuitry. The sensor demonstrates a linear pressure range of 0-35 kPa and high durability over 10,000 cycles. Leveraging this “structural coding” paradigm, the device enables high-accuracy recognition of surface roughness (95.34%) and gait patterns (91.77%) via machine learning. This work offers a robust strategy for biomimetic tactile sensing by integrating 3D structural engineering with intrinsic multidimensional signal decoupling. This design provides a promising foundation for intelligent prosthetics and human machine interfaces, achieving force vector resolution within a single structure.
Keywords
INTRODUCTION
The ability to perceive complex mechanical stimuli, including force magnitude, direction, and dynamic loading behaviors, is fundamental to advanced tactile perception in biological systems[1]. In human skin[2], such multifunctional sensing is achieved through the spatial distribution of mechanoreceptors with distinct structural and functional characteristics, enabling simultaneous encoding of static pressure and dynamic stimuli[3]. Replicating this capability in artificial tactile sensors, however, remains challenging. Most existing flexible sensors rely on homogeneous material systems or planar device architectures, which inherently limit their ability to differentiate multidimensional mechanical inputs and often require external signal processing to compensate for the lack of structural selectivity[4,5]. Therefore, developing a structural strategy that enables intrinsic, spatially differentiated mechanotransduction remains a critical challenge for next-generation electronic skins and human-machine interfaces.
Considerable efforts have been devoted to developing flexible tactile sensors capable of detecting multidimensional mechanical stimuli, including pressure magnitude[6,7], direction[8,9], and dynamic loading behaviors[10]. Strategies based on material engineering[11,12], microstructured dielectrics[13,14], multilayer architectures[15], and signal-processing-assisted[16] sensor arrays have been widely explored to enhance sensing performance. Notably, emerging materials such as metal oxides have also shown promise in enabling self-powered sensing through triboelectric nanogenerator technology, offering alternative pathways for energy-autonomous tactile systems[17]. While these approaches have achieved notable progress, most of them rely on planar or quasi-planar device configurations, in which different sensing modalities are realized through material heterogeneity or external signal decoupling algorithms[18,19]. Such designs inherently lack structural differentiation at the device level, making it difficult to intrinsically encode spatially distributed mechanical information. As a result, the perception of force direction and dynamic loading often requires complex post-processing or sensor arrays, rather than arising naturally from the device architecture itself. In contrast, biological skin achieves multidimensional tactile perception through the spatial organization of mechanoreceptors with distinct structural and functional characteristics, enabling simultaneous encoding of static and dynamic stimuli[20-23]. Therefore, developing a structural strategy that can translate geometric differentiation into receptor-like electromechanical responses remains a critical challenge for next-generation tactile sensors.
In recent years, kirigami-inspired structural engineering has emerged as an effective strategy for imparting stretchability and mechanical adaptability to flexible electronic systems[24]. By introducing designed cuts and folding patterns, kirigami architectures enable planar materials to transform into three-dimensional configurations with programmable deformation behaviors[25,26]. This concept has been widely explored in stretchable conductors[27,28], wearable electronics[29-31], and electronic skins[32], where kirigami structures have been employed to enhance mechanical compliance, extend strain tolerance, and accommodate complex surface conformations. In the context of tactile sensing, kirigami-based designs have been utilized to improve stretchability, enhance pressure sensitivity, or enable conformal contact with irregular surfaces[33]. Beyond improving mechanical deformability, kirigami architectures play several critical roles in the development of advanced tactile sensors and electronic skins[34,35]. First, by introducing programmed cuts and folds, kirigami enables large out-of-plane deformation and enhanced mechanical compliance, allowing devices to conform to complex surfaces while maintaining structural integrity. Second, the geometric features of kirigami structures effectively redistribute and localize mechanical stress, which can significantly amplify electromechanical responses and improve pressure sensitivity. More importantly, kirigami provides a unique opportunity to introduce structural heterogeneity into otherwise homogeneous sensing layers[36,37]. The resulting three-dimensional architectures naturally generate spatially differentiated mechanical and electrical responses under external stimuli, offering a physical basis for encoding tactile information at the structural level. This characteristic is particularly attractive for emulating the distributed mechanoreceptor system of human skin, yet remains largely underexplored in existing kirigami-based tactile sensors.
Several studies have demonstrated that kirigami geometries can effectively modulate stress distribution and amplify electromechanical responses[38,39], thereby improving sensing performance under large deformation. However, in most reported cases, kirigami structures primarily serve as mechanical enablers, while the sensing mechanisms remain largely homogeneous and planar in nature. The resulting devices typically rely on uniform conductive networks or external signal processing to interpret mechanical stimuli, limiting their ability to intrinsically differentiate force direction or dynamic loading behaviors. More importantly, despite the structural complexity introduced by kirigami designs, their potential for enabling spatially differentiated and receptor-like sensing functions has remained largely unexplored. Existing approaches rarely exploit the height-dependent or geometry-induced electrical heterogeneity that naturally arises from three-dimensional kirigami architectures, nor do they establish a direct correlation between structural features and multimodal tactile perception. This gap highlights the need for a kirigami-enabled sensing strategy in which structural transformation itself serves as the primary mechanism for encoding force magnitude, direction, and dynamic information. However, the potential of kirigami-induced three-dimensional architectures to enable spatially differentiated and receptor-like tactile sensing has not yet been systematically explored.
Here, we report a kirigami-enabled skin-inspired tactile sensor that realizes spatially distributed receptor-like responses through a three-dimensional graphene architecture. By transferring laser-induced graphene from a kirigami-engineered polyimide substrate, a planar conductive network is transformed into a three-dimensional structure with height-dependent electrical characteristics. This kirigami-induced structural differentiation gives rise to distinct electromechanical responses across different regions of the device, enabling intrinsic encoding of force magnitude, loading velocity, and force direction without relying on complex signal processing. This work therefore establishes a kirigami-based structural paradigm for constructing tactile sensors with receptor-like functionality, offering new opportunities for advanced electronic skins and human-machine interfaces[40].
EXPERIMENTAL
Materials
Ecoflex solution (Smooth-0050) was purchased from Smooth-on Inc., Macungie, PA, USA. SiO2 powder (spherical, white, average diameter 300 nm, purity 99% and, volume density 0.08 g/cm3) was purchased from Shanghai YaoYi Alloy Materials Co., Ltd. Gold finger high-temperature tape (translucent tea color, polyimide material, thickness 0.08 mm) was purchased from Shenzhen Xinhongsen Technology Co., Ltd.
Sensor fabrication
First, Ecoflex and SiO2 powder were thoroughly mixed at a weight ratio of 10:1 to obtain a homogeneous liquid substrate. Next, laser-induced graphene (LIG) technology was employed, in which a laser (HB-3020, Liaocheng Huibang Laser Technology Co., Ltd., China) operating at 14% power directly irradiated a polyimide (PI) substrate to generate a porous graphene structure with a high specific surface area. Subsequently, the prepared liquid substrate mixture was poured onto the graphene layer. After curing, the solidified substrate was carefully peeled off from the PI surface. Graphite-based conductive adhesive was then applied to bond copper tape to the electrode pads of the graphene sensing unit on the cured substrate. After that, pure Ecoflex liquid substrate material (without SiO2 powder filler) was poured into a mold, in which the peeled solid substrate was positioned and fixed. The assembly was then subjected to thermal treatment at 60 °C for 30 min to promote the formation of a three-dimensional conductive network resembling biological nerve endings. Finally, the cured substrate was demolded, and a new layer of pure Ecoflex liquid substrate material (without silica filler) was poured onto the bottom surface of the solid substrate. After the final curing step, the complete flexible sensor structure was obtained.
Testing method and data collection
Basic performance tests were carried out using a ZQ-9908 electronic pressure testing machine (Dongguan Zhiqu Precision Instrument Co., Ltd., China), which applied forces of varying frequencies and magnitudes to the pressure sensor. For the multi-directional force tests, the sensor was mounted on platforms tilted at 30° and 60° to simulate forces applied from different directions. Forces were subsequently applied to the sensor at various loading speeds. In the surface roughness tests, the mold was mounted on a tensile tester, and sandpapers with different grit sizes were attached to its underside. The sensor was fixed onto a linear sliding rail, and the electronic pressure testing machine was used to lower the mold until a pressure of 25 kPa was applied to the sensor surface. Subsequently, the sliding rail was actuated to move the sensor across surfaces of different roughness, ensuring stable and continuous contact throughout the process. Resistance variations during the experiments were recorded in real time using a DAQ970A multifunctional data acquisition system (Keysight Technologies, USA). For gait detection experiments, two sensors were attached to the soles of the feet, and four types of motion-walking forward, walking backward, ascending stairs, and descending stairs-were performed. A custom-designed flexible printed circuit board (FPCB) was used to collect the resistance signals, which were then transmitted to a computer via Bluetooth for further processing. The signal acquisition system was implemented using the integrated 12-bit Successive Approximation Register Analog-to-Digital Converter (SAR ADC) of an nRF52832 microcontroller. The SAR-ADC was configured in single-ended mode with a 12-bit resolution. The system sampling rate was set to 100 ksps, with an acquisition time of 3 μs to match the source impedance. To maintain high sampling throughput, oversampling was not enabled. Under these conditions, the estimated effective number of bits (ENOB) was approximately 9.0 bits, corresponding to a signal-to-noise ratio (SNR) of approximately 56 dB.
Data preprocessing and machine learning protocols
To ensure the reproducibility and rigor of the learning-based assessment, we established strict protocols for dataset construction and model training across the multi-directional force, roughness, and gait recognition tasks. Specifically, we constructed three balanced datasets: a 16-class dataset for multi-directional force (N = 800, 50 trials/class), an 8-class dataset for roughness (N = 160, 20 trials/class), and a 4-class dataset for gait recognition (N = 80, 20 trials/class). The raw multi-channel time-series resistance signals were used as input features. Prior to training, artifacts were removed, and features were normalized using Z-score standardization to achieve zero mean and unit variance. For model evaluation, we employed a stratified hold-out strategy, partitioning each dataset into a 70% training set and a 30% testing set. A fixed random seed was utilized during this split to ensure experimental reproducibility. During the training phase, hyperparameters for the K-Nearest Neighbors (KNN) classifier were optimized using a grid search approach with 5-fold cross-validation on the training set, while the training stability of Backpropagation (BP) neural networks and Support Vector Machines (SVMs) was monitored against validation performance.
Statistical analysis and software
All experimental data obtained from mechanical and electrical characterizations were presented as mean ± standard deviation (SD) where applicable. Raw sensor data acquisition, time-series segmentation, and data preprocessing were conducted using Python (version 3.10). The extraction of statistical features (mean, standard deviation, maximum, and minimum), data standardization (Z-score), principal component analysis (PCA), and the implementation of traditional machine learning algorithms - including KNN and SVM - were performed using the scikit-learn library. The BP neural networks were constructed using TensorFlow/Keras, while the 1D Convolutional Neural Networks (1D-CNN) and the Enhanced Multilayer Perceptron (EMLP) for multi-directional force decoupling were developed and trained utilizing the PyTorch framework. Model interpretability and feature importance were analyzed using the SHAP (Shapley Additive exPlanations) library. Model performance was evaluated using standard metrics including Accuracy, Mean Squared Error (MSE), R-squared (R2), and Area Under the Curve (AUC), with 5-fold cross-validation (5-Fold CV) and grid search strategies applied to optimize hyperparameters and ensure robustness. All statistical visualizations, including confusion matrices, Receiver Operating Characteristic (ROC) curves, box plots, and feature distribution maps, were generated using Matplotlib and Origin 2024 (OriginLab Corporation, Northampton, MA, USA). A P-value < 0.05 was considered statistically significant.
RESULTS AND DISCUSSIONS
Overall design and working principle
To achieve tactile sensing capabilities beyond conventional pressure detection, we propose a structural-functional co-design strategy in which mechanical architecture is deliberately engineered to encode multidimensional tactile information at the device level. Rather than relying on complex signal processing or sensor arrays, this work aims to realize intrinsic decoupling of force magnitude, direction, and loading dynamics through the rational design of material composition and three-dimensional geometry. By integrating kirigami-enabled structural transformation with a hierarchical conductive network, the sensing mechanism is shifted from material-dependent response to structure-governed signal modulation, providing a physically embedded pathway for spatiotemporal tactile perception. Guided by this concept, a bioinspired tactile system is developed that mimics the layered organization and distributed mechanoreception of human skin. The design combines a mechanically reinforced elastomeric substrate with a three-dimensional graphene network, enabling localized deformation, stress redistribution, and rate-dependent electrical responses. This architecture allows different mechanical stimuli to be mapped into distinguishable electrical signatures without external decoupling algorithms, thereby establishing a general framework for multifunctional tactile sensing based on structural encoding.
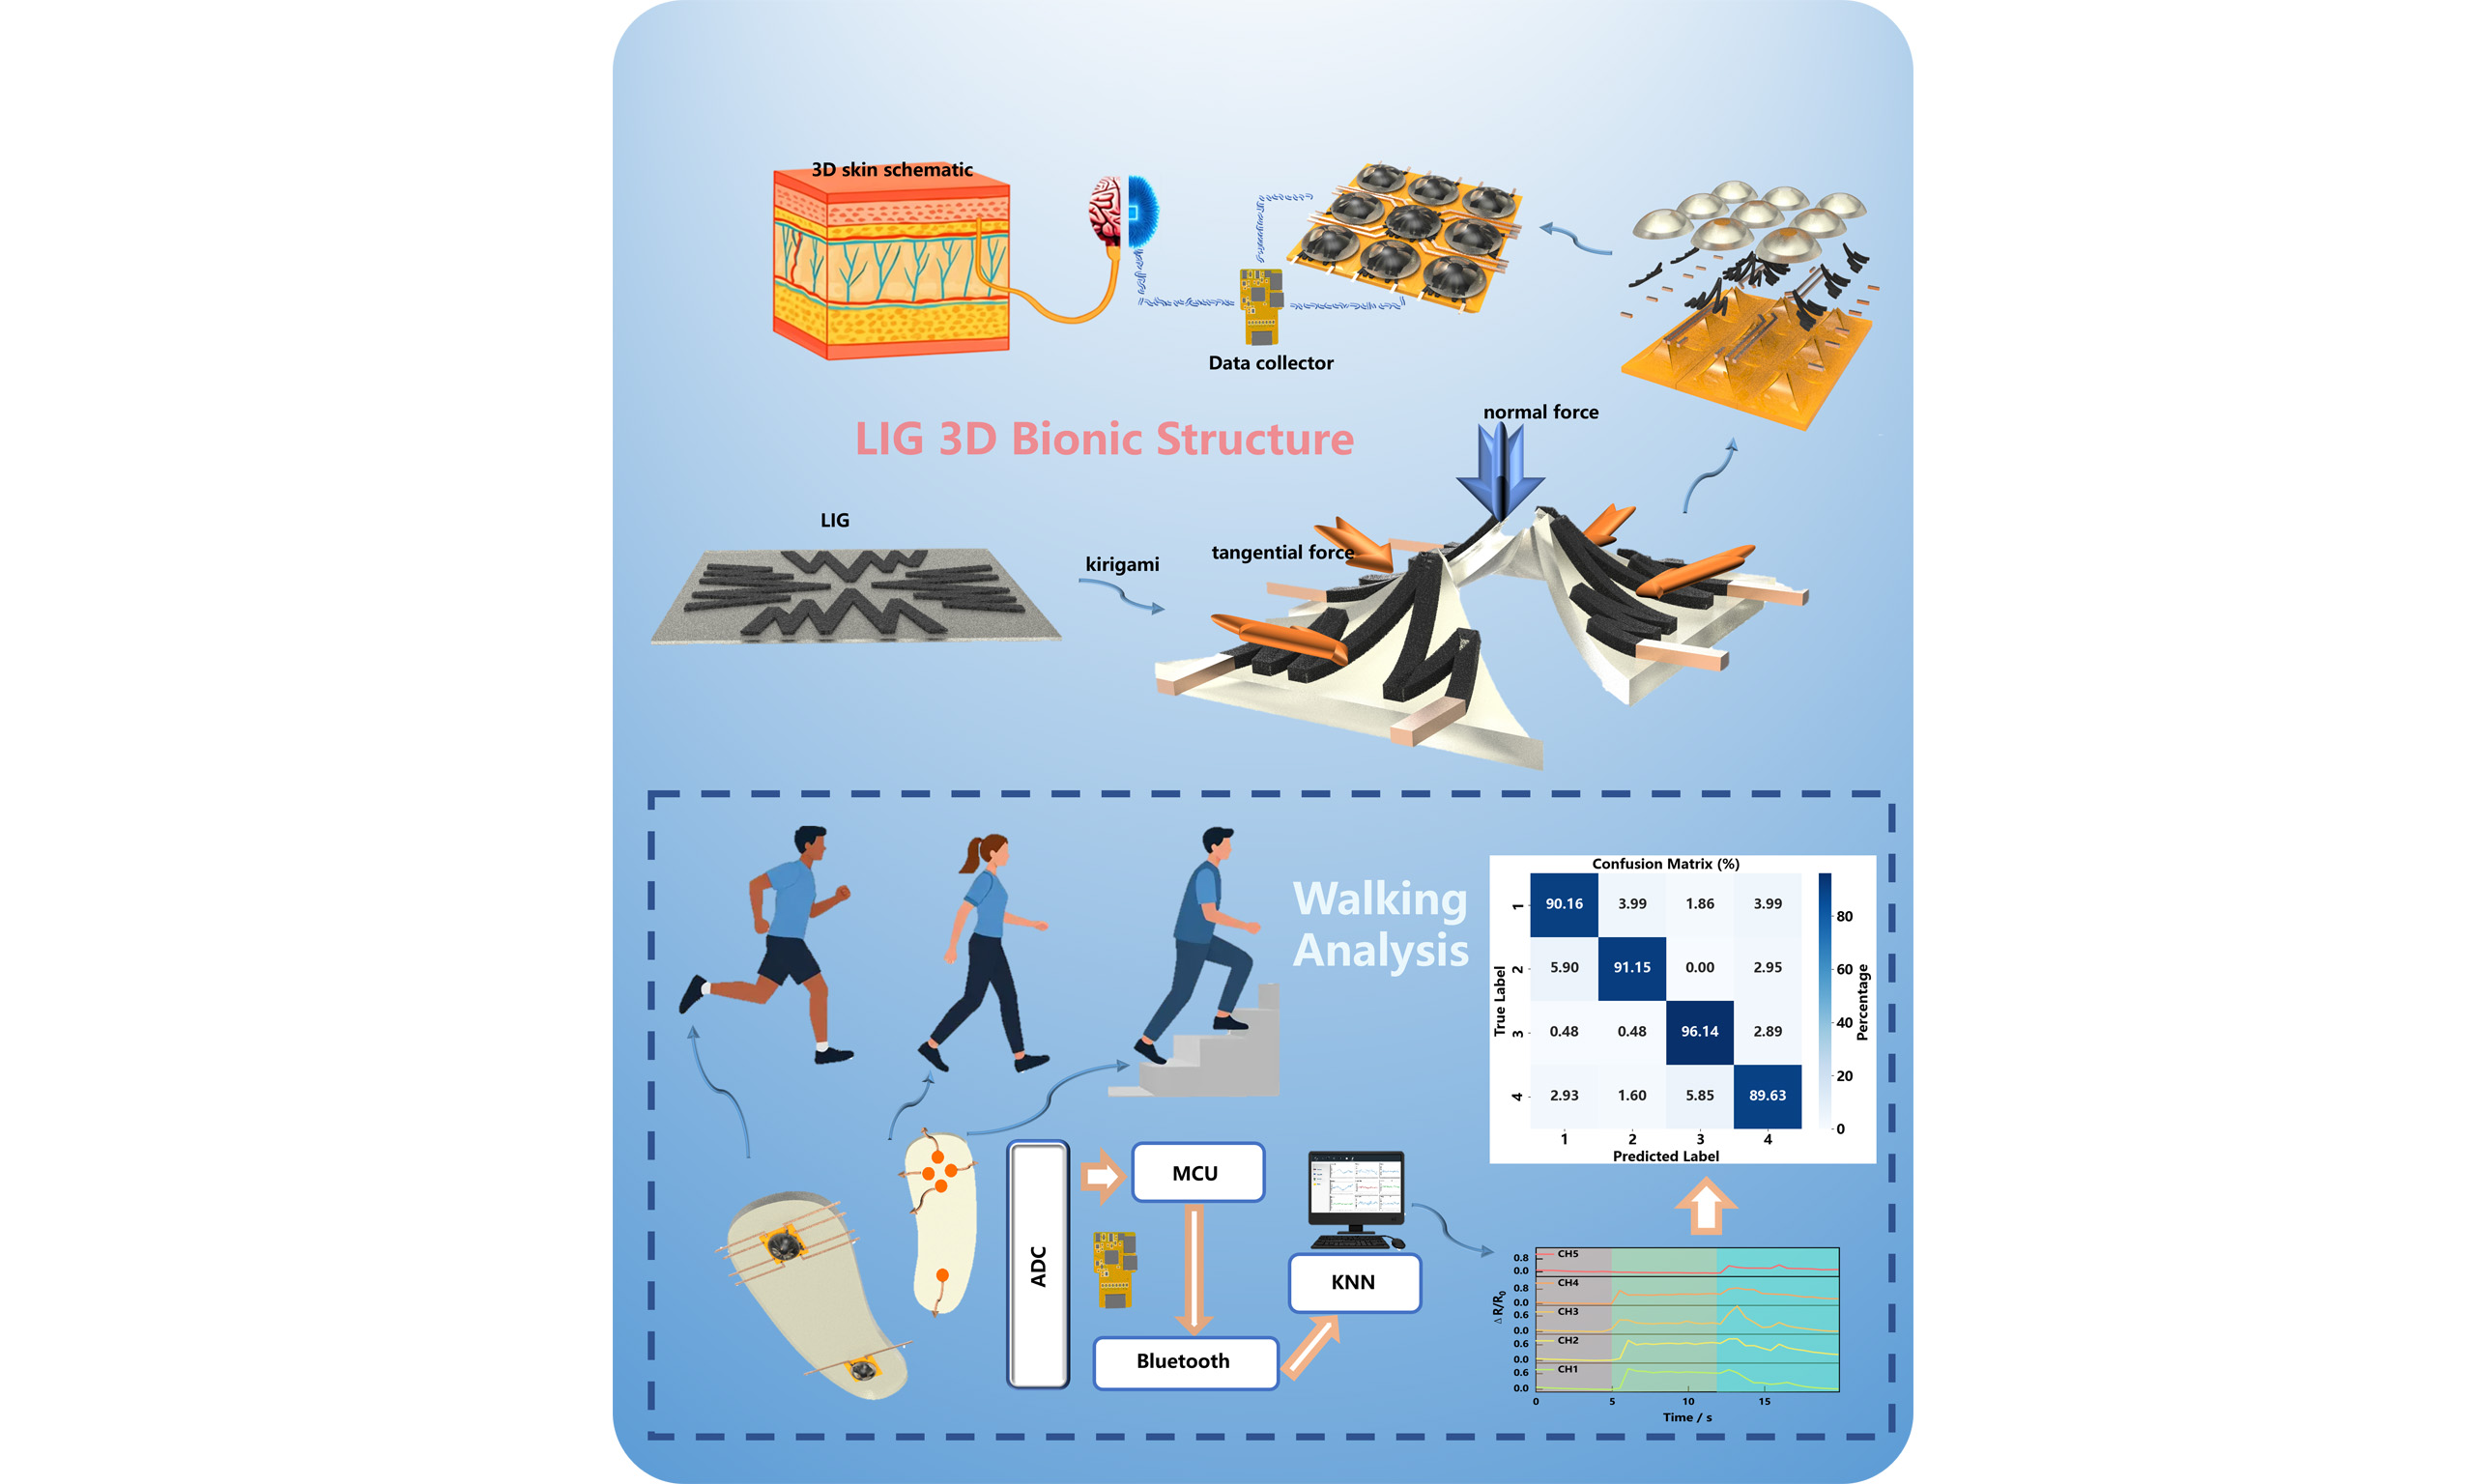
To elucidate the biomimetic design concept and structural architecture of the proposed sensor, Figure 1 provides an overview of its working mechanism, material composition, and representative application scenarios of the kirigami-enabled tactile sensor. Figure 1A illustrates the sensory mechanism of human skin, which converts external tactile stimuli into electrical impulses through sensory nerve endings, transmitting them to the brain for processing. Inspired by the hierarchical organization and spatial distribution of mechanoreceptors (e.g., Meissner and Pacinian corpuscles) in human skin, we developed a kirigami-enabled tactile sensor with a three-dimensional (3D)-structured conductive architecture [Supplementary Figure 1]. By employing a kirigami-assisted transfer of laser-induced graphene, the sensor replicates the skin’s stratified sensing capabilities, enabling height-dependent electromechanical responses that decouple complex tactile stimuli with high spatial accuracy. As illustrated in Figure 1B, the sensor consists of a SiO2-doped Ecoflex substrate, a three-dimensional graphene sensing layer, and patterned copper electrodes. The introduction of SiO2 particles enhances the stiffness of the elastomer and promotes efficient stress transmission to the conductive network. Scanning electron microscopy (SEM) observations [Figure 1C] reveal a well-interconnected graphene morphology with embedded SiO2 particles. Correspondingly, the doped structure exhibits a markedly enhanced pressure-dependent resistance response compared with the undoped counterpart. The sensing layer comprises a graphene-based conductive network engineered into a three-dimensional configuration, mimicking the neural architecture of human skin and thereby improving the sensor’s sensitivity and spatial resolution. This biomimetic design enables the sensor to discern both the direction and spatial distribution of applied pressure, effectively emulating the skin’s response to external stimuli [Figure 1C-I]. The SEM image [Figure 1C-II] reveals the surface morphology of the SiO2-doped graphene film, where SiO2 particles are embedded within the graphene pores. The incorporation of SiO2 not only enhances electrical conductivity but also forms a microstructure reminiscent of collagen fibers in the stratum corneum and dermis, thereby improving the response speed and precision of pressure detection. A comparison of resistance variations between SiO2-doped and undoped samples under compressive strain [Figure 1C-III] demonstrates that SiO2 doping induces larger resistance changes, confirming improved sensitivity and detection accuracy. The kirigami-enabled 3D configuration plays a critical role in generating rich, high-dimensional signal features, which significantly enhances the classification performance of the Artificial Intelligence (AI) algorithms. As illustrated in Figure 1D, mechanical loading induces sequential deformation of the hierarchical structure [Figure 1D-I], leading to distinct resistance evolution stages under different loading rates. This deformation-dependent conduction pathway gives rise to characteristic dual-peak electrical responses [Figure 1D-II], which attributes to presence of viscoelastic hysteresis and structural phase lag within the 3D kirigami framework [Figure 1D-III]. Owing to this 3D structure, the sensor is capable of resolving complex mechanical stimuli, including multidirectional forces and dynamic loading conditions, thereby providing a physical and structural encoding for spatiotemporal tactile perception.
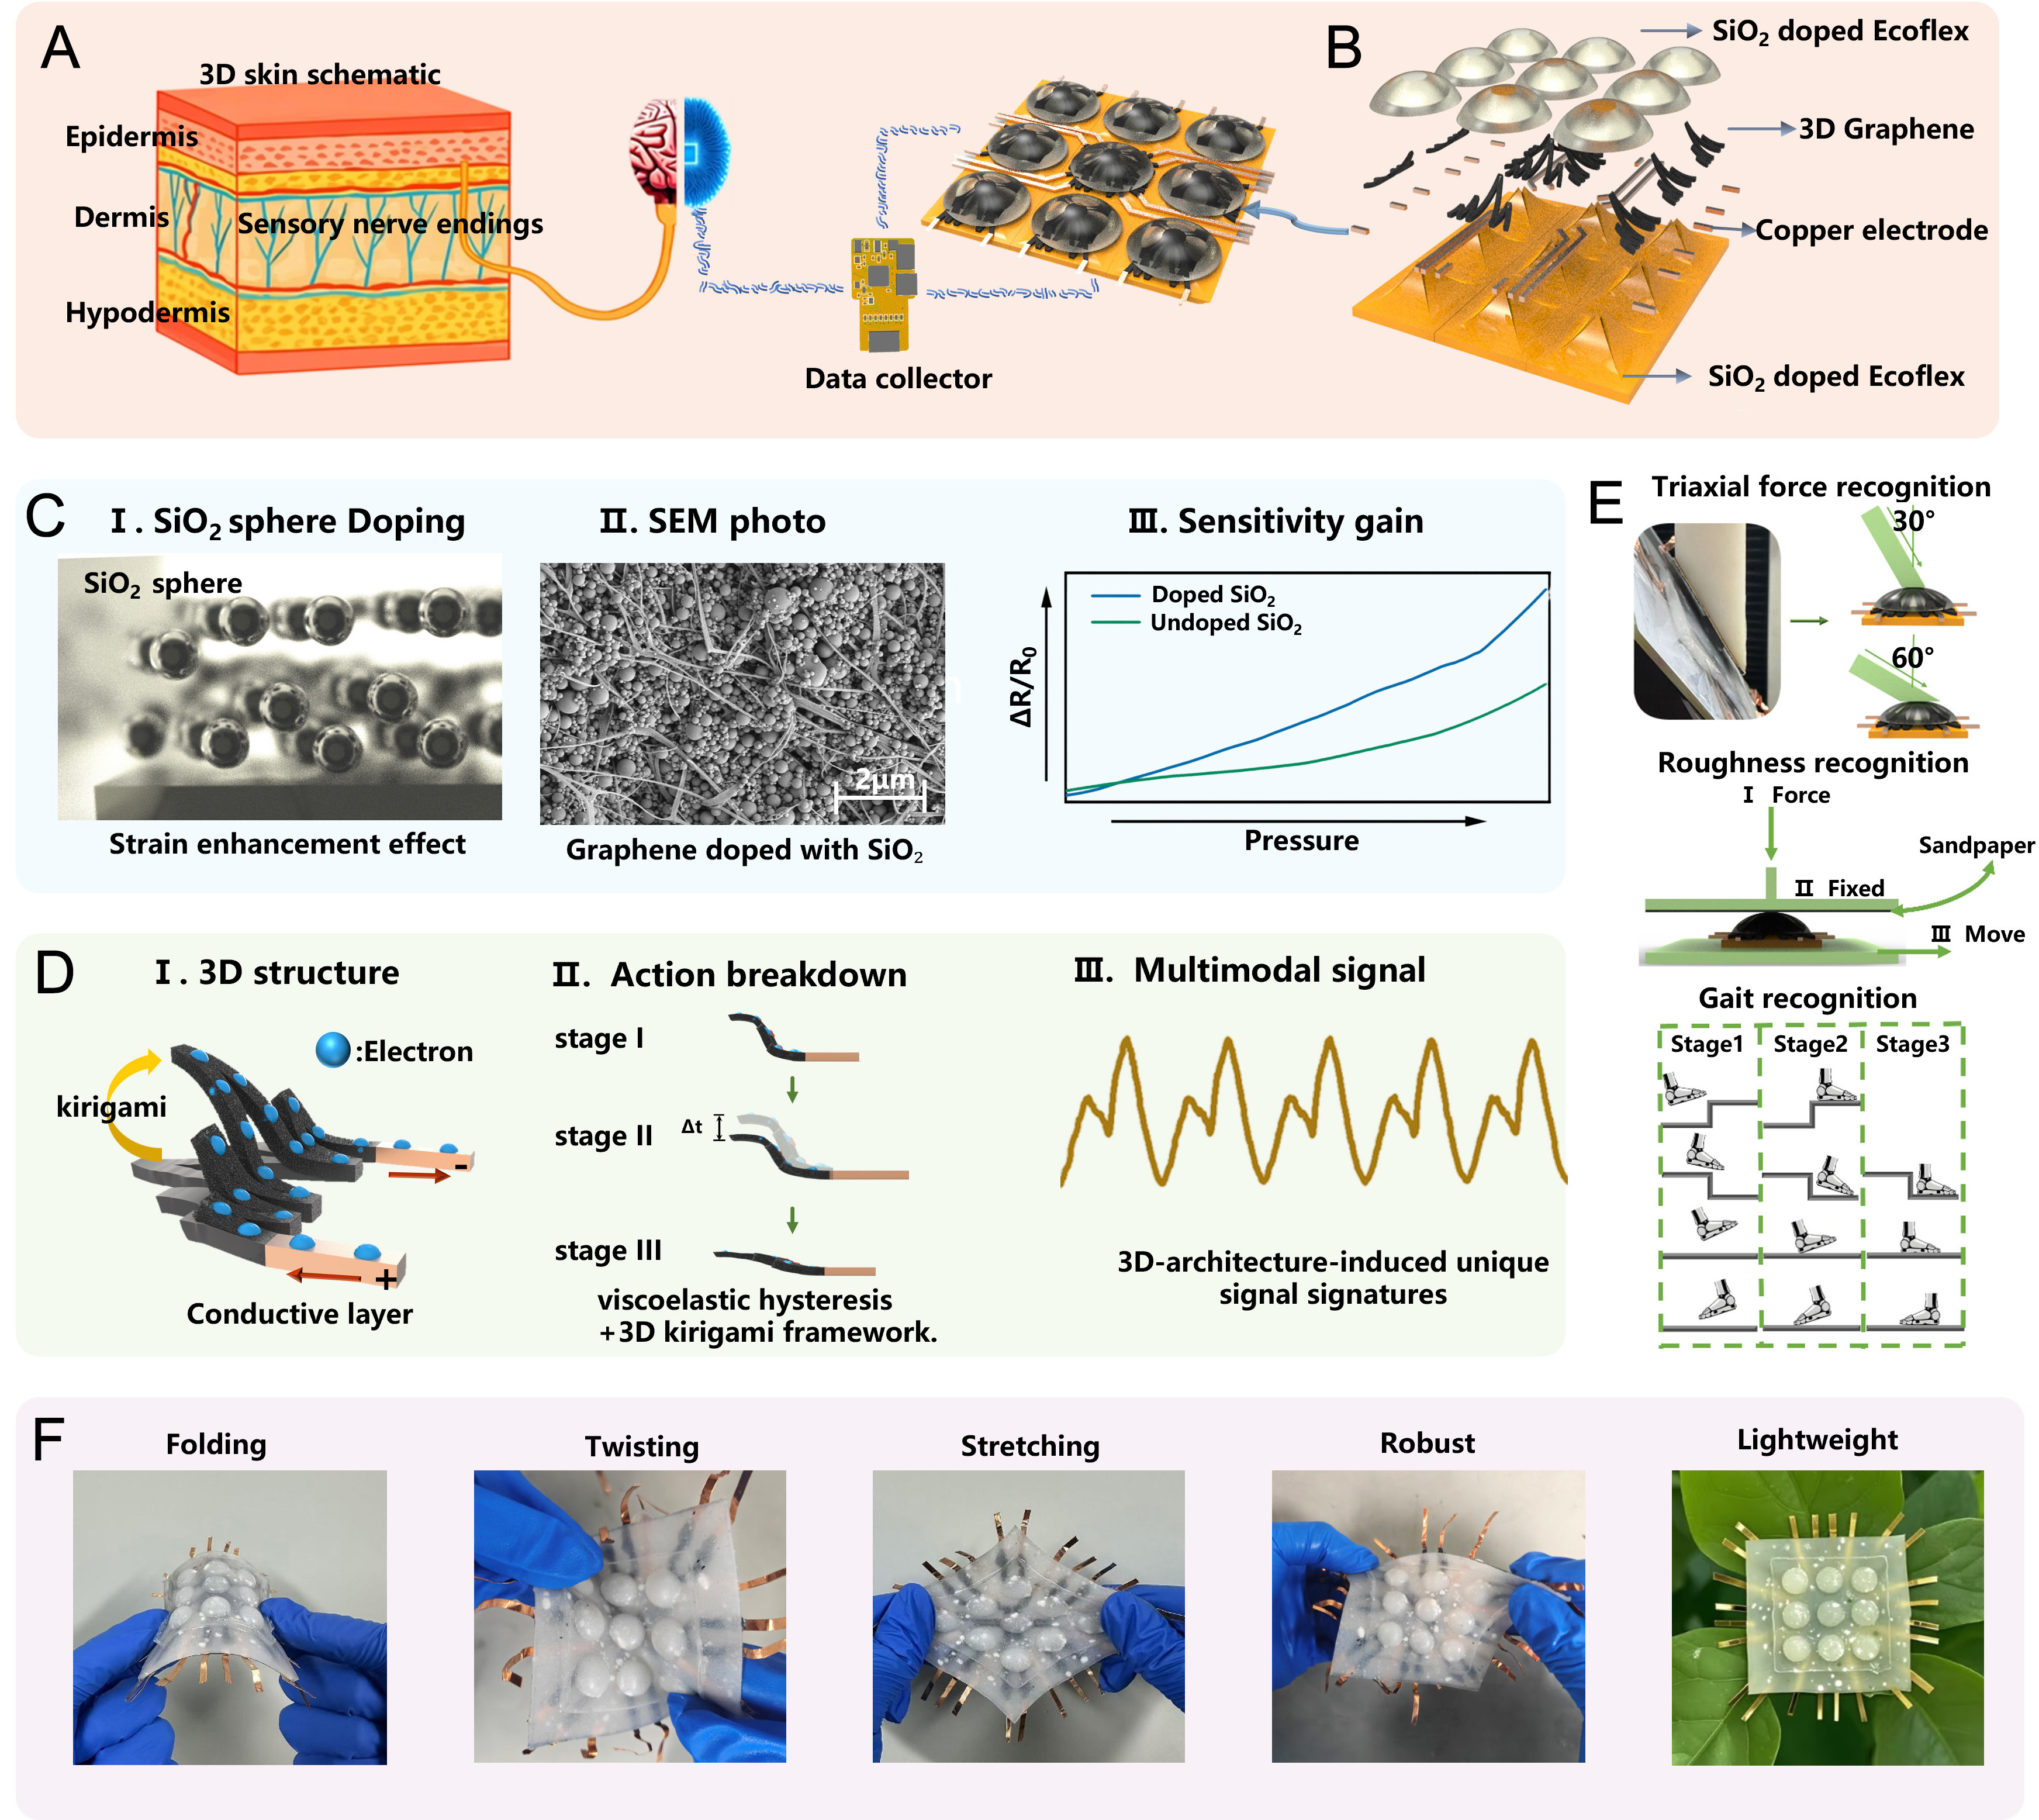
Figure 1. Design, sensing mechanism, and application overview of the skin-inspired flexible pressure sensor. (A) Schematic illustration of the sensory mechanism of human skin; (B) Structural schematic of the layered architecture of the proposed sensor; (C) Cross-sectional schematic of Ecoflex doped with SiO2, scanning electron microscopy (SEM) image of the SiO2-decorated graphene surface, and comparative resistance-pressure response curves of SiO2-doped and undoped materials; (D) Illustration of the sensor’s conductive mechanism, deformation response under different loading rates, and corresponding resistance variation waveform during high-speed loading; (E) Application schematics showing the sensor’s capability in multi-directional force recognition, surface roughness detection, and gait monitoring; (F) Photographs of the fabricated sensor exhibiting excellent flexibility and mechanical stability under bending and stretching conditions. Figure 1 and Figure 1F are photographs taken by the authors themselves during the experiments. 3D: Three-dimensional.
Figure 1E depicts the schematic illustration of the sensor in diverse application scenarios, including multi-directional force recognition, surface roughness detection, and gait monitoring. In multi-directional force recognition, the sensor precisely detects forces from varying orientations and converts them into analyzable electrical signals. In surface roughness detection, it perceives the influence of diverse surface textures on pressure fluctuations, enabling accurate discrimination of subtle surface variations. For gait recognition, the sensor continuously monitors step dynamics in real time, offering crucial support for motion tracking and health assessment. Finally, Figure 1F presents photographs of the fabricated sensor, demonstrating its remarkable flexibility and stable functionality under bending, twisting, stretching, and tearing conditions.
Fabrication and characterization
Figure 2 summarizes the fabrication procedure, microstructural features, and material characteristics of the kirigami-enabled tactile sensor. As illustrated in Figure 2A, Supplementary Figure 2 and Supplementary Movie 1, the device is fabricated through a sequential process involving the uniform mixing of Ecoflex with SiO2 particles to enhance mechanical stiffness and structural stability, followed by LIG patterning [Supplementary Figure 3] and kirigami-assisted transfer. The Kirigami process involves laser-cutting cracks into the LIG-attached PI using a laser cutter, followed by pressing the LIG-attached PI film onto a rigid mold with pyramid-shaped protrusions. This process lifts the PI film, creating a 3D structure, which mimics the Kirigami folding technique. The elastomeric precursor is cast into a predesigned mold, while the patterned LIG layer is subsequently integrated through a controlled demolding process, enabling the formation of a three-dimensional conductive network with out-of-plane deformation capability. This strategy allows planar LIG to be effectively transformed into a 3D architecture while maintaining electrical continuity.
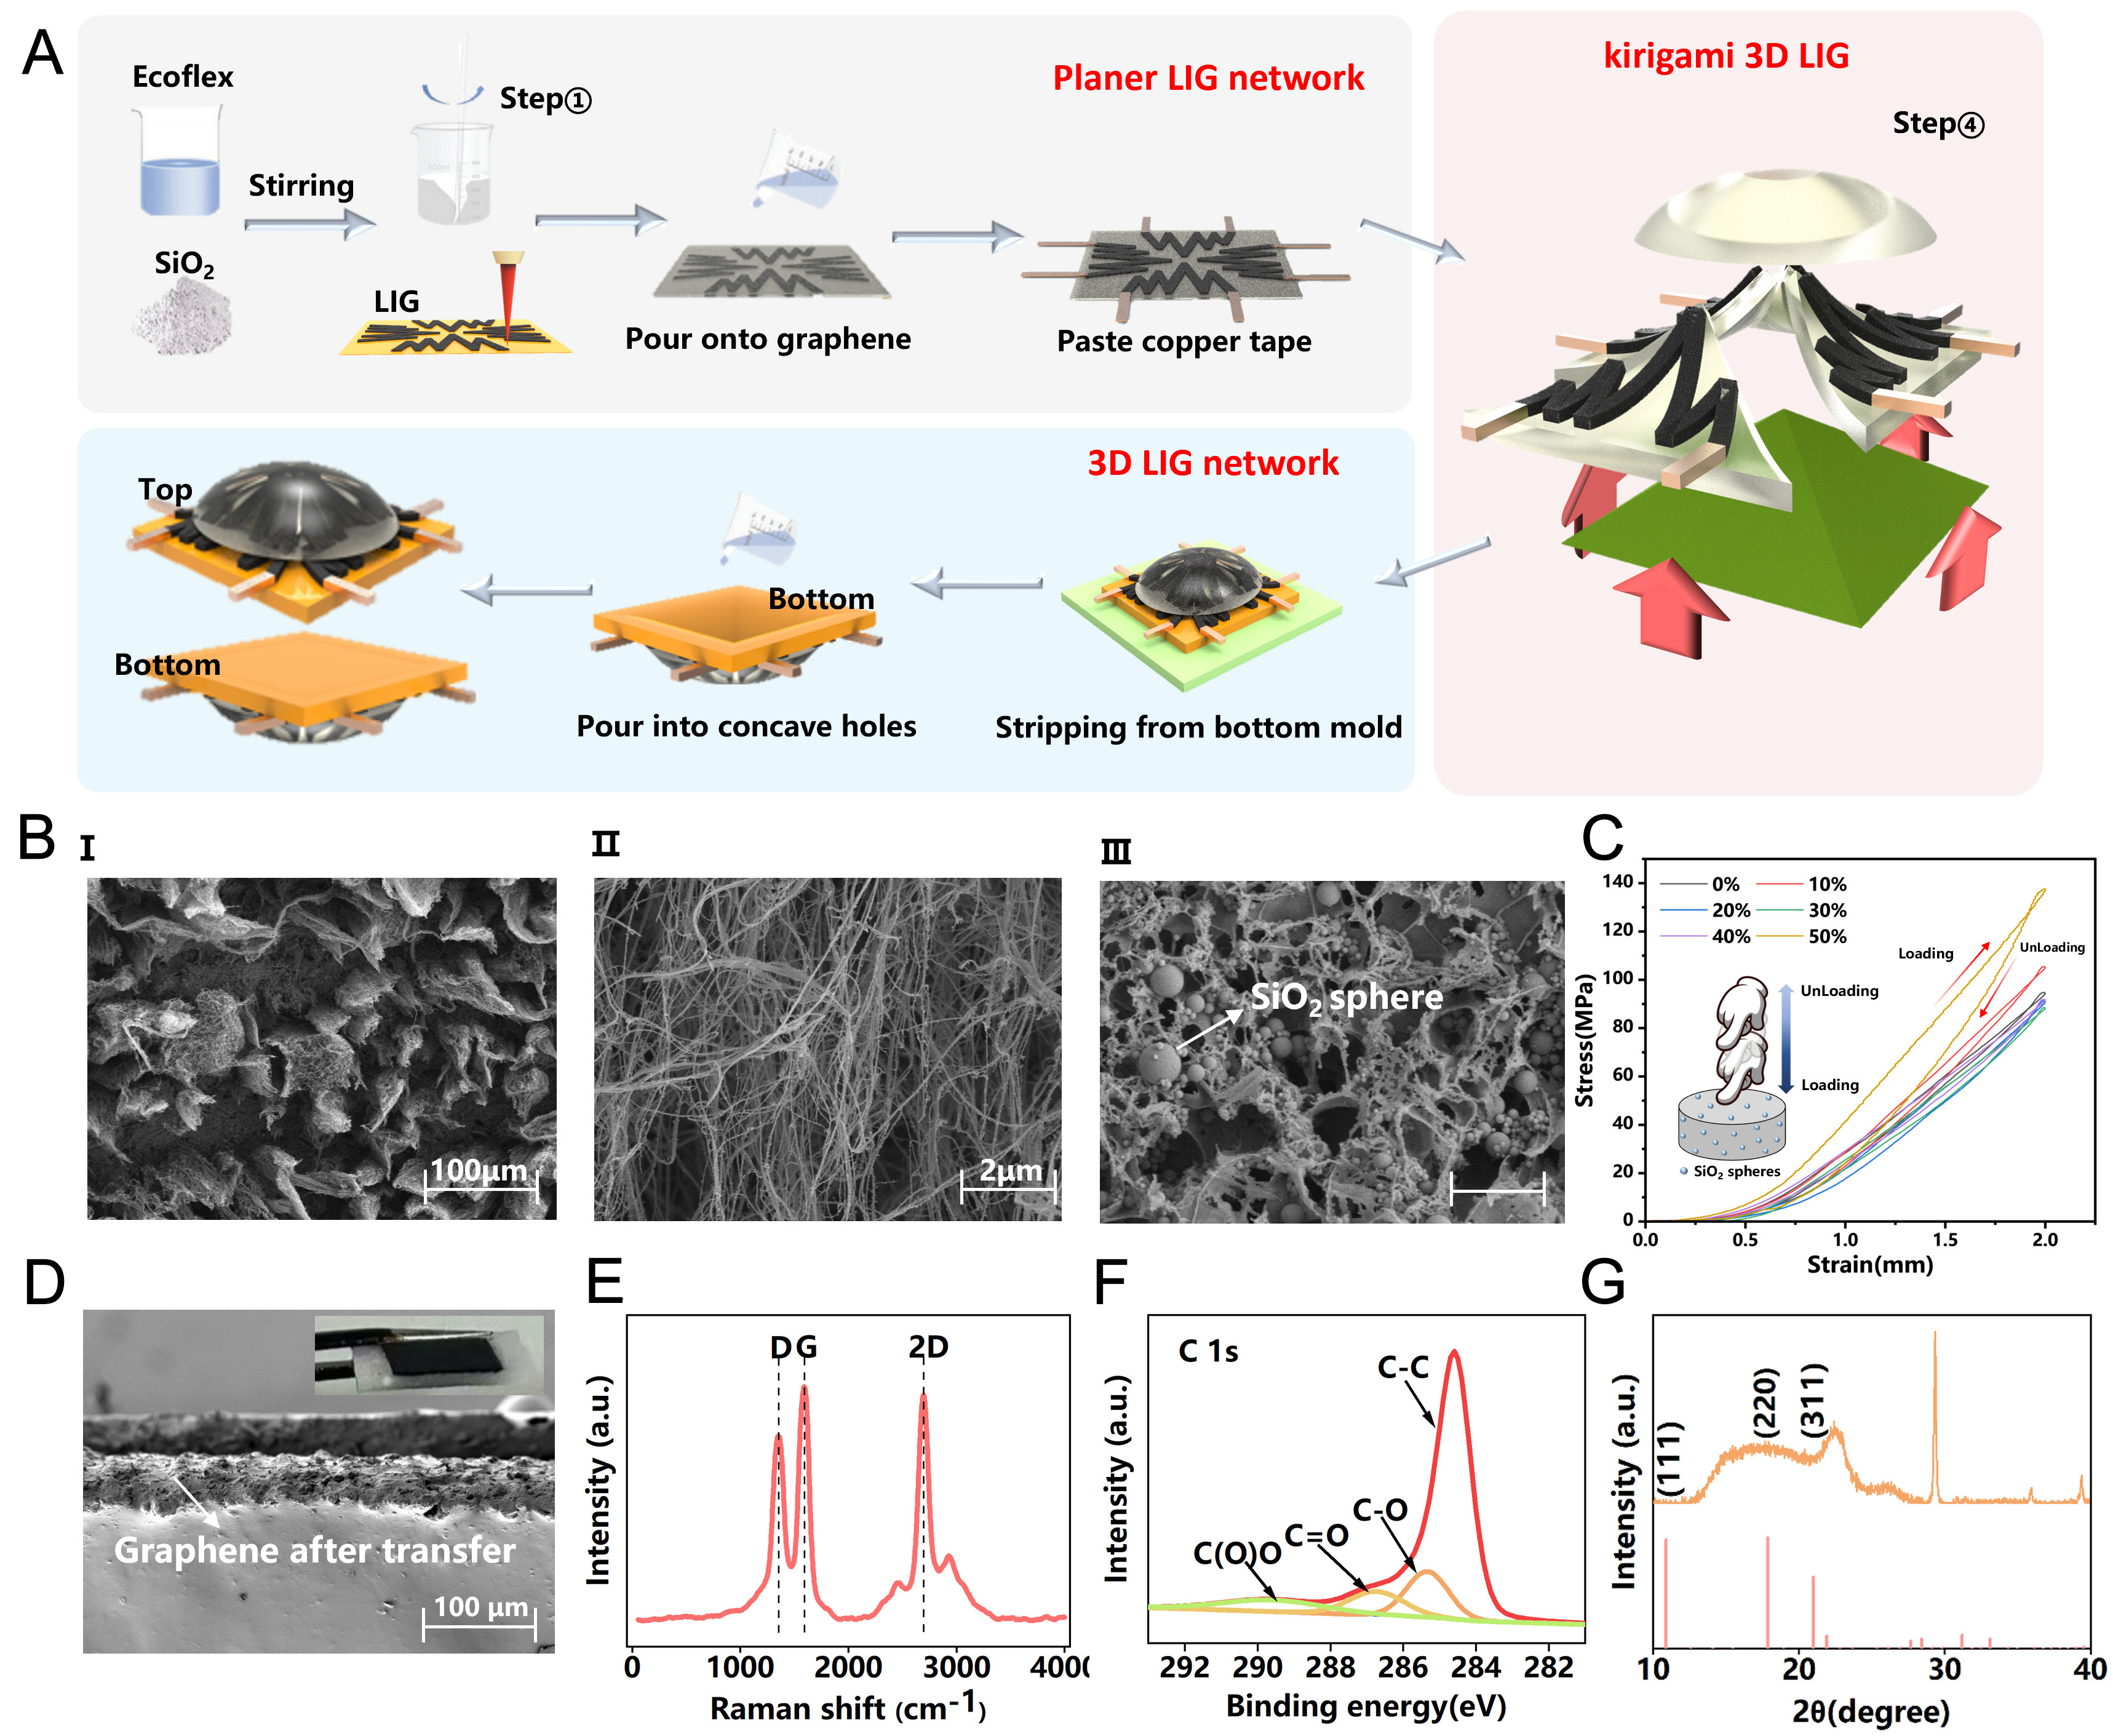
Figure 2. Fabrication process, microstructure, and material characterization of the skin-inspired flexible pressure sensor. (A) Schematic illustration of the sequential fabrication steps of the sensor; (B) SEM images of the laser-induced graphene (LIG) surface morphology, before and after deposition of SiO2 particles; (C) Optical image and SEM micrograph of graphene transferred onto the Ecoflex substrate; (D) The cross-sectional SEM image of the LIG interface after 3D transfer; (E) Raman spectrum of graphene, highlighting the characteristic D, G, and 2D peaks; (F) XPS spectrum of graphene, focusing on the C 1s peak and associated bonding states; (G) XRD pattern of graphene, showing diffraction peaks corresponding to its crystalline structure. 3D: Three-dimensional; 2D: two-dimensional; SEM: scanning electron microscopy; XPS: X-ray photoelectron spectroscopy; XRD:X-ray diffraction.
The microstructural features of the LIG network are shown in Figure 2B and Supplementary Figure 4, the SEM and Super-Depth Microscope (SDM) images reveal a porous, interconnected graphene framework with a high surface area, which is beneficial for stress concentration and charge transport. After SiO2 incorporation, nanoparticles are uniformly distributed within the graphene network, contributing to enhanced mechanical robustness and strain transfer efficiency. Based on the Einstein-Smallwood and Guth-Gold models, the introduction of SiO2 rigid fillers perturbs the matrix stress field and lead to a modulus enhancement. According to the Cox shear lag and Kelly-Tyson theories, the expansive interfacial area of these sub-micron particles ensures efficient stress transfer from the compliant Ecoflex to the high-modulus fillers. This reinforcement effectively optimizes local strain distribution and suppresses the non-linear viscoelasticity of the polymer, thereby improving the sensitivity and linearity of the LIG-based sensing network. Figure 2C presents the compressive stress-strain curves of the elastomer at various SiO2 filler concentrations (0 to 50 wt%), evaluated under a standardized strain level. Driven by the reinforcement effect, increasing the SiO2 content leads to a highly significant, monotonic enhancement in both the composite modulus (from 376.4 kPa to 707.6 kPa; Spearman’s ρ = 0.925, P = 4.04 × 10⁻⁸) and the peak stress (from 65.3 kPa to 124.7 kPa; Spearman’s ρ = 0.956, P = 5.95 × 10⁻¹⁰). Detailed statistical analyses validating these trends are provided in Supplementary Note 1 and Supplementary Figure 5. While the 50 wt% concentration offers the highest force transmission efficiency, excessive powder loading leads to structural brittleness, poor dispersion, and surface irregularities, as shown in Supplementary Figure 6. Simultaneously, the expanded hysteresis loops at higher concentrations confirm the filler’s role in tuning the viscoelastic dissipation of the composite matrix. The successful integration of the graphene layer into the elastomer matrix is further confirmed in inset of Figure 2D, where the transferred graphene maintains structural integrity and intimate interfacial contact with the Ecoflex substrate, ensuring reliable electrical conduction under deformation. Material characterization further verifies the quality of the fabricated sensing layer. The cross-sectional SEM image of the LIG interface after 3D transfer [Figure 2D and Supplementary Figure 7] reveals excellent structural integrity and uniformity. The surface remains smooth and well-preserved, with no noticeable delamination or distortion. The graphene network exhibits consistent distribution across the entire surface, ensuring reliable electrical performance and mechanical stability. This uniformity is crucial for maintaining the sensor’s high sensitivity and durability during operation. The Raman spectrum [Figure 2E] exhibits pronounced D and 2D bands, indicating the formation of conductive graphene with a moderate defect density suitable for piezoresistive sensing. X-ray Photoelectron Spectroscopy (XPS) analysis of the C 1s region [Figure 2F] reveals characteristic C-C, C-O, and C=O bonding configurations, confirming the presence of functional groups that contribute to interfacial adhesion and environmental stability. In addition, the X-ray Diffraction (XRD) pattern [Figure 2G] shows distinct diffraction peaks corresponding to graphitic crystal planes, demonstrating the preserved crystalline features of the graphene network after processing. Collectively, these results confirm that the proposed fabrication strategy enables the construction of a mechanically robust, electrically conductive, and structurally well-defined 3D graphene network, providing a solid foundation for subsequent electromechanical and sensing performance.
Sensing performance
The fundamental performance of the skin-inspired flexible pressure sensor is extensively characterized in Figure 3, covering key aspects such as pressure distribution, mechanical response, dynamic behavior, loading-rate dependence, and long-term stability. These evaluations validate the sensor’s performance decoupling for practical applications. Figure 3A presents the experimental setup, where the sensor is subjected to vertical normal pressure on a flat substrate, and the tested device is shown in Supplementary Figure 8. After that, Figures 3B show the COMSOL-simulated von Mises stress distributions for the undoped and SiO2-doped structures under identical loading conditions. Compared to the undoped structure, the SiO2-doped sensor exhibits improved stress concentration and enhanced stress transfer in the bottom region, highlighting the beneficial effect of SiO2 doping on the mechanical response of the composite material. The pressure-strain characteristics of both sensors, shown in Figure 3C, demonstrate that the SiO2-doped sensor has a higher elastic modulus, requiring more stress for the same strain, thus enhancing mechanical stiffness. Figure 3D compares the cyclic resistance responses of the doped and undoped SiO2 sensors under a pressure of 25 kPa. The SiO2-doped sensor shows a larger relative resistance change (ΔR/R0), indicating that SiO2 incorporation improves stress transmission efficiency between the conductive layers.
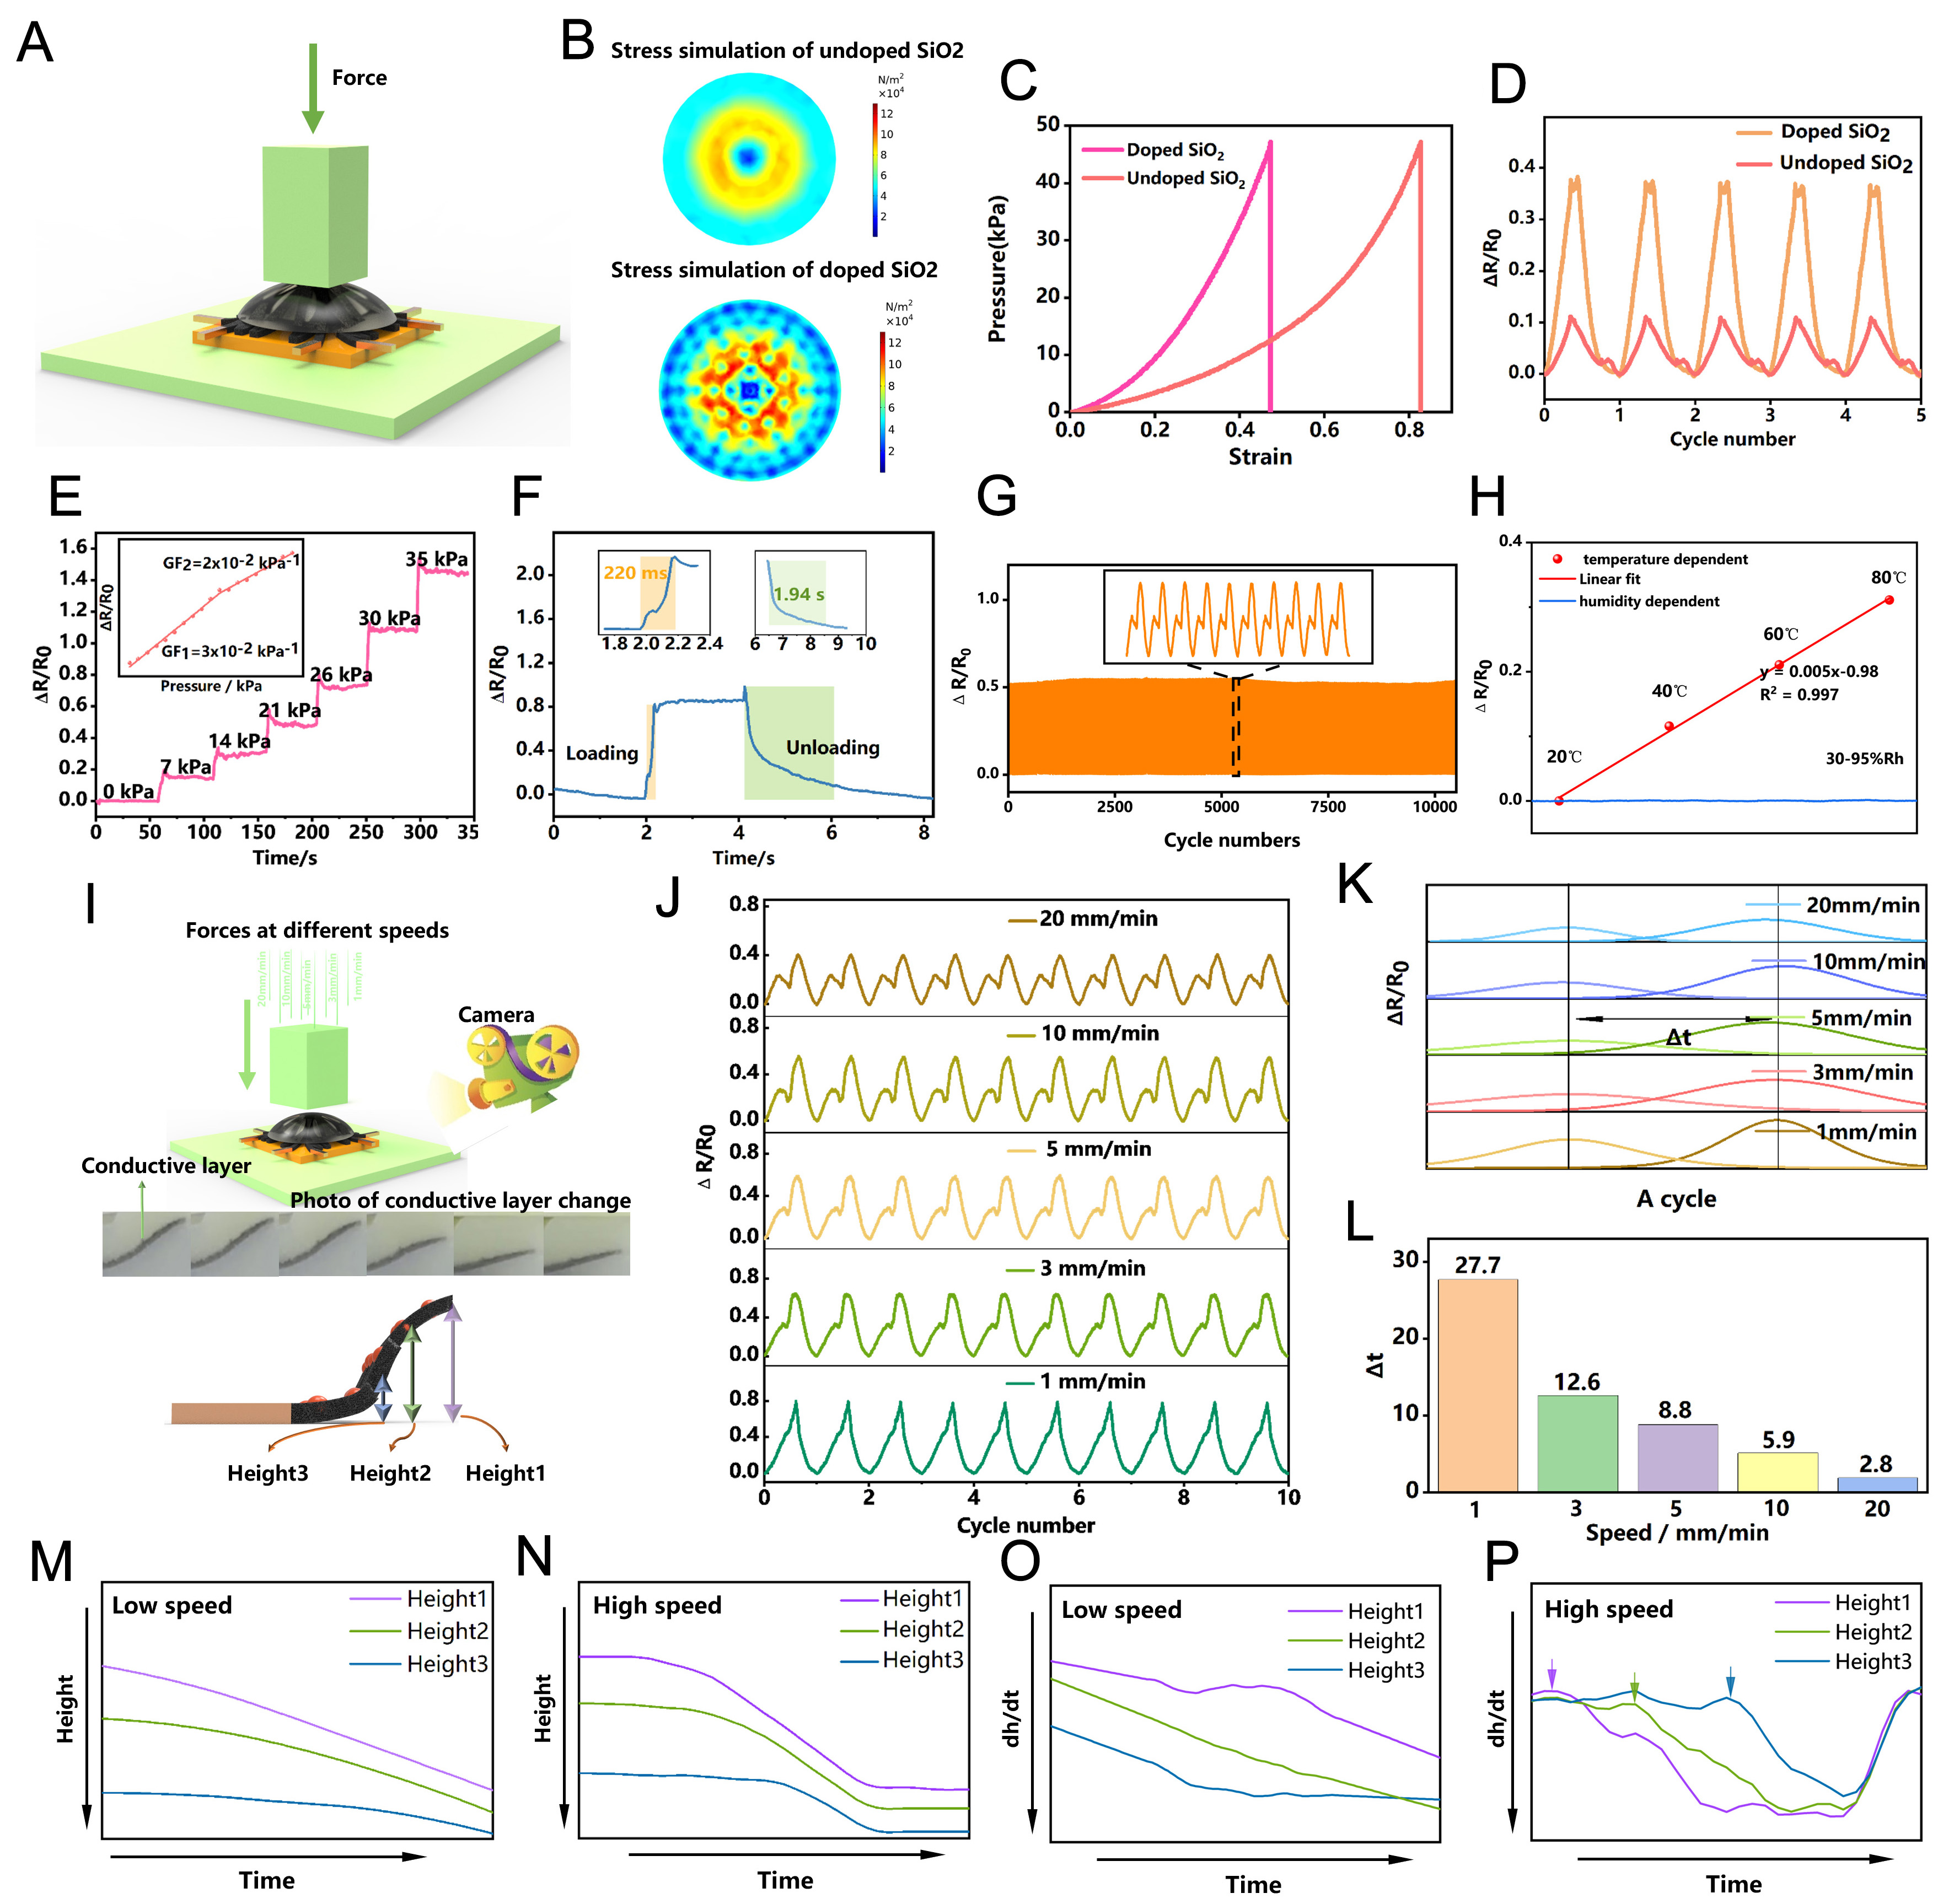
Figure 3. Fundamental performance characterization of the skin-inspired pressure sensor. (A) Schematic of the basic pressure-sensing test; (B) COMSOL-simulated stress distributions of undoped and SiO2-doped structures, highlighting the effect of doping on stress dispersion; (C) COMSOL-simulated pressure-strain characteristics of the sensors; (D) Comparison of cyclic resistance responses for doped SiO2; (E) Stepwise pressure response and sensitivity in different pressure regions; (F) Dynamic loading and unloading behavior, including response and recovery; (G) Cyclic durability under repeated loading; (H) Environmental stability characterization of the LIG-based tactile sensor; (I) Experimental setup at varying loading speeds with deformation images of the conductive layer and analysis of vertical stress transmission at three height positions (Height1-Height3); (J) Cyclic resistance responses at different speeds; (K and L) Peak separation in resistance curves, defined as Δt; (M and N) Time-resolved height variations under low-speed (m) and high-speed (n) loading; (O and P) First derivatives of height curves to analyze deformation propagation at different speeds. LIG: Laser-induced graphene.
In Figure 3E, the stepwise pressure response of the sensor in the 0-35 kPa range reveals good repeatability and stable signal output. The sensor achieves sensitivities of approximately 3 × 10⁻² kPa-1 in the 0-17 kPa range and 2 × 10⁻² kPa-1 in the 17-31 kPa range, confirming its tunable multi-regime pressure-sensing capability. The dynamic response, shown in Figure 3F, includes a loading response time of approximately 220 ms and a recovery time of 1.94 s, demonstrating the sensor’s quick response and good elastic resilience. Figure 3G demonstrates excellent long-term stability, as the sensor maintains stable output after 10000 loading-unloading cycles at 20 kPa, with no significant performance degradation. To further validate the mechanical robustness of the sensing architecture, cross-sectional photo analysis was conducted following the 10,000-cycle durability test [Supplementary Figure 9]. The images reveal that the LIG network remains securely anchored within the Ecoflex matrix, with the LIG/substrate interface maintaining seamless structural integrity and no observable delamination, thereby corroborating the high reversibility and baseline stability of the device. To evaluate environmental robustness more, the sensor’s response to temperature and humidity was characterized in Figure 3H. The device exhibits a Positive Temperature Coefficient (PTC), where the relative resistance (ΔR/R0) increases linearly with temperature from 20 °C to 80 °C. This behavior might be attributed to the mismatched thermal expansion between the LIG network and the substrate. Notably, the temperature dependence shows an exceptional linearity of R2 = 0.997, which facilitates straightforward real-time compensation using a linear correction factor. Furthermore, the sensor demonstrates excellent stability across a wide humidity range (30% to 95% RH). The relative resistance change remains negligible (blue line in Figure 3H), confirming that the encapsulation effectively isolates the LIG conductive network from moisture interference. This dual-stability confirms the sensor’s reliability for operation in complex, varying environments.
Figure 3I illustrates the experimental setup under different loading speeds [Supplementary Figure 10], with deformation images of the conductive layer taken at three representative height positions (Height1-Height3) within the LIG layer. The dynamic signal profile [Figure 3J] reveals a distinct rate-dependent “dual-peak” feature. While the response remains almost single-peak at 1 mm/min, higher loading rates (up to
Multi-directional force testing
The multi-directional force sensing performance of the skin-inspired pressure sensor is illustrated in Figure 4, including its directional response characteristics. Figure 4A presents the physical appearance and schematic diagram of the skin-inspired pressure sensor. During testing, the sensor was mounted on a platform tilted at 30° and 60° and subjected to vertical loading to simulate multi-directional forces. Supplementary Figure 14 shows the deformation of the graphene under inclined force pressure, with the black areas representing the graphene material. This image highlights the material’s response to directional stress, providing valuable insight into its mechanical behavior under non-vertical loading conditions. The different platform inclinations emulate external forces applied from varying directions. The sensor contains four independent sensing channels (ch1-ch4), as shown in the schematic, each used to monitor resistance variation under applied force. Table 1 summarizes the correspondence between the 16 directional angles and the associated sensor channels.
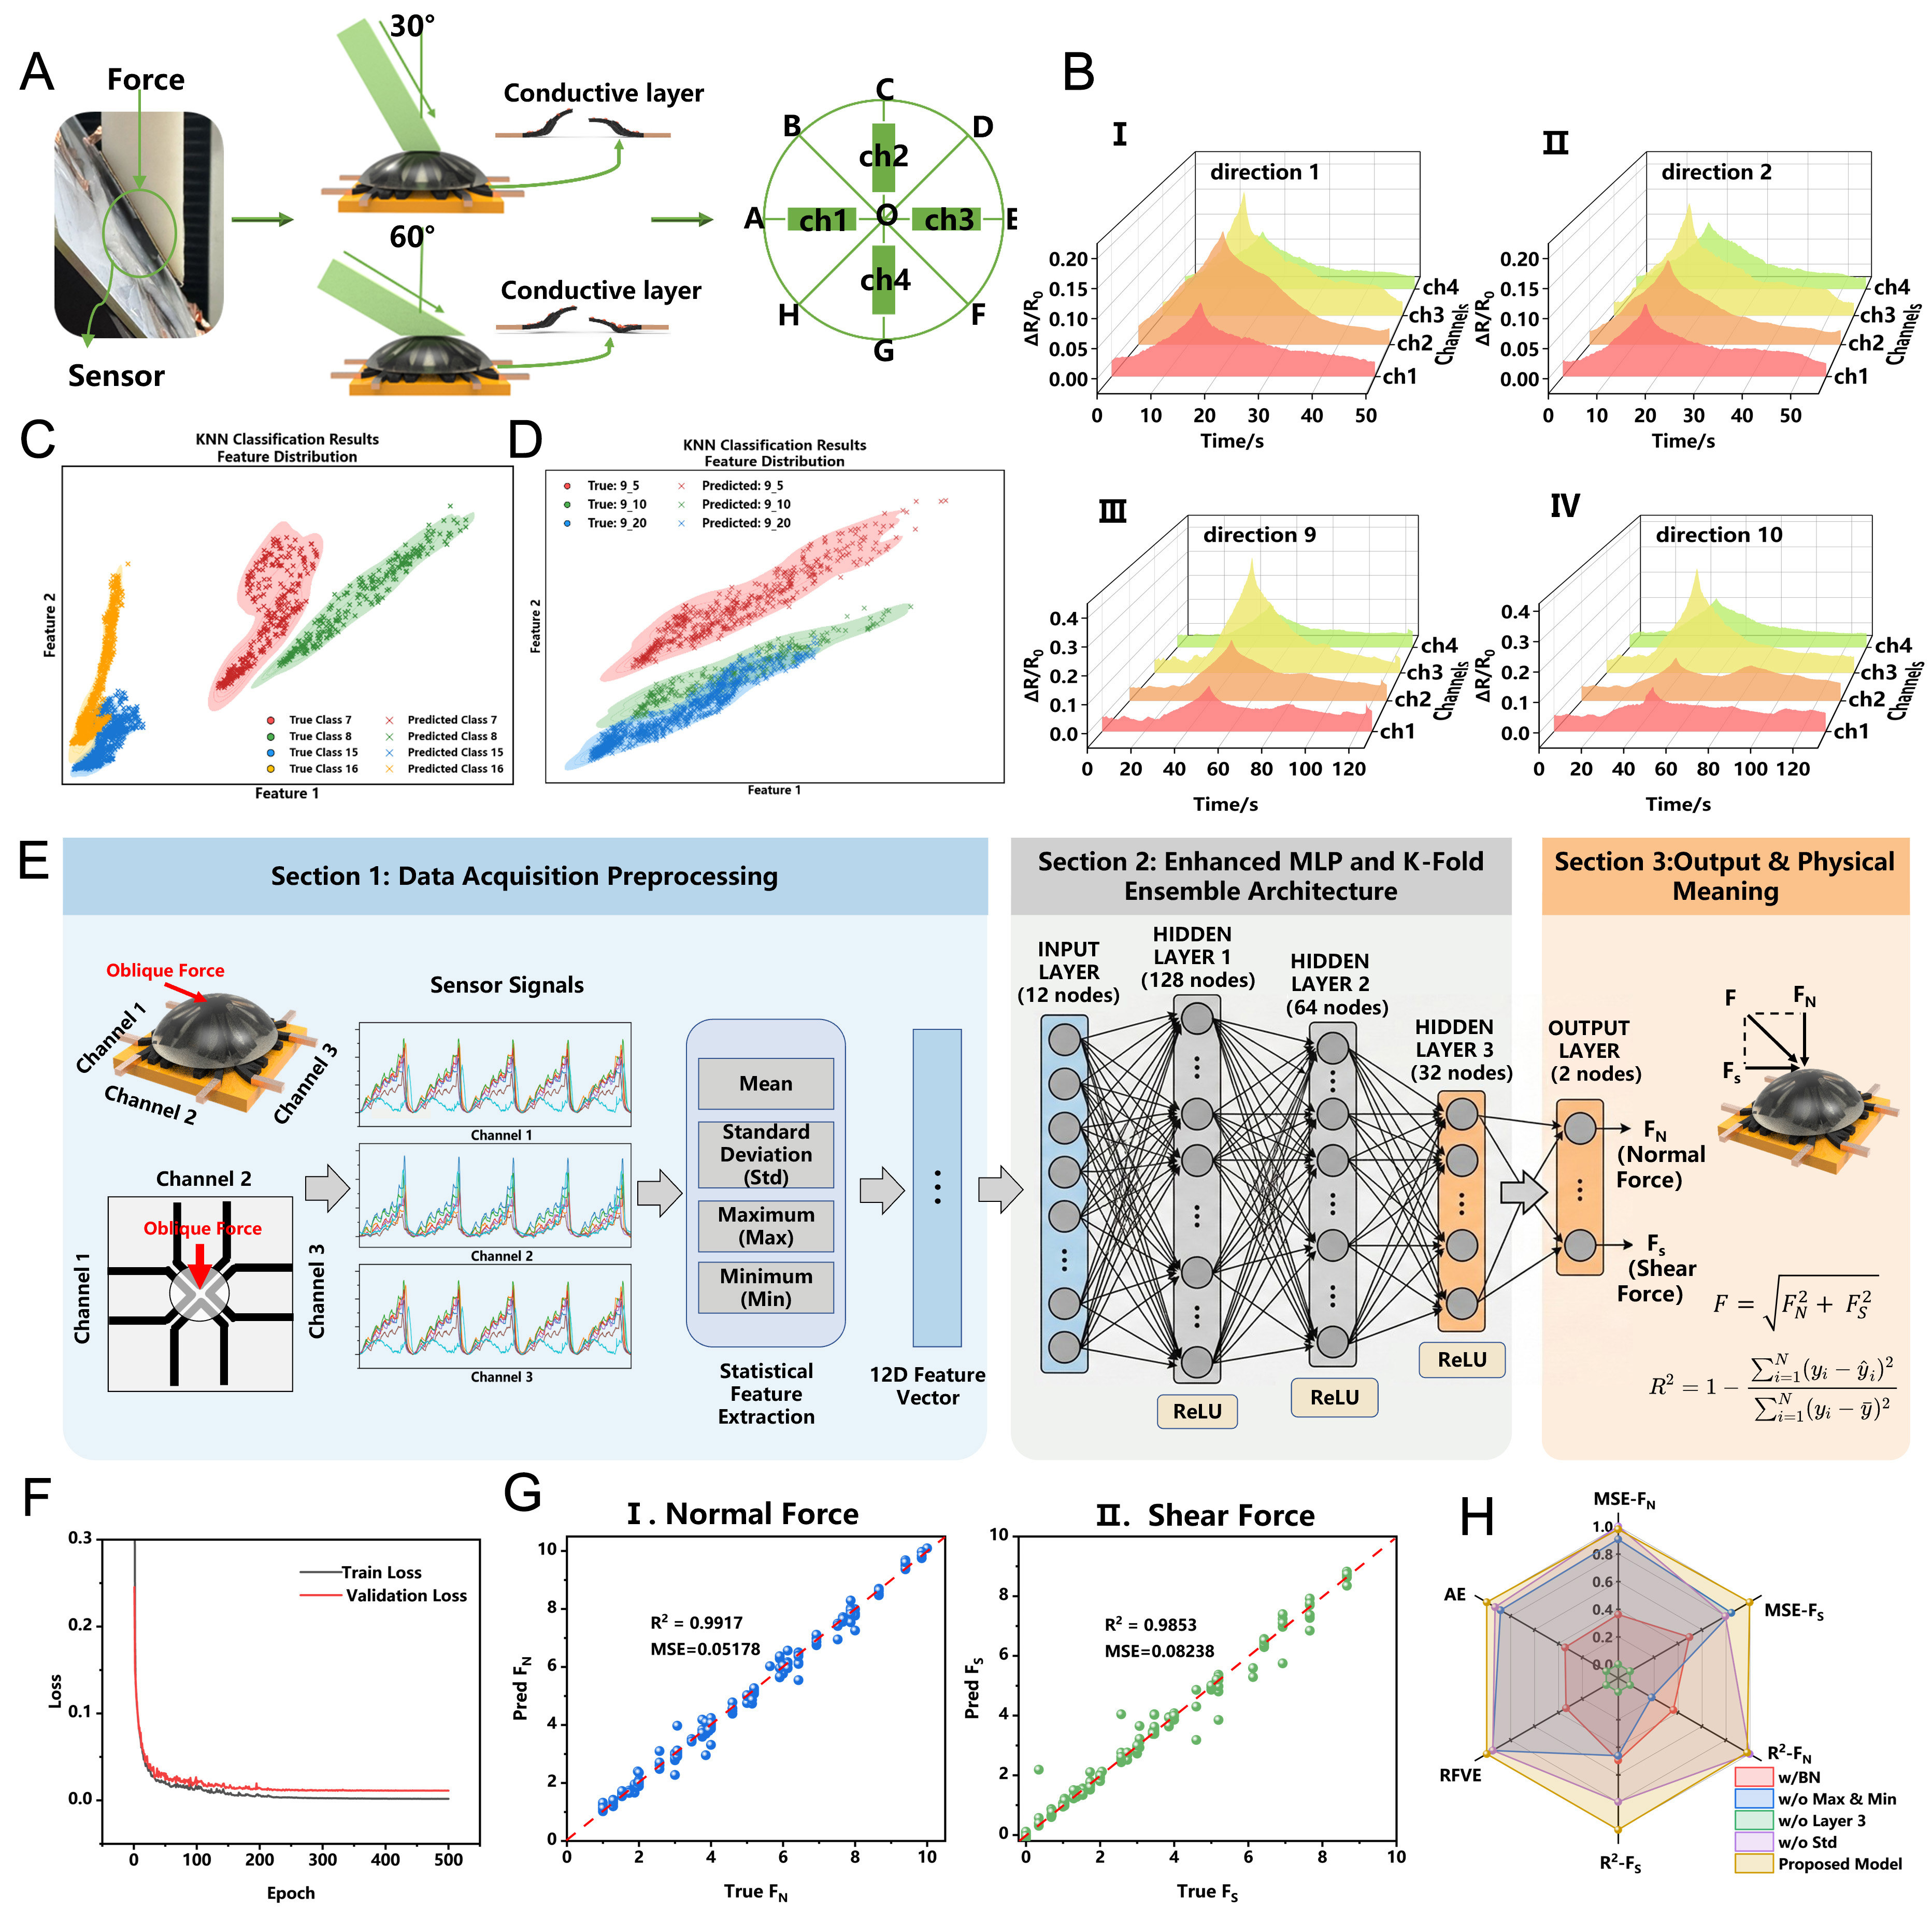
Figure 4. Characterization of multi-directional force perception and decoupling performance. (A) Experimental configuration and schematic illustration of the multi-directional force testing platform; (B) Representative relative resistance response (ΔR/R0) across four sensing channels under typical force vectors (Directions 1, 2, 9, and 10); (C) KNN classification results and feature distribution of the sensor under four representative force directions; (D) Feature distribution for Direction 9 across different indentation speeds (5, 10, and 20 mm/min); (E) Schematic workflow of the force decoupling framework for the simultaneous extraction of normal and shear components; (F and G) Decoupling performance demonstrating the predicted versus measured normal force (Fz) and shear force (Fx, Fy) components; (H) Statistical performance metrics and evaluation parameters (e.g., R2 and RMSE) of the force-decoupling algorithm. Figure 4A was photographs taken by the authors themselves during the experiments. KNN: K-nearest neighbors; MSE: mean squared error; RMSE: root mean square error; MLP: multilayer perceptron.
Correspondence between 16 directional angles and sensor channels
| Direction No. | Direction details | Direction No. | Direction details |
| Direction1 | 30° A - > O | Direction2 | 30° B - > O |
| Direction3 | 30° C - > O | Direction4 | 30° D - > O |
| Direction5 | 30° E - > O | Direction6 | 30° F - > O |
| Direction7 | 30° G - > O | Direction8 | 30° H - > O |
| Direction9 | 60° A - > O | Direction10 | 60° B - > O |
| Direction11 | 60° C - > O | Direction12 | 60° D - > O |
| Direction13 | 60° E - > O | Direction14 | 60° F - > O |
| Direction15 | 60° G - > O | Direction16 | 60° H - > O |
For instance, in direction 1, the applied force is tilted 30° from the vertical, with the horizontal component directed from A to O; direction 2 represents a 30° tilt with the horizontal force component oriented from B to O. Similarly, directions 9 and 10 correspond to 60° tilts, with horizontal components directed from A to O and B to O, respectively. Based on the structural symmetry and mechanical properties of the sensor, the two directional groups (AO-CO-EO-GO and BO-DO-FO-HO) exhibit mirror symmetry. When a force is applied along the AO direction, stress is primarily concentrated near point E, resulting in a pronounced resistance change in channel ch3. Owing to the structural symmetry, forces applied along the CO, EO, and GO directions yield equivalent effects on the resistance network, producing similar resistance variation patterns. Consequently, once the force in the AO direction is identified, those in CO, EO, and GO can also be inferred, and the same applies to the BO-DO-FO-HO group. Comparing direction 1 and direction 9 (both corresponding to AO), the 60° tilt results in higher stress concentration at point E, thereby inducing a larger resistance variation in ch3. To evaluate the classification performance rigorously, a balanced dataset was constructed comprising 16 directional categories. Each category contained 50 experimental trials, resulting in a total of 800 samples. The raw multi-channel resistance signals were used as input features. The sensor’s robust multi-directional force recognition capability is demonstrated by high classification accuracies across three machine-learning algorithms - BP (94.34%), SVM (96.85%), and KNN (99.46%) - confirming that the structural encoding of the LIG-based device provides highly discriminative features for directional analysis.
Figure 4C presents resistance variation (ΔR/R0) curves for directions 1, 2, 9, and 10, highlighting the effect of directional loading on the sensor’s resistance response. For direction 1, the resistance change rates of ch3 and ch4 are 20.7% and 8.7%, respectively [Figure 4B-I]. For direction 2, the change rates for ch3 and ch4 are 18.6% and 10.6% [Figure 4B-II]. Compared with direction 1, ch3 shows a slightly reduced resistance variation in direction 2, while ch4 shows an increase, indicating a shift in stress concentration from point E to point F. In directions 9 and 10 [Figure 4B-III-IV], the resistance change rates reach 39.9% and 12.8% for direction 9, and 33.6% and 14.1% for direction 10, confirming that these two directions can be effectively distinguished. Compared with direction 1, direction 9 exhibits a greater resistance change in ch3, signifying stronger stress concentration at point E.
The discriminative ability of the structural-electrical encoding was visualized through feature distribution plots [Figure 4C and D]. Figure 4C illustrates that force vectors from different orientations (e.g., Classes 7, 8, 15, and 16) occupy distinct, non-overlapping regions in the feature space, substantiating the high directional resolution provided by the asymmetric deformation of the 3D kirigami architecture. True labels are represented as semi-transparent shaded regions of different colors generated by kernel density estimation, indicating the distribution density and range of each category in the two-dimensional feature space. Predicted results are shown as colored “×” symbols scattered across the plots. Furthermore, Figure 4D evaluates the classification performance under varying dynamic stimuli for a single orientation (Direction 9). The classification labels follow the format “direction_speed”; for instance, label 9_5 denotes direction 9 at
To accurately perceive complex external three-dimensional force stimuli, this study proposes a force decoupling algorithm framework based on an Enhanced Multilayer Perceptron (Enhanced MLP) (Figure 4E and Supplementary Note 2 for detailed architectural and feature engineering descriptions). This framework can precisely decouple the oblique force applied to the sensor into normal force (FN) and shear force (Fs). The overall force decoupling workflow consists of three core stages: data acquisition and preprocessing, model construction and training, and physical quantity output and evaluation. When the sensor is subjected to a force, the internal channels generate corresponding electrical signal changes. To improve the model’s noise resistance and generalization capability, instead of directly inputting the raw time-series signals into the network, statistical feature extraction was performed. The system sampled the response signals from three effective channels (Channel_1, Channel_2, Channel_3), calculating the mean, standard deviation (Std), maximum (Max), and minimum (Min) for the signal segments of each channel. By extracting a 12-dimensional feature vector, including mean, variance, and peak-to-peak fluctuations, from three sensing channels, we preserved critical spatial and dynamic temporal characteristics [Figure 4E-I]. Following feature extraction, an Enhanced MLP model with a four-layer architecture (1 input layer, 3 hidden layers, and 1 output layer) was designed for the nonlinear force decoupling mapping. The input layer contains 12 nodes corresponding to the 12D input features. This is followed by three hidden layers with 128, 64, and 32 nodes respectively, all utilizing ReLU as the activation function. Finally, an output layer with 2 nodes yields the prediction results. To ensure the model’s robustness and maximize data utilization, a 5-Fold Cross-Validation (5-Fold CV) strategy was employed during the training process. The model used the Adam optimizer for parameter updates with an initial learning rate of 0.003, combined with a ReduceLROnPlateau learning rate decay strategy based on validation set loss [Figure 4E-II]. The model’s final outputs correspond to the normal force (FN) and shear force (FS) experienced by the sensor. Using these two orthogonal components, the magnitude of the actual resultant force can be reconstructed using the formula [Figure 4E-III]:
To comprehensively verify the effectiveness of the proposed Enhanced MLP in the force decoupling task, a systematic visual analysis and quantitative evaluation of the model’s training process and final prediction accuracy were conducted. The convergence characteristics of the decoupling algorithm are presented in Figure 4F. Both training and validation losses decreased rapidly and stabilized at a low level, demonstrating the model’s efficient learning of the nonlinear mapping between sensor signals and multi-axial forces. The minimal divergence between the two curves, supported by the ReduceLROnPlateau strategy and 5-fold cross-validation, confirms the model’s robust convergence and the absence of overfitting. To intuitively demonstrate the model’s predictive performance for each orthogonal force component, scatter plots of the true versus predicted values were generated [Figure 4G]. As shown, the predicted scatter points compactly converge around the ideal red diagonal line. Specifically, the R2 value for the normal force reached 0.9917, with an MSE as low as 0.05178 N2; meanwhile, the shear force, which has been extremely difficult to decouple due to nonlinear deformation, also achieved a high R2 of 0.9853, with its MSE suppressed to 0.08238 N2. These excellent R2 scores demonstrate that this architecture can accurately isolate and quantify individual force components under complex loading conditions. To further compare the comprehensive performance differences across various model architectures, a radar chart was introduced for multi-dimensional visual comparison [Figure 4H]. The vertices of the radar chart correspond to different error evaluation metrics, such as single-component errors, resultant force vector error (RFVE), and direction angle error (AE). The error evaluation metrics were processed using Min-Max normalization and reversed Min-Max normalization. For metrics requiring inverse mapping to display relative performance, we adopted the following reversed normalization formula:
where x represents the raw error evaluation value of the current model, xmin and xmax represent the minimum and maximum values of that specific metric among all compared models. Through this reverse mapping operation, the raw error data can be flexibly standardized into the [0,1] interval; smaller original error values indicating better performance are mapped to the extreme closer to 1. Ultimately, the normalized radar chart clearly displays the comprehensive capabilities of each model. The area enclosed by the proposed Enhanced MLP model in the chart visually proves that it achieved optimal levels across multiple error metrics, demonstrating outstanding comprehensive decoupling performance and extremely high robustness.
Application
The surface roughness recognition experiment using the skin-inspired pressure sensor is presented in Figure 5, aimed at detecting resistance changes as the sensor slides over surfaces of different roughness and achieving precise classification of surface textures. This experiment not only demonstrates the sensor’s response on various roughness levels but also employs a KNN algorithm to classify those differences, thereby validating the sensor’s recognition capability in practical applications. Figure 5A shows the basic setup and testing procedure. First, a fixture is mounted on a tensile tester, and sandpapers of different grit sizes are affixed to the fixture’s underside. The sensor is then secured on a sliding rail. The tensile tester lowers the fixture until a pressure of 25 kPa is applied to the sensor. Next, the sliding rail drives the sensor to move across each sandpaper surface, ensuring stable contact so that resistance changes can be recorded. During sliding, resistance data are collected in real time to analyze and identify how surface roughness affects the sensor’s electrical response. Eight sandpaper grades were chosen for this test: 60, 100, 150, 180, 320, 600, 800, and 1500 grit. Data collection involved 20 independent sliding trials for each of the eight roughness levels, generating a balanced dataset of 160 samples to prevent class imbalance bias during training. Figure 5B shows the classification results of these eight surfaces using the KNN algorithm. The confusion matrix reveals that the KNN achieved an overall accuracy of 95.34%, indicating that the combination of the skin-inspired pressure sensor and KNN can effectively distinguish between different surface roughness levels (details in Supplementary Figure 17). Figure 5C depicts the resistance change curves (ΔR/R0) recorded as the sensor slid over each of the eight surfaces. These curves illustrate the temporal variation in resistance when the sensor contacts different textures. It can be observed that coarser surfaces induce larger resistance changes, while smoother surfaces cause smaller fluctuations. For example, on the 60-grit surface, the maximum resistance change reached 12.4%, whereas on the 1500-grit surface it was only 2.18%. This behavior arises because rougher surfaces generate higher frictional forces on the sensor - producing greater stress and thus larger resistance shifts - whereas smoother surfaces exert lower friction and smaller resistance variations. Each inset plot highlights the peak resistance change for a given grit size, providing an intuitive comparison of how surface roughness influences the sensor’s electrical response.
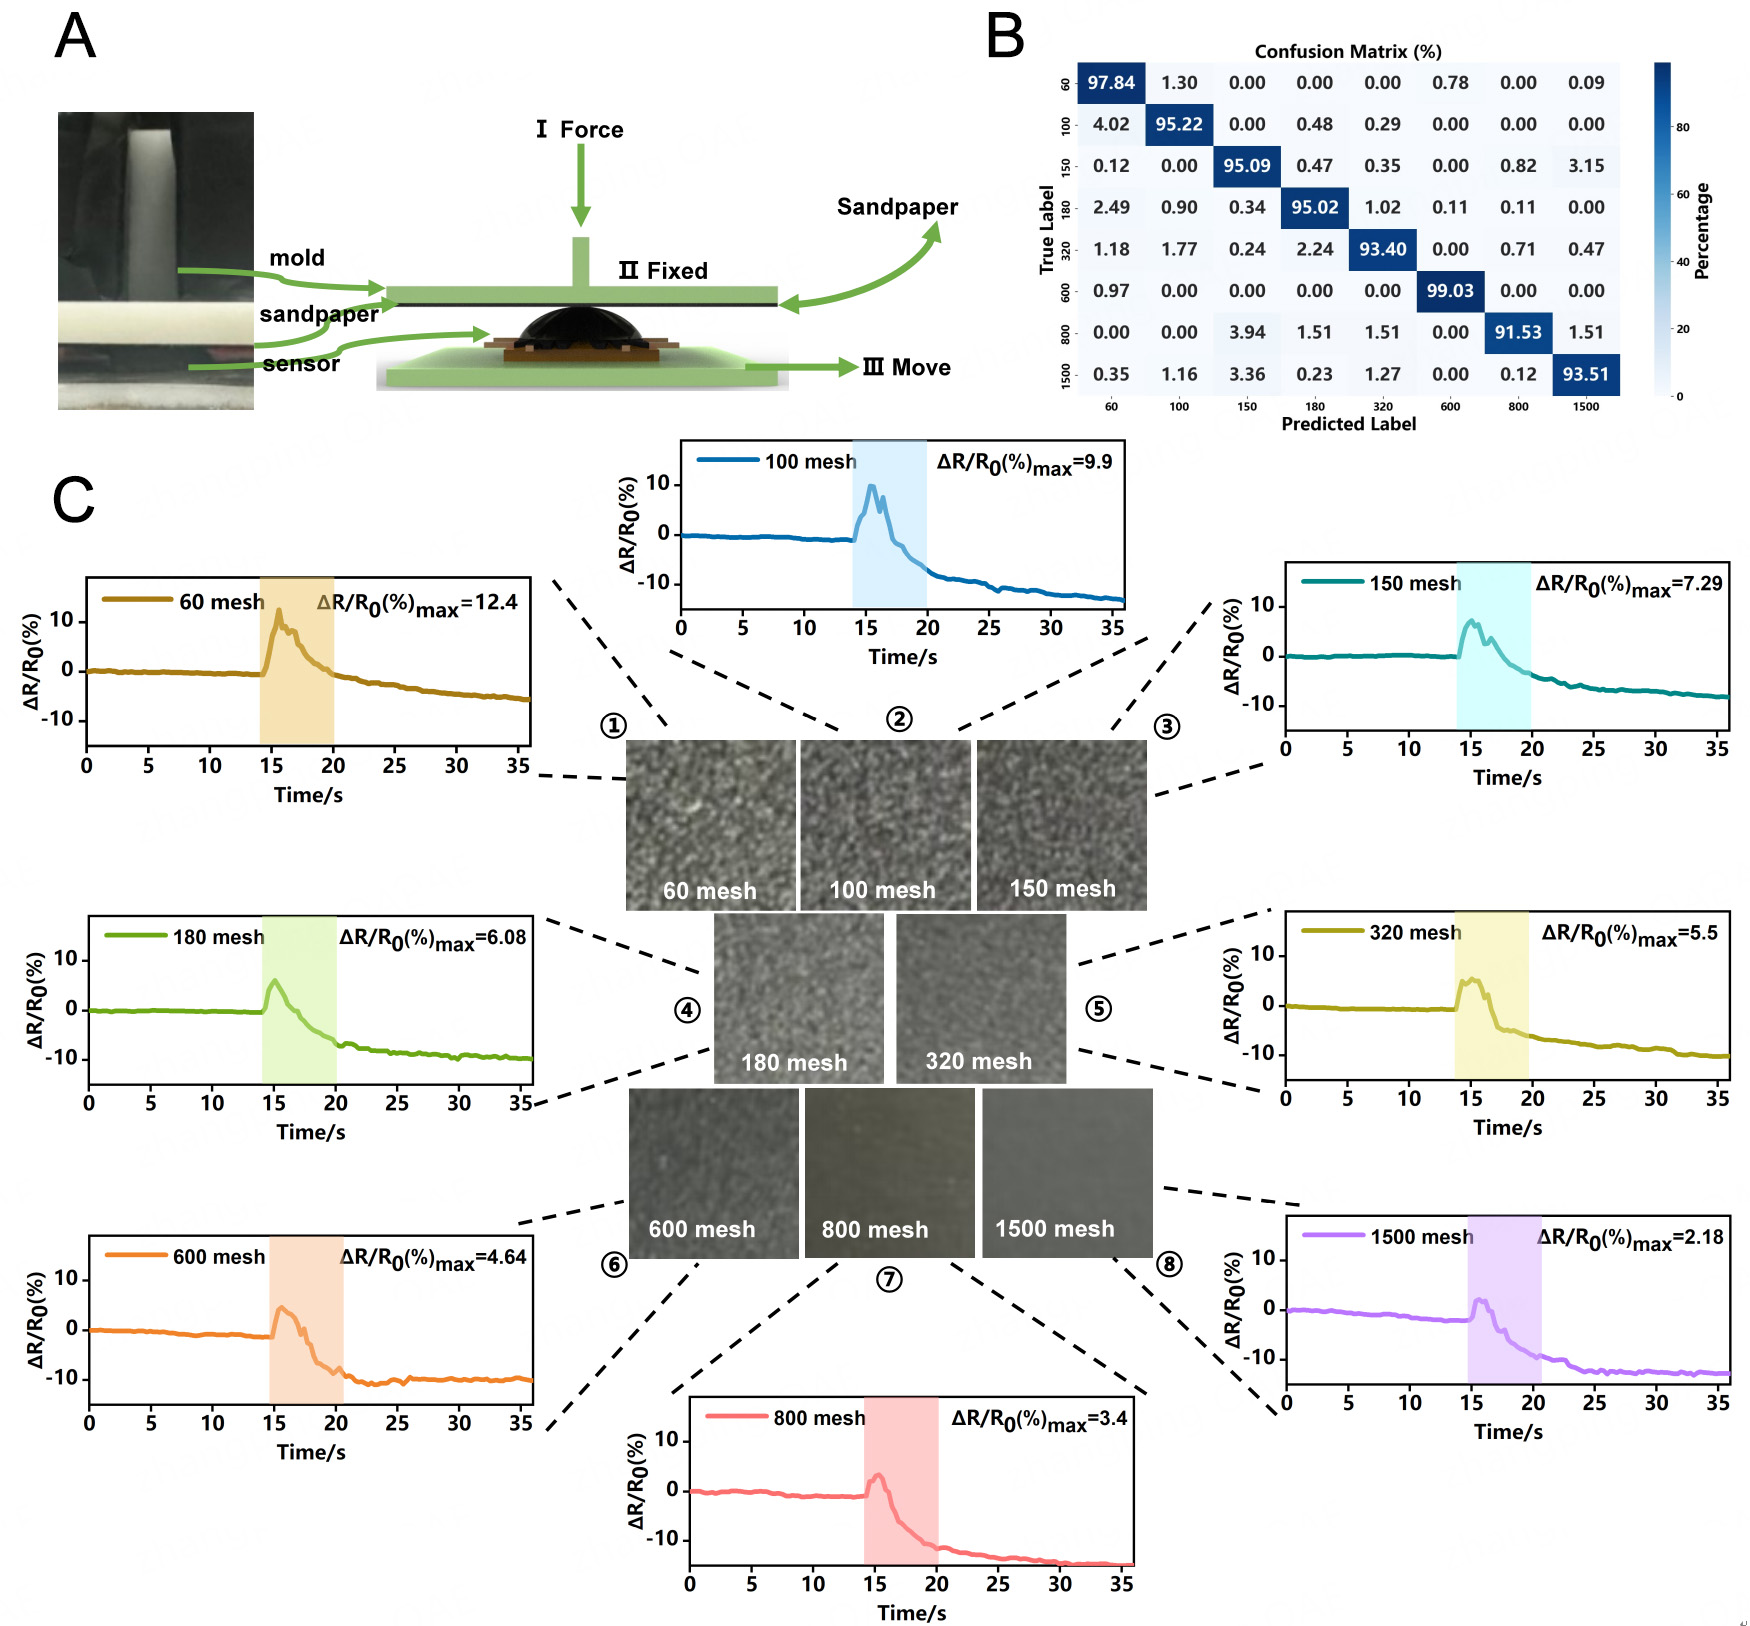
Figure 5. Surface Roughness Recognition Test of the Skin-inspired Pressure Sensor. (A) Experimental setup and schematic diagram for the surface roughness recognition test; (B) Classification results using K-nearest neighbors (KNN) for eight different surface roughness levels; (C) Resistance change curves corresponding to the eight different surface roughness levels.
The experiment of gait recognition using two flexible pressure sensors is shown in Figure 6. Figure 6A illustrates the working principle of the gait signal acquisition system. In this system, the sensors are designed and fixed to the sole, covering the forefoot and hindfoot regions. The forefoot includes four sensing channels, while the hindfoot uses one channel. Through these sensors, the system monitors real-time pressure variations in different areas of the sole, collects data through a customized flexible printed circuit board (FPCB), and transmits the signals. The signals are then converted by an analog-to-digital converter (ADC) and sent via Bluetooth to a computer, where they are processed by a KNN algorithm for gait classification, enabling the recognition of different gait types. Figure 6B shows the four gait types involved in the experiment: going upstairs, going downstairs, walking straight ahead, and walking backwards. Each gait is divided into three stages (Stage 1, Stage 2, Stage 3) to capture the dynamic changes in foot movement over time. By recording and analyzing resistance variations in real time, the system can effectively identify the gait type and the corresponding foot motion. During the process of going upstairs, the gait can be divided into three stages. In Stage 1, the foot has not yet touched the ground, and the resistance remains at its initial value. Around 6 s, the forefoot and hindfoot contact the ground simultaneously, entering Stage 2, during which the resistance of all five channels increases. At approximately 16 s, one foot lifts off the ground, concentrating the load on the foot with the sensors and generating new resistance pulses. During stair descent, Stage 1 is similar to that in stair ascent, but at 4-5 s, Stage 2 begins when the forefoot first contacts the ground, leading to resistance changes in channels 1-4. Around 10-11 s, the hindfoot touches the ground, entering Stage 3, where the hindfoot sensor resistance increases. During forward walking, Stage 1 shows a similar resistance variation pattern to those of the stair ascent and descent gaits. At approximately 7 s, Stage 2 begins when the hindfoot contacts the ground, causing an increase in channel 5 resistance. Around 15 s, the forefoot touches the ground, and the resistances of channels 1-4 increase further. In backward walking, the pressure distribution on the sole is similar to that during stair descent. In Stage 1, the foot is suspended in the air, followed by the forefoot contacting the ground in Stage 2, and finally, the hindfoot contacting the ground in Stage 3. However, the key difference lies in the forefoot pressure during Stage 2. When walking backwards, the angle between the sensor and the ground is smaller than in stair descent, resulting in lower pressure concentrated near channel 4. Moreover, in backward walking, the forefoot contact area with the ground in Stage 2 is larger than that during stair descent. This leads to lower pressure on the forefoot sensors when walking backwards, producing smaller resistance changes. During the stable period of Stage 2 in backward walking, the resistance variation rates of channels 1, 2, 3, and 4 are 63.9%, 63.3%, 30.9%, and 52.4%, respectively. By contrast, in the stable Stage 2 of stair descent, the variation rates are 59.4%, 96.9%, 48.8%, and 104%, respectively. This indicates that, compared with stair descent, the forefoot pressure is smaller when walking backwards, especially near channel 4.
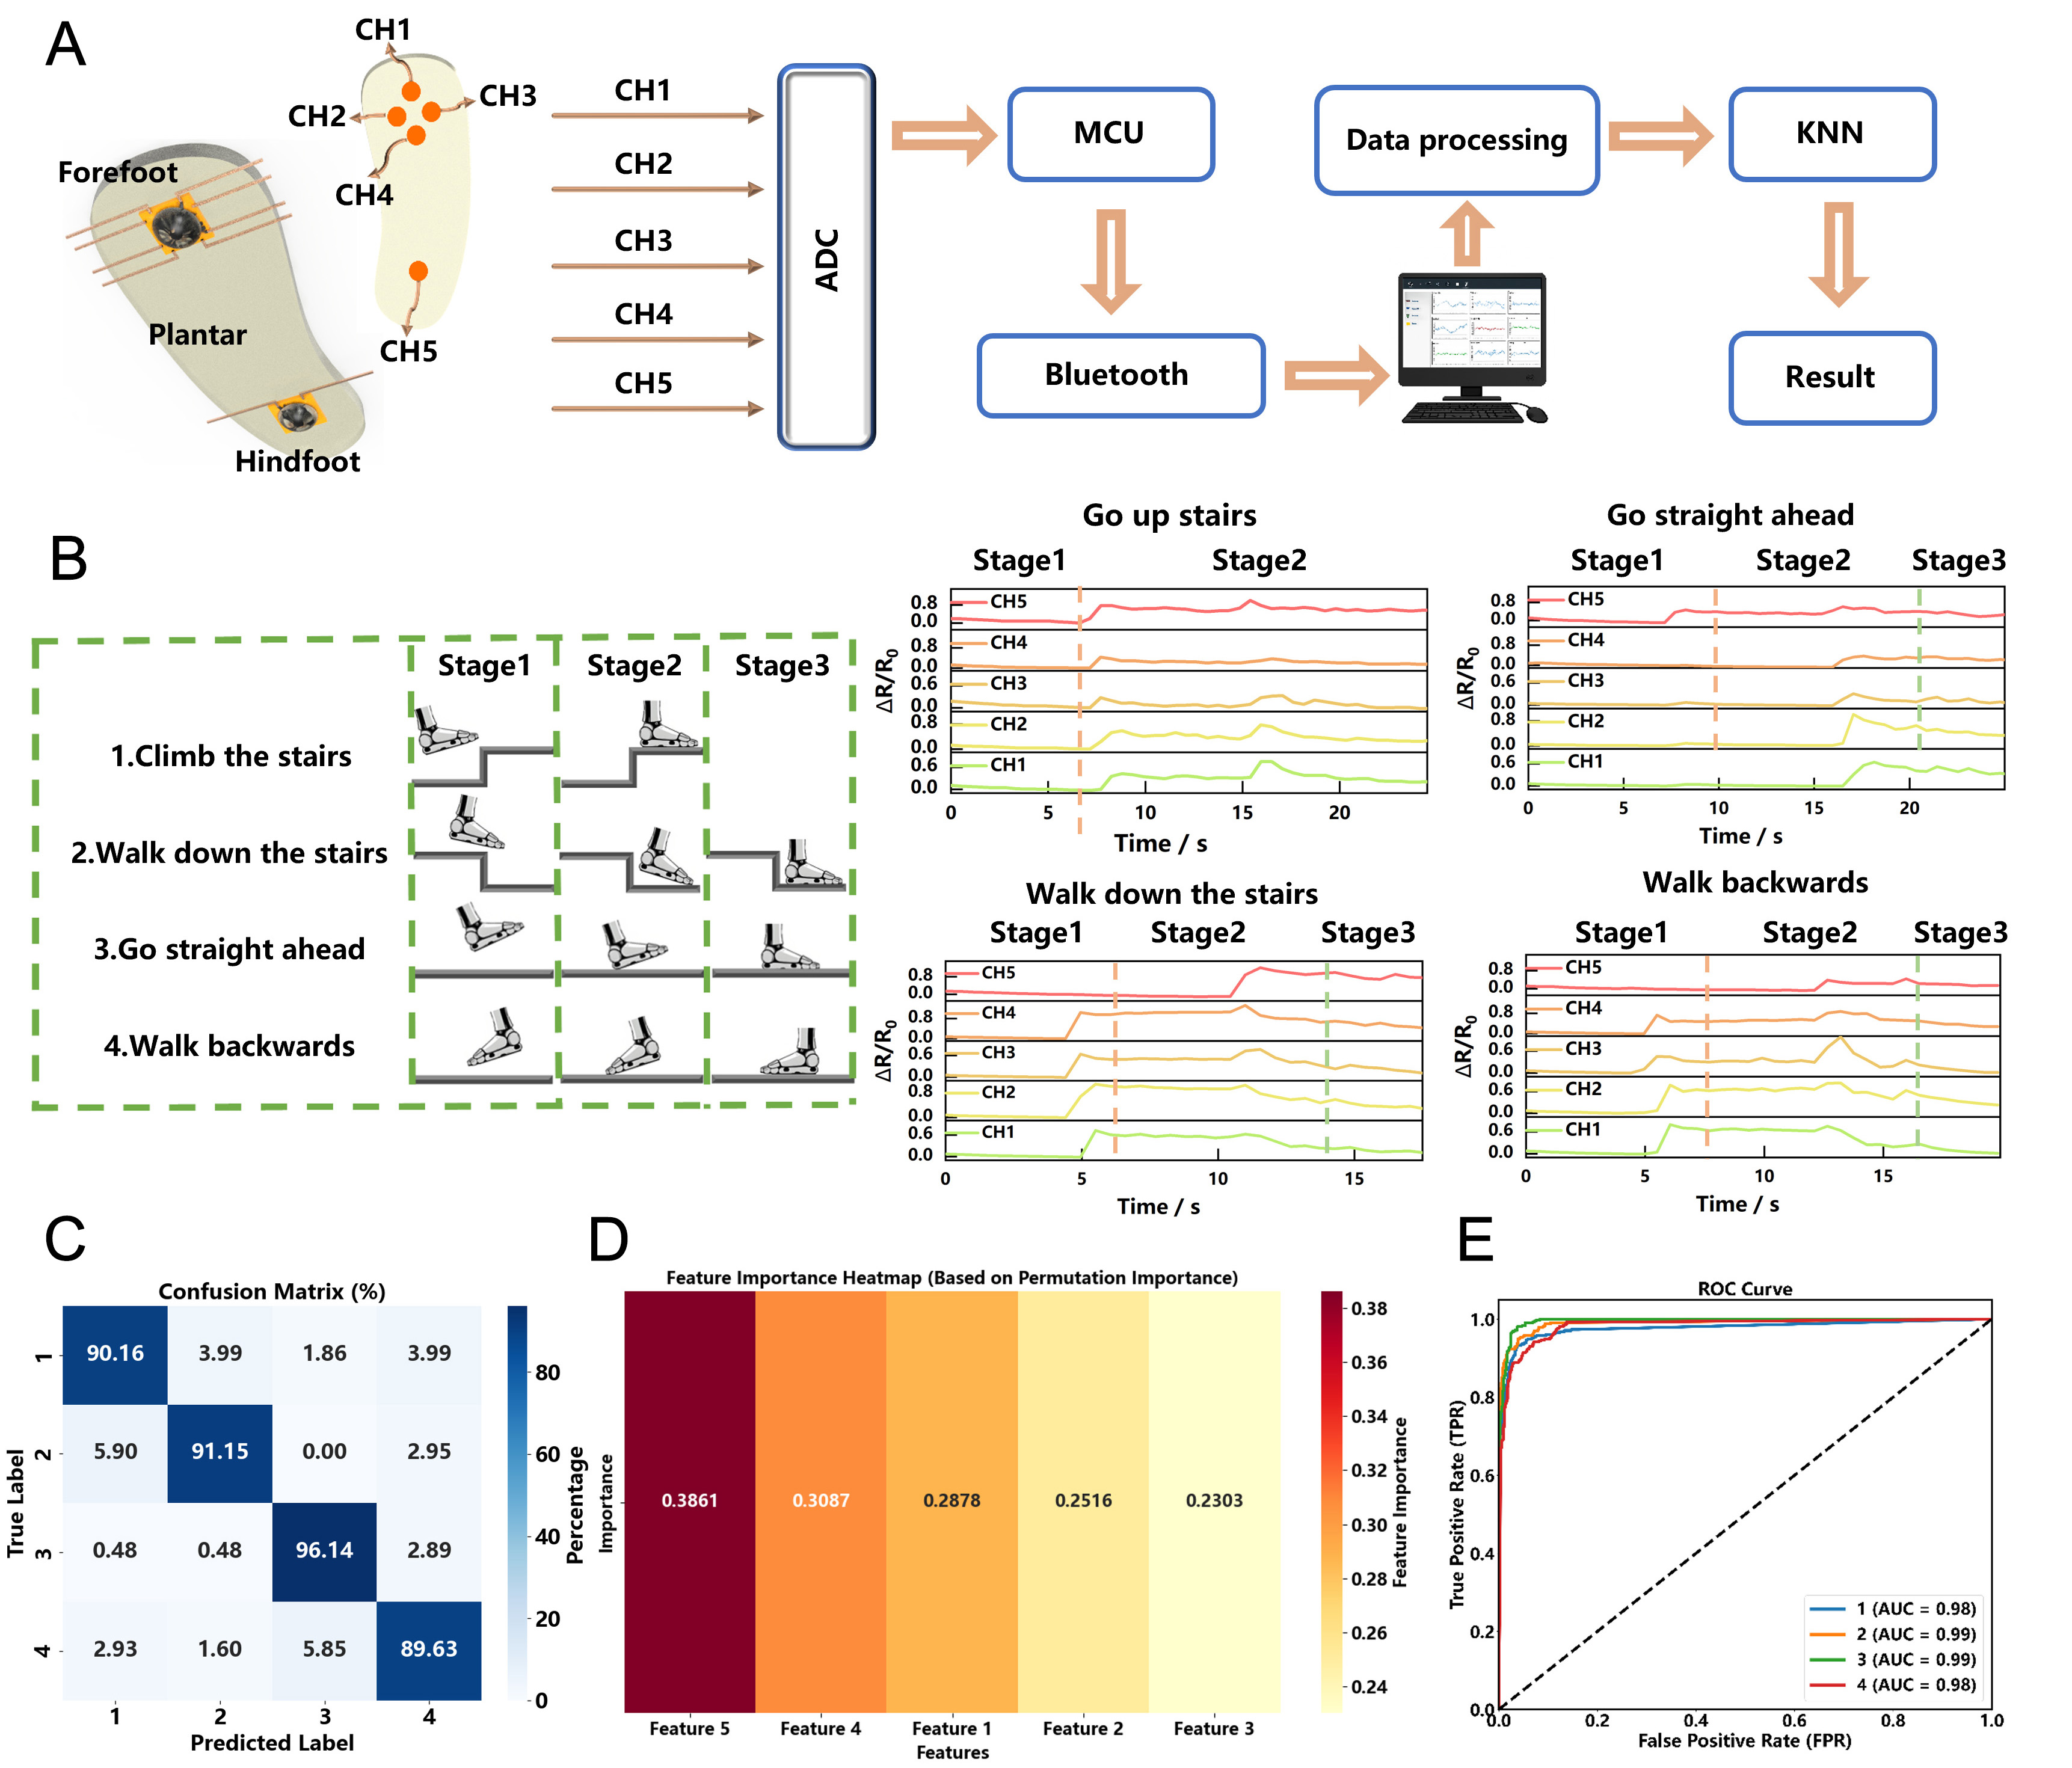
Figure 6. Gait recognition test using skin-inspired pressure sensors. (A) Schematic diagram of the system structure, showing the sensor array and data processing flow; (B) Resistance variations of four gait signals, including going upstairs, going downstairs, walking straight ahead, and walking backwards; (C) KNN-based classification results for four gait types; (D) Feature importance heatmap, showing the contribution of each feature in classification; (E) ROC curve, illustrating the AUC values of different gaits. KNN: K-nearest neighbors; AUC: area under the curve; ROC: receiver operating characteristic.
For the classification task, a dataset consisting of 4 gait classes was established. Each class included 20 experimental trials, ensuring a uniform sample distribution. The time-series signals from the five sensing channels served as the feature vectors. Figure 6C presents the confusion matrix of the KNN classification results for the four gait types. The classification accuracies are 90.16% for going upstairs, 91.15% for going downstairs, 96.14% for walking forward, and 89.63% for walking backwards. The confusion matrix shows good consistency between predicted and true labels, with high accuracy and low misclassification rates, demonstrating the system’s strong performance in gait classification. Figure 6D displays the feature importance in gait recognition. The importance values are calculated using the permutation importance method, where the color bar represents the magnitude of importance, with darker colors indicating higher importance. Feature 5 (hindfoot channel) exhibits the highest importance (0.3861), which is attributed to the biomechanical significance of the heel strike phase. During initial contact, the heel bears the primary impact of the body’s weight, generating signals with superior temporal localization and amplitude stability. These sharp pressure peaks serve as critical temporal anchors for distinguishing gait patterns like backward walking or stair navigation. In contrast, while the forefoot channels capture rich spatial data, the mechanical stress during the push-off phase is more distributed, leading to dispersed signal features with lower discriminative weight. Figure 6E shows the ROC curves for the four gait classifications. Each curve reflects the performance of different gaits at varying thresholds, with the AUC (area under the curve) used to quantify classification accuracy. The curves correspond to four gait classification results with AUC values of 0.98 (Gait 1), 0.99 (Gait 2), 0.99 (Gait 3), and 0.98 (Gait 4). The results demonstrate that all four gaits achieve high classification accuracy, particularly Gait 2 and Gait 3, with AUC values approaching 1, indicating excellent classification performance. Supplementary Figure 18 provides a comprehensive view of the classification metrics (Precision, Recall, and F1-score) for each gait type. All three metrics consistently exceed 90% across all classes, this balanced performance across multiple evaluation indices confirms that the proposed system avoids bias toward any specific gait and maintains high reliability for real-world activity monitoring.
Discussion
Our sensor demonstrates excellent multi-dimensional sensing capabilities, with the ability to track force signals across 16 distinct directions and at varying rates, which is critical for applications such as electronic skin, smart prosthetics, and dynamic motion monitoring. This capability was validated through systematic testing, where the sensor achieved a remarkable classification accuracy of up to 99.46% in multi-directional tests and exhibited strong performance in rate-dependent force tracking.
The sensor’s pressure-response characteristics are equally impressive, showing a highly linear relationship between applied pressure and resistance variation in the range of 0-35 kPa. This linearity, coupled with the sensor’s high mechanical stability, makes it ideal for precise pressure quantification in real-world applications. Additionally, the sensor’s robustness was confirmed by its consistent performance through over 10000 loading cycles, which highlights its potential for long-term use in dynamic environments. To benchmark these capabilities, Table 2 compares our device’s key performance metrics with other recently reported flexible sensors. While specific designs may offer higher sensitivity or faster response times, our work stands out through a robust combination of a wide linear range, high durability (10,000 cycles), and the unique capacity to decouple multi-directional forces. This balanced performance profile ensures reliable operation in complex mechanical environments where multi-axial information is critical.
Performance comparison of this work with state-of-the-art flexible pressure sensors
| Author | Linear range | Sensitivity | Response time | Recovery time | Durability |
| Song et al. (2025)[41] | 0-55 kPa | 1.7356 kPa-1 | 147 ms | 59 ms | 2,000 cycles |
| Beigh & Alcheikh (2025)[42] | 0-2500 kPa | 33.2%/MPa (≈0.0332 kPa-1) | 300 ms | 700 ms | 5,000 s loading for 5 weeks |
| Uzabakiriho et al. (2025)[43] | 0-40% strain | GF = 71.5 | 80 ms | 160 ms | 3,000 cycles |
| Kang et al. (2025)[44] | 0-8 N | -0.0625 kΩ/N | 93 ms | - | 10,000 cycles |
| Xu et al. (2025)[45] | - | GF = 634.12 | - | - | 15,000 cycles |
| This work | 0-35 kPa | 0.03 kPa-1 (0-17 kPa) 0.02 kPa-1 (17-31 kPa) | 220 ms | 1.94 s | 10,000 cycles |
CONCLUSIONS
In summary, we have developed a biomimetic, kirigami-enabled flexible tactile sensor that effectively overcomes the dimensionality and decoupling limitations of traditional planar devices by replicating the hierarchical mechanoreceptor architecture and stress-dispersing functions of human skin. By integrating a 3D LIG network with a SiO2-doped Ecoflex substrate, the unique structural heterogeneity translates spatial deformations into distinct anisotropic electrical signatures, enabling the intrinsic decoupling of force magnitude, direction, and dynamic stimuli. The sensor demonstrates outstanding electromechanical performance, featuring a wide linear range (0-35 kPa), exceptional durability (10,000 cycles), and highly discriminative encoding capabilities that allowed machine learning algorithms to achieve a 99.46% accuracy in 16-direction recognition. Furthermore, our EMLP framework successfully achieved precise quantitative decoupling of normal and shear forces (R2 > 0.97), effectively suppressing the non-linear interference and viscoelastic hysteresis inherent in soft materials. Beyond fundamental characterization, the sensor’s practical utility was validated through high-fidelity surface roughness discrimination (95.34%) and real-time human gait monitoring (91.77%). Ultimately, this work establishes a new structural coding paradigm for tactile perception, paving the way for the next generation of intelligent electronic skins, advanced prosthetics, and seamless human-machine interaction systems.
DECLARATIONS
Author contributions
Conceptualization, supervision, writing - review & editing: Chen, D.; Liu, Y.
Methodology: Du, Y.; Cao, F.; Dou, G.; Ma, Q.
Investigation: Du, Y.; Cao, F.
Visualization: Du, X.; Wang, H.; Ding, Y.
Writing - original draft: Du, Y.; Cao, F.; Liu, Y.
Availability of data and materials
All data are available in the main text or the Supplementary Materials.
AI and AI-assisted tools statement
During the preparation of this manuscript, the AI tool Gemini pro (version 3.1, released 2026-2-19) was used solely for improving schematical image. The tool did not influence the study design, data collection, analysis, interpretation, or the scientific content of the work. All authors take full responsibility for the accuracy, integrity, and final content of the manuscript.
Financial support and sponsorship
This work was supported by National Key R&D Program of China (No. 2024YFB3214000), the national natural science foundation of China (No. 62371275, 62201328 and 62401345), Natural Science Foundation of Shandong Province (No. ZR2023MF009, ZR2021QH221 and ZR2021QF121), Natural Science Foundation of Qingdao (No.23-2-1-155-zyyd-jch, 24-4-4-zrjj-95-jch and No.24-4-4-zrjj-98-jch), Industry Cluster Leading Program of Qingdao (No. 25-1-1-gjgg-18-gx).
Conflicts of interest
All authors declared that there are no conflicts of interest.
Ethical approval and consent to participate
Not applicable.
Consent for publication
Not applicable.
Copyright
© The Author(s) 2026.
Supplementary Materials
REFERENCES
1. Zhang, Y.; Yan, Z.; Nan, K.; et al. A mechanically driven form of Kirigami as a route to 3D mesostructures in micro/nanomembranes. Proc. Natl. Acad. Sci. U. S. A. 2015, 112, 11757-64.
2. Lumpkin, E. A.; Caterina, M. J. Mechanisms of sensory transduction in the skin. Nature 2007, 445, 858-65.
3. Johnson, K. O. The roles and functions of cutaneous mechanoreceptors. Curr. Opin. Neurobiol. 2001, 11, 455-61.
4. Boutry, C. M.; Negre, M.; Jorda, M.; et al. A hierarchically patterned, bioinspired e-skin able to detect the direction of applied pressure for robotics. Sci. Robot. 2018, 3, 9.
5. Wang, X.; Dong, L.; Zhang, H.; Yu, R.; Pan, C.; Wang, Z. L. Recent progress in electronic skin. Adv. Sci. 2015, 2, 1500169.
6. Gong, S.; Schwalb, W.; Wang, Y.; et al. A wearable and highly sensitive pressure sensor with ultrathin gold nanowires. Nat. Commun. 2014, 5, 3132.
7. Yang, J. C.; Mun, J.; Kwon, S. Y.; Park, S.; Bao, Z.; Park, S. Electronic skin: recent progress and future prospects for skin-attachable devices for health monitoring, robotics, and prosthetics. Adv. Mater. 2019, 31, 1904765.
8. Pang, C.; Lee, G. Y.; Kim, T. I.; et al. A flexible and highly sensitive strain-gauge sensor using reversible interlocking of nanofibres. Nat. Mater. 2012, 11, 795-801.
9. Sun, Q.; Seung, W.; Kim, B. J.; Seo, S.; Kim, S. W.; Cho, J. H. Active matrix electronic skin strain sensor based on piezopotential-powered graphene transistors. Adv. Mater. 2015, 27, 3411-7.
10. Larson, C.; Peele, B.; Li, S.; et al. Highly stretchable electroluminescent skin for optical signaling and tactile sensing. Science 2016, 351, 1071-4.
11. Someya, T.; Bao, Z.; Malliaras, G. G. The rise of plastic bioelectronics. Nature 2016, 540, 379-85.
13. Mannsfeld, S. C.; Tee, B. C.; Stoltenberg, R. M.; et al. Highly sensitive flexible pressure sensors with microstructured rubber dielectric layers. Nat. Mater. 2010, 9, 859-64.
14. Schwartz, G.; Tee, B. C.; Mei, J.; et al. Flexible polymer transistors with high pressure sensitivity for application in electronic skin and health monitoring. Nat. Commun. 2013, 4, 1859.
15. Lee, S.; Reuveny, A.; Reeder, J.; et al. A transparent bending-insensitive pressure sensor. Nat. Nanotechnol. 2016, 11, 472-8.
16. Xue, C.; Zhao, Y.; Liao, Y.; Zhang, H. Bioinspired super-robust conductive hydrogels for machine learning-assisted tactile perception system. Adv. Mater. 2025, 37, e2416275.
17. Chen, W.; Liu, S.; Zhuang, J.; et al. Emerging metal oxide based triboelectric nanogenerators for energy collection and self-powered sensing. Mater. Sci. Eng. R. Rep. 2026, 167, 101119.
18. Tee, B. C.; Chortos, A.; Berndt, A.; et al. A skin-inspired organic digital mechanoreceptor. Science 2015, 350, 313-6.
19. Wang, S.; Oh, J. Y.; Xu, J.; Tran, H.; Bao, Z. Skin-inspired electronics: an emerging paradigm. Acc. Chem. Res. 2018, 51, 1033-45.
20. Chen, H.; Jing, Y.; Lee, J.; et al. Human skin-inspired integrated multidimensional sensors based on highly anisotropic structures. Mater. Horiz. 2020, 7, 2378-89.
21. Duan, S.; Wei, X.; Zhao, F.; et al. Bioinspired Young’s modulus-hierarchical E-skin with decoupling multimodality and neuromorphic encoding outputs to biosystems. Adv. Sci. 2023, 10, e2304121.
22. Liu, Z.; Hu, X.; Bo, R.; et al. A three-dimensionally architected electronic skin mimicking human mechanosensation. Science 2024, 384, 987-94.
23. Lu, C.; Chen, X.; Zhang, X. Highly sensitive artificial skin perception enabled by a bio-inspired interface. ACS. Sens. 2023, 8, 1624-9.
24. Zhang, Y.; Liu, C.; Jia, B.; et al. Kirigami-inspired, three-dimensional piezoelectric pressure sensors assembled by compressive buckling. npj. Flex. Electron. 2024, 8, 23.
25. Li, X.; Zhu, P.; Zhang, S.; et al. A self-supporting, conductor-exposing, stretchable, ultrathin, and recyclable kirigami-structured liquid metal paper for multifunctional E-skin. ACS. Nano. 2022, 16, 5909-19.
26. Xin, X.; Wang, Z.; Zeng, C.; et al. 4D printing bio-inspired chiral metamaterials for flexible sensors. Compos. Part. B. Eng. 2024, 286, 111761.
27. Wang, Y.; Wang, C. Buckling of ultrastretchable kirigami metastructures for mechanical programmability and energy harvesting. Int. J. Solids. Struct. 2021, 213, 93-102.
28. Won, P.; Park, J. J.; Lee, T.; et al. Stretchable and transparent kirigami conductor of nanowire percolation network for electronic skin applications. Nano. Lett. 2019, 19, 6087-96.
29. Meng, K.; Xiao, X.; Liu, Z.; et al. Kirigami-inspired pressure sensors for wearable dynamic cardiovascular monitoring. Adv. Mater. 2022, 34, e2202478.
30. Sreevanya, G. V.; Lee, S.; Cheon, H.; Kim, M.; Kim, H. Highly stretchable and flexible kirigami patterned silver electrodes for wearable electronics. Sens. Actuators. A. Phys. 2024, 378, 115813.
31. Zhang, S.; Wang, S.; Zheng, Y.; et al. Coaxial 3D-Printed and kirigami-inspired deployable wearable electronics for complex body surfaces. Compos. Sci. Technol. 2021, 216, 109041.
32. Jiao, R.; Wang, Z.; Wang, R.; et al. Deep learning based large‐area contact sensing for safe human–robot interaction using conformal kirigami structure‐enabled robotic E‐skin. Adv. Intell. Syst. 2025, 7, 2400903.
33. Dang, X.; Paulino, G. H. Kirigami Engineering: The Interplay Between Geometry and Mechanics. Appl. Mech. Rev. 2025, 77, 050801.
34. Shu, J.; Wang, J.; Li, Z.; Tong, R. K. Impact of pattern design on the performance of kirigami-inspired flexible piezoresistive strain sensors. In 2024 17th International Convention on Rehabilitation Engineering and Assistive Technology (i-CREATe), Shanghai, China, August 23-26, 2024; IEEE, 2024, pp 1-5.[DOI:10.1109/i-CREATe62067.2024.10776469].
35. Wang, Z.; Lei, K.; Tang, H.; et al. STEV: stretchable triboelectric e-skin enabled proprioceptive vibration sensing for soft robot. In 2023 IEEE International Conference on Robotics and Automation (ICRA), London, United Kingdom, May 29 - June 2, 2023; IEEE, 2023, pp 588-93.
36. Hu, X.; Liu, Z.; Tang, Z.; et al. Rational assembly of 3D network materials and electronics through tensile buckling. Sci. Adv. 2025, 11, eadz0718.
37. Guo, X.; Ni, X.; Li, J.; et al. Designing mechanical metamaterials with kirigami-inspired, hierarchical constructions for giant positive and negative thermal expansion. Adv. Mater. 2021, 33, e2004919.
38. Meng, Q.; Zhu, J.; Kang, C.; et al. Kirigami-inspired flexible lithium-ion batteries via transformation of concentrated stress into segmented strain. Small 2022, 18, e2204745.
39. Yin, Y.; Yu, Y.; Li, B.; Chen, G. Notch flexure as kirigami cut for tunable mechanical stretchability towards metamaterial application. Int. J. Smart. Nano. Mater. 2022, 13, 203-17.
40. Guo, W.; Lei, Y.; Zhao, X.; et al. Printed-scalable microstructure BaTiO3/ecoflex nanocomposite for high-performance triboelectric nanogenerators and self-powered human-machine interaction. Nano. Energy. 2024, 131, 110324.
41. Song, Y.; Liu, T.; Hu, A.; et al. A haptic glove with flexible piezoresistive sensors made by graphene and polyurethane sponge for object recognition based on machine learning methods. ACS. Appl. Electron. Mater. 2025, 7, 3448-60.
42. Beigh, N. T.; Alcheikh, N. Vapor-induced porosity in graphene/PDMS: a scalable route to high-performance pressure sensors. Microsyst. Nanoeng. 2025, 11, 181.
43. Uzabakiriho, P. C.; Fan, J.; Wang, M.; Shaw, P. Multiaxial flexible strain sensors with near-zero Poisson’s ratio. Chem. Eng. J. 2025, 522, 167761.
44. Kang, S.; Mete, M.; Gandla, S.; et al. An 18-g haptic feedback ring with a three-axis force-sensing skin. Nat. Electron. 2025, 8, 1234-46.
Cite This Article
How to Cite
Download Citation
Export Citation File:
Type of Import
Tips on Downloading Citation
Citation Manager File Format
Type of Import
Direct Import: When the Direct Import option is selected (the default state), a dialogue box will give you the option to Save or Open the downloaded citation data. Choosing Open will either launch your citation manager or give you a choice of applications with which to use the metadata. The Save option saves the file locally for later use.
Indirect Import: When the Indirect Import option is selected, the metadata is displayed and may be copied and pasted as needed.
About This Article
Special Topic
Copyright

Data & Comments
Data
0


Comments
Comments must be written in English. Spam, offensive content, impersonation, and private information will not be permitted. If any comment is reported and identified as inappropriate content by OAE staff, the comment will be removed without notice. If you have any queries or need any help, please contact us at [email protected].