


fig4
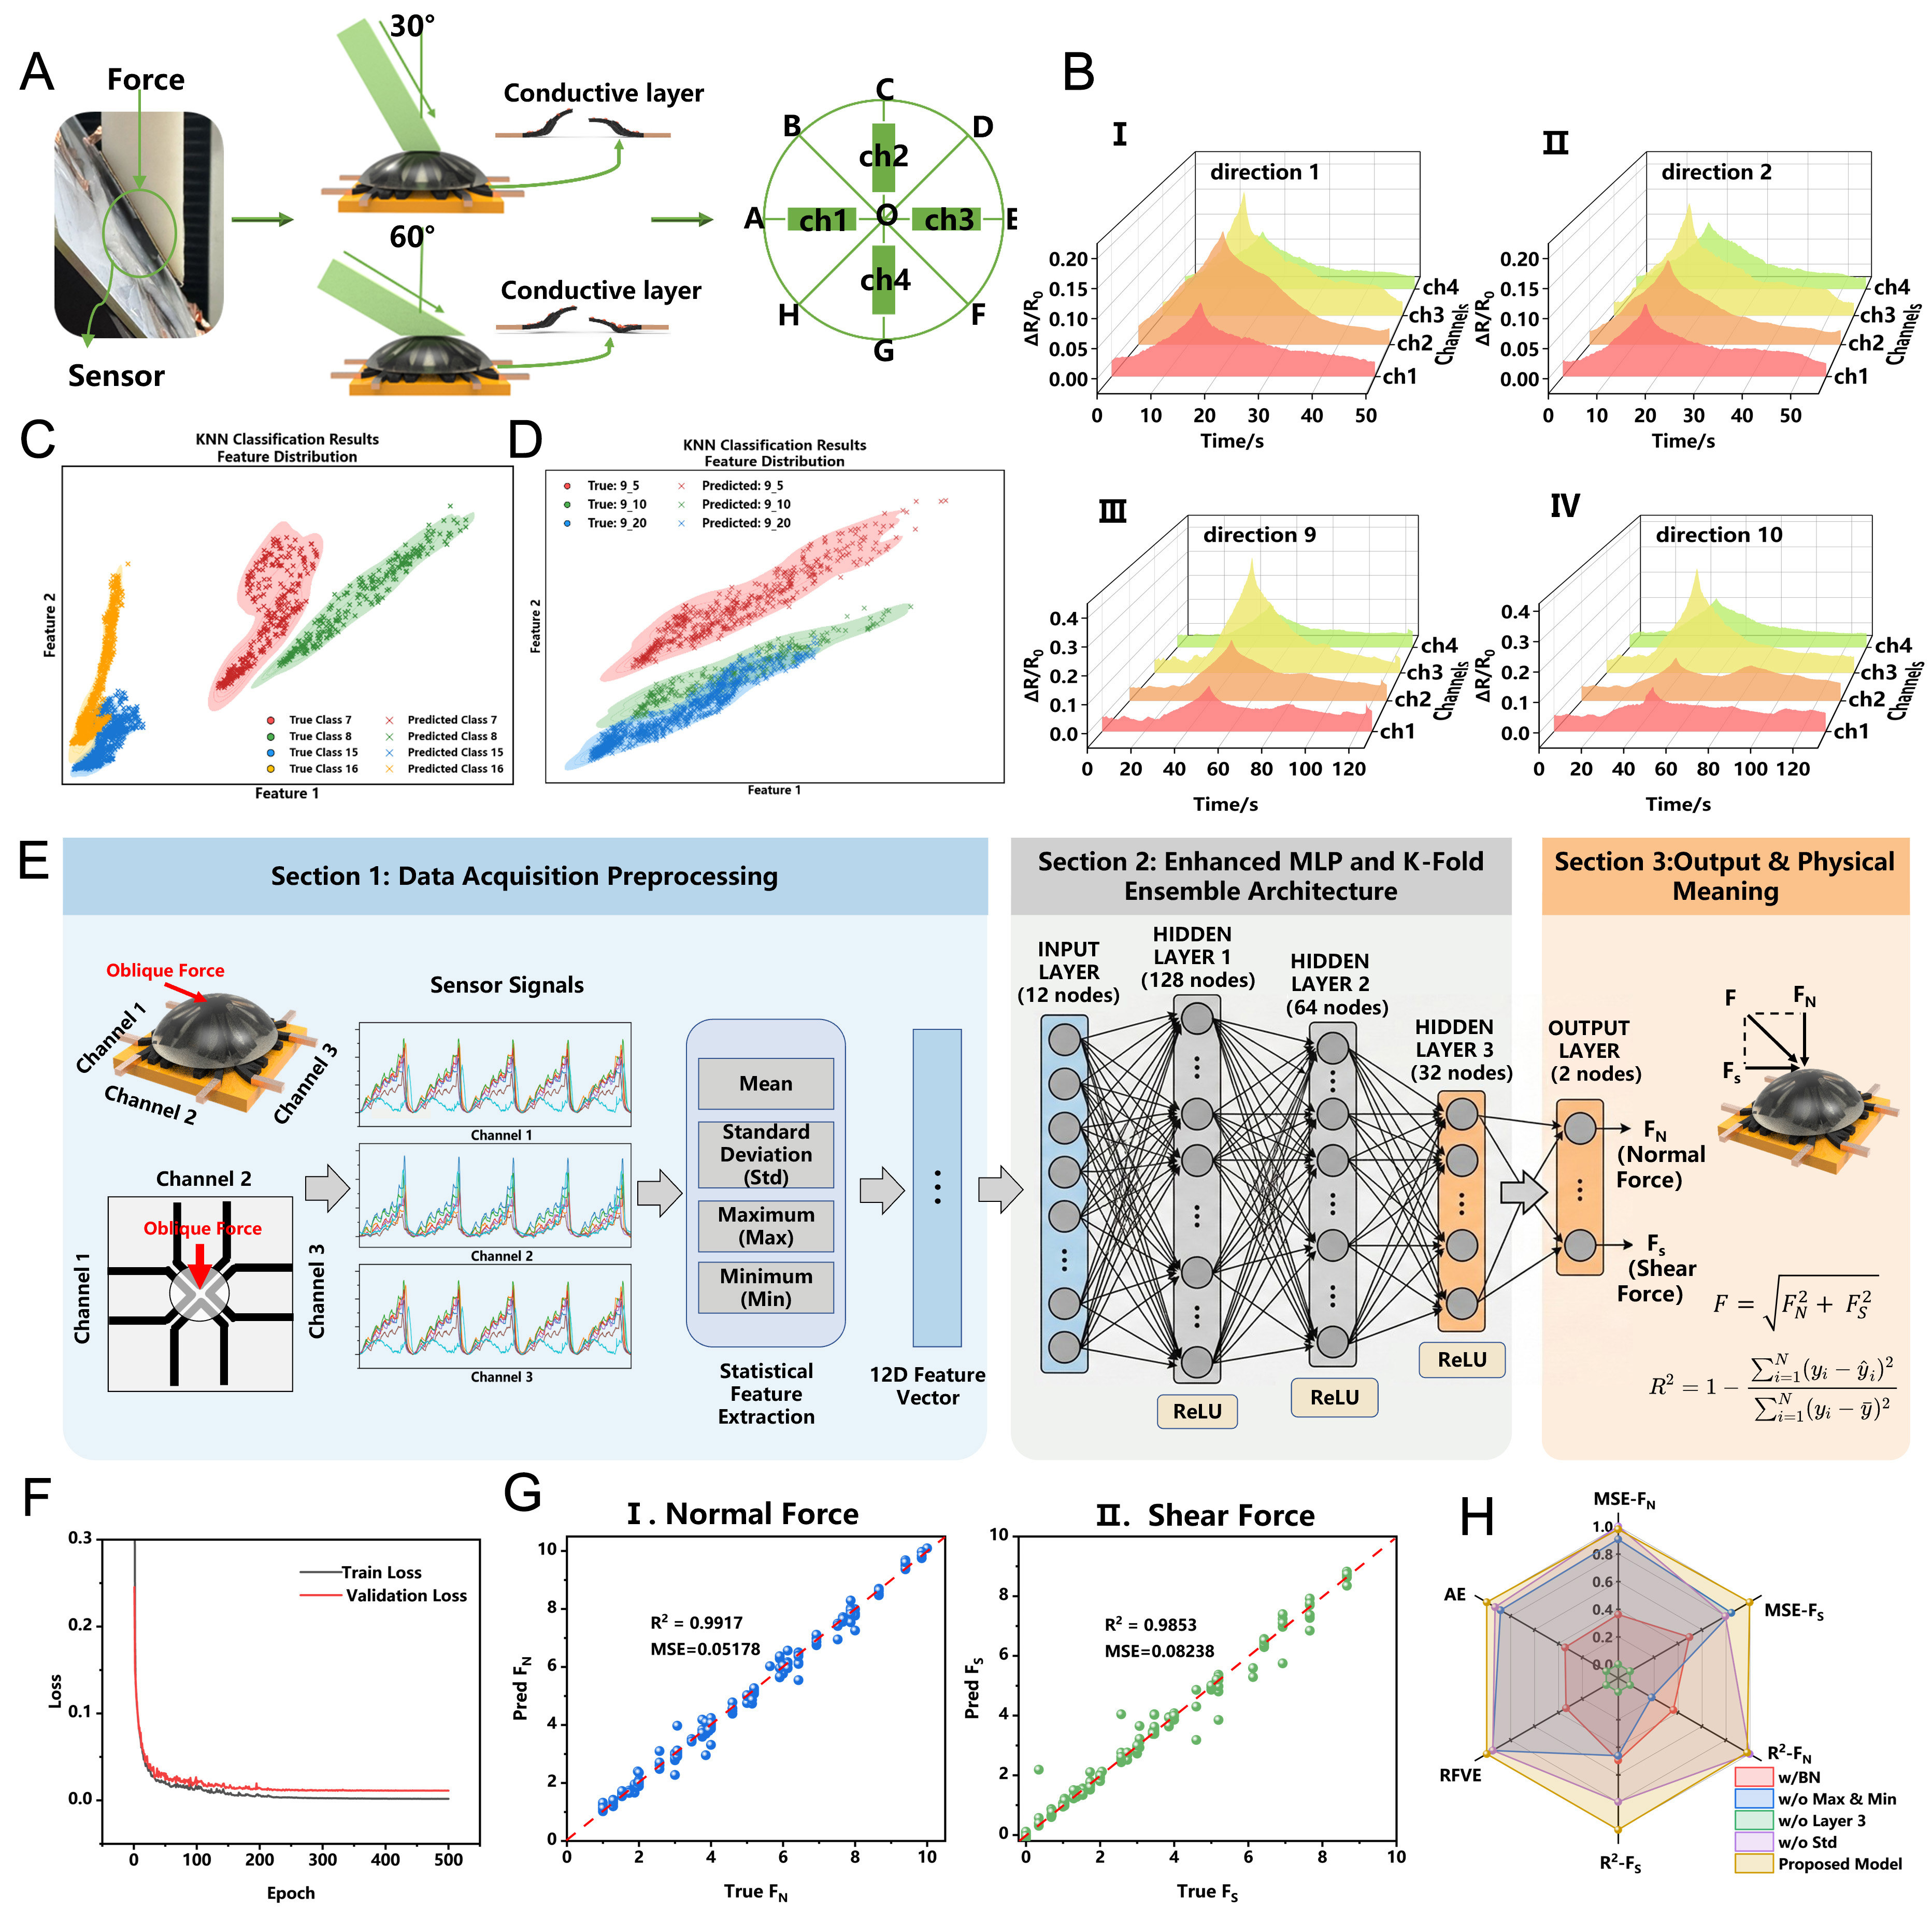
Figure 4. Characterization of multi-directional force perception and decoupling performance. (A) Experimental configuration and schematic illustration of the multi-directional force testing platform; (B) Representative relative resistance response (ΔR/R0) across four sensing channels under typical force vectors (Directions 1, 2, 9, and 10); (C) KNN classification results and feature distribution of the sensor under four representative force directions; (D) Feature distribution for Direction 9 across different indentation speeds (5, 10, and 20 mm/min); (E) Schematic workflow of the force decoupling framework for the simultaneous extraction of normal and shear components; (F and G) Decoupling performance demonstrating the predicted versus measured normal force (Fz) and shear force (Fx, Fy) components; (H) Statistical performance metrics and evaluation parameters (e.g., R2 and RMSE) of the force-decoupling algorithm. Figure 4A was photographs taken by the authors themselves during the experiments. KNN: K-nearest neighbors; MSE: mean squared error; RMSE: root mean square error; MLP: multilayer perceptron.


