



Genetic predisposition to diabetes mellitus causally increases acute pancreatitis risk
 0
0 
Abstract
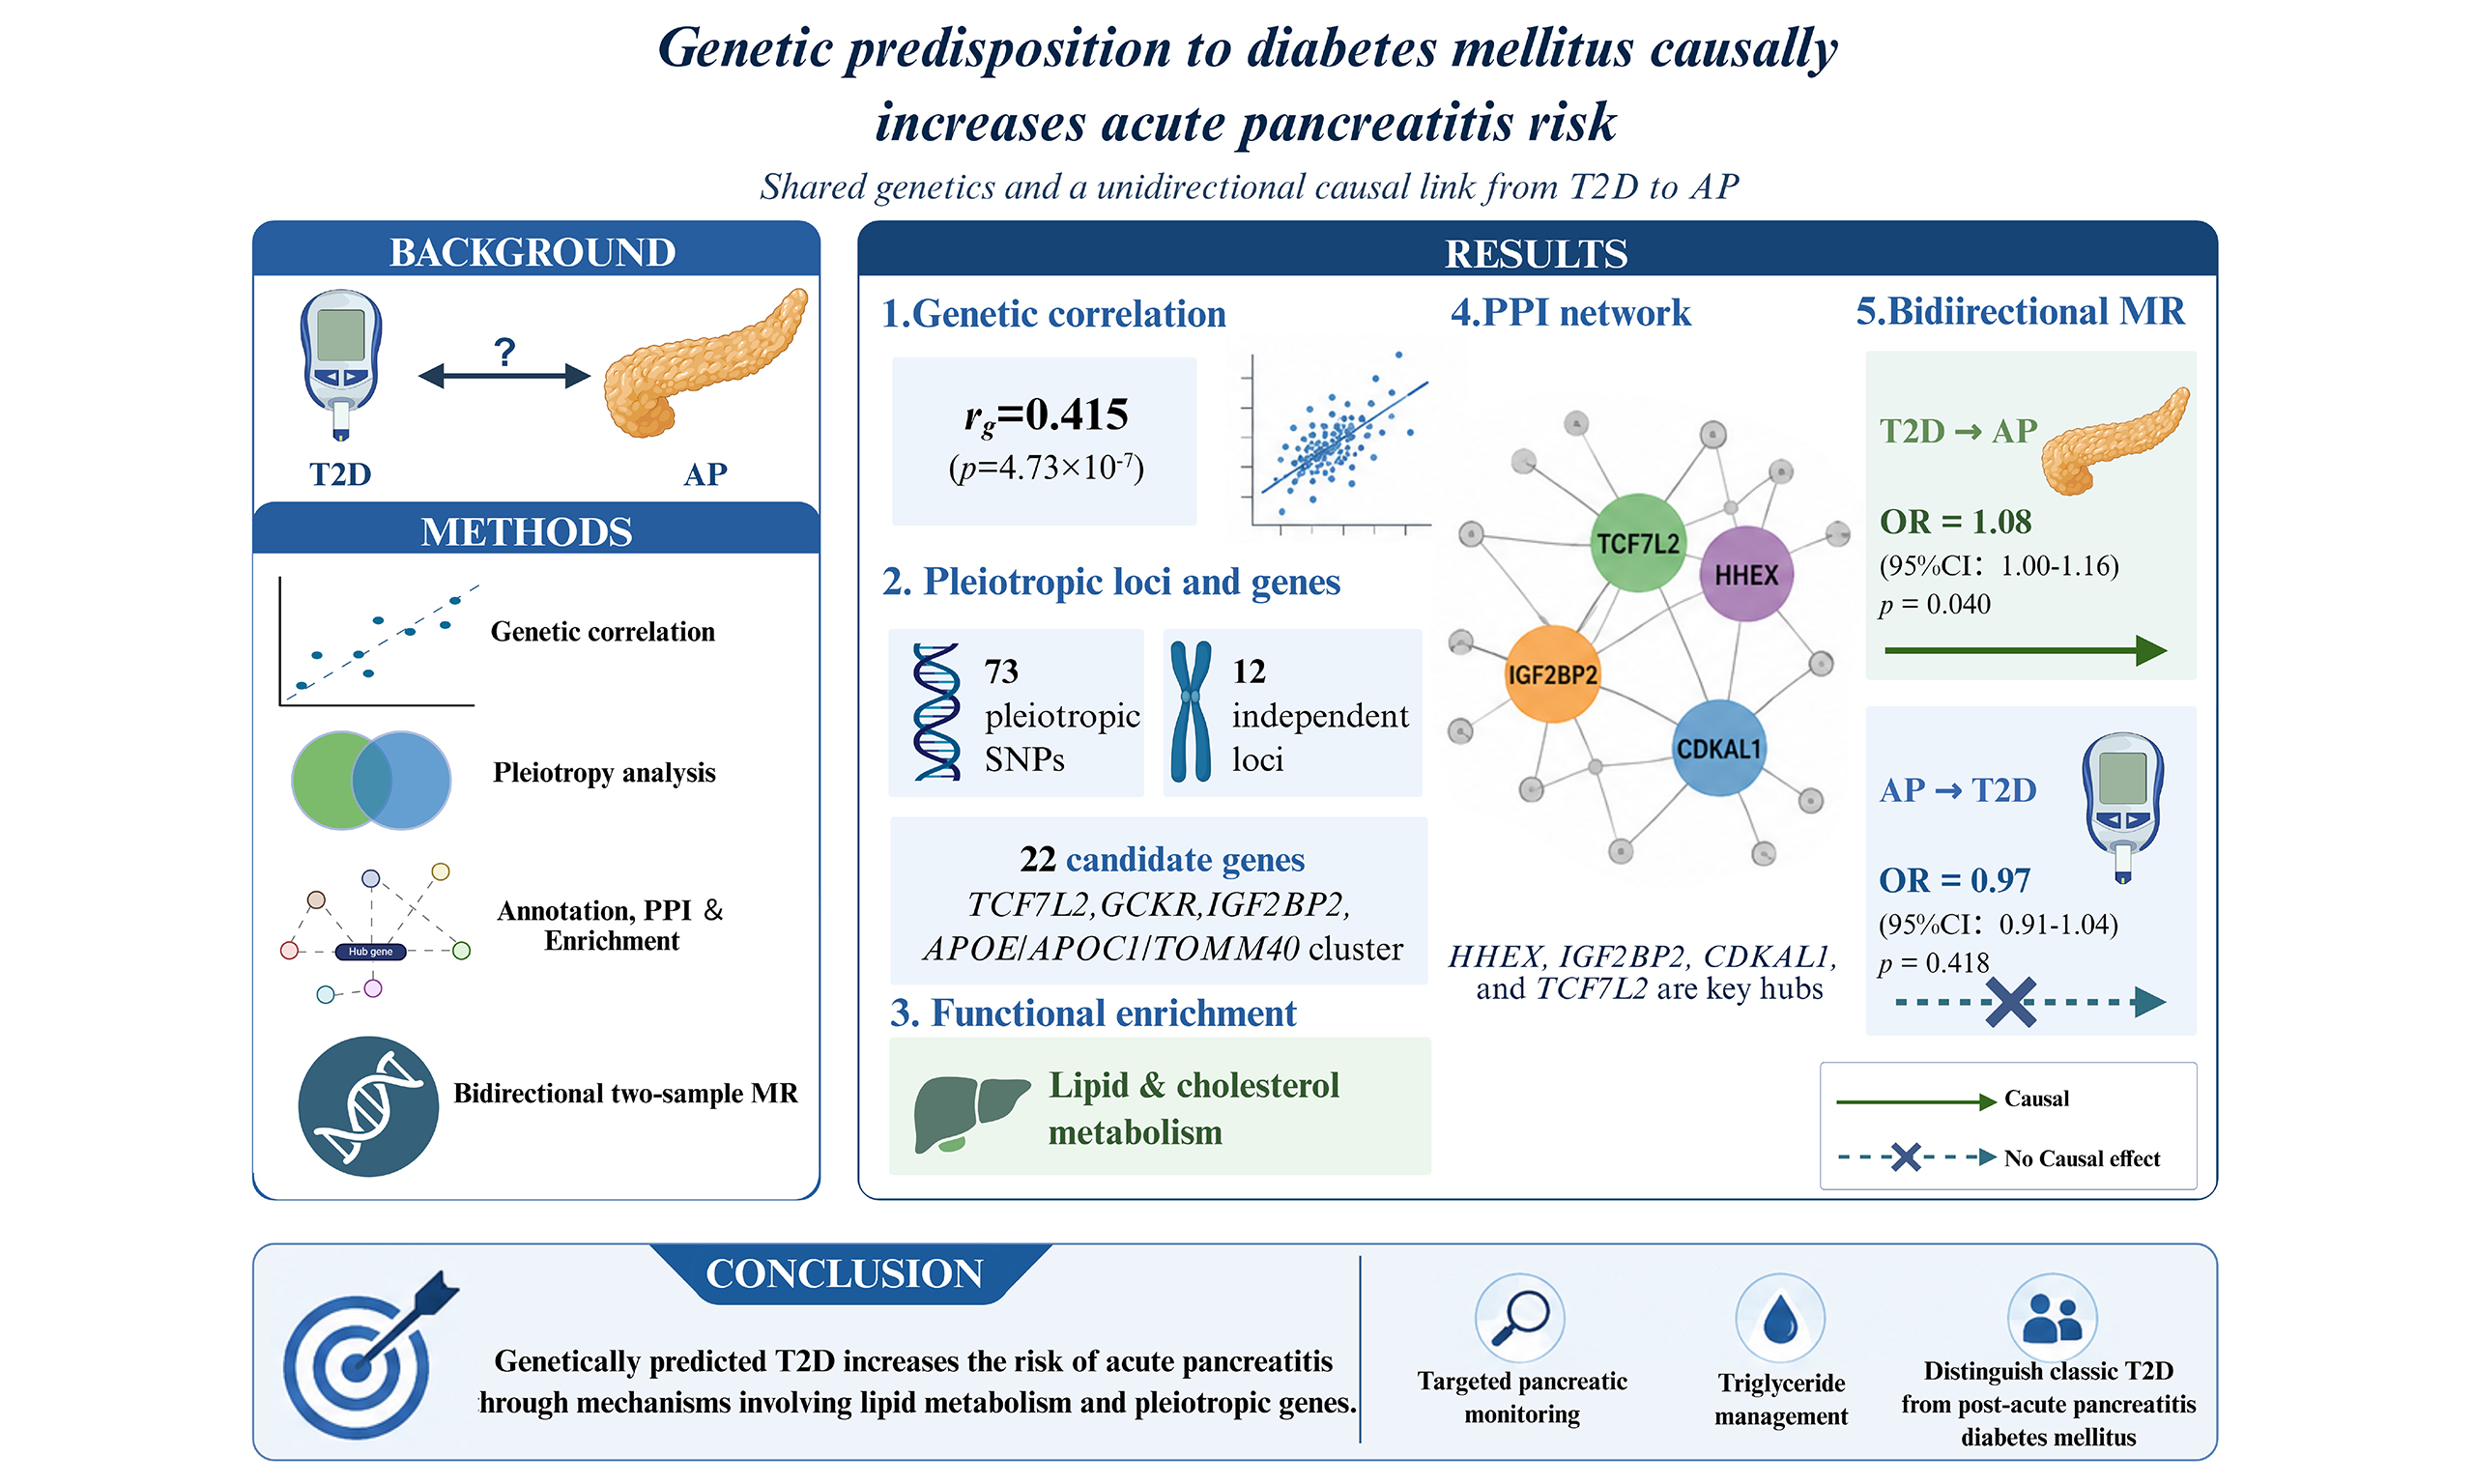
Aim: This study aimed to investigate the shared genetic determinants and causal relationship between acute pancreatitis (AP) and type 2 diabetes (T2D), two conditions that frequently co-occur.
Methods: Using large-scale genome-wide association study (GWAS) summary statistics, we conducted a multistep analysis. We estimated genome-wide genetic correlation (linkage disequilibrium score regression, LDSC), identified pleiotropic single-nucleotide polymorphisms (SNPs) (pleiotropy analysis under the composite null hypothesis, PLACO), mapped candidate genes and constructed a protein-protein interaction (PPI) network [functional mapping and annotation (FUMA), STRING], performed functional enrichment analysis, and conducted bidirectional two-sample Mendelian randomization (MR) to infer causality.
Results: AP and T2D showed a significant positive genetic correlation (rg = 0.415, P = 4.73 × 10⁻⁷). We identified 73 pleiotropic SNPs across 12 independent loci, corresponding to 22 candidate genes, including TCF7L2, GCKR, IGF2BP2, and the APOE/APOC1/TOMM40 cluster. PPI analysis revealed a densely interconnected network, with HHEX, IGF2BP2, CDKAL1, and TCF7L2 as key hubs. Functional enrichment analyses highlighted lipid metabolism pathways. Bidirectional MR demonstrated an asymmetric causal relationship: genetic predisposition to T2D increased AP risk [inverse-variance weighted odds ratio (OR) = 1.08, 95% confidence interval (CI): 1.00-1.16, P = 0.040], whereas AP did not significantly alter T2D risk (OR = 0.97, 95%CI: 0.91-1.04, P = 0.418).
Conclusion: Our analyses reveal a shared genetic basis and a unidirectional causal link from T2D to AP, highlighting pleiotropic genes and key pathways involved in lipid and cholesterol metabolism. These findings suggest that individuals with high genetic risk for T2D may benefit from targeted pancreatic monitoring and triglyceride management. The lack of reverse causality underscores the importance of distinguishing between classic T2D and diabetes secondary to pancreatitis in clinical practice.
Keywords
INTRODUCTION
Acute pancreatitis (AP) and diabetes mellitus (DM) represent two major public health burdens worldwide and are increasingly recognized as closely interrelated conditions. Accumulating epidemiological evidence indicates that individuals with AP are at significantly increased risk of developing DM[1,2]. Conversely, patients with pre-existing type 2 diabetes (T2D) also exhibit a higher incidence of AP. Recent large-scale cohort studies and meta-analyses have further highlighted this complex, bidirectional association between these two conditions[3]. Notably, T2D accounted for 97.1%[4] of all new adult-onset diabetes cases, making it the predominant form of diabetes implicated in this comorbidity.
This interplay is underpinned by several shared pathogenic mechanisms, with metabolic dysregulation, manifested as obesity and hypertriglyceridemia, representing a prominent common risk factor driving subsequent target organ damage[5,6]. This metabolic dysregulation not only contributes to pancreatic beta-cell dysfunction and insulin resistance, the cardinal features of T2D, but is also a well-established cause of AP, with hypertriglyceridemia serving as a primary mechanism of pancreatic injury. Beyond metabolic insults, bidirectional endocrine-exocrine crosstalk plays a critical role: inflammatory mediators released during pancreatitis [e.g., interleukin (IL)-1β, tumor necrosis factor-α (TNF-α)] can impair beta-cell function and induce insulin resistance[7,8], while diabetic hyperglycemia and hyperinsulinemia may exacerbate acinar injury and pancreatic fibrosis[9-11]. Thus, the pancreas functions as an integrated organ in which dysfunction in one compartment often precipitates or amplifies disease in the other. Despite these established clinical and pathophysiological links, the shared genetic architecture and the causal directionality between AP and T2D remain largely elusive.
To date, large-scale genome-wide association studies (GWASs) have uncovered single-nucleotide polymorphisms (SNPs) associated with AP[12] and T2D[13], providing an unprecedented opportunity to dissect their shared genetic basis. Recently, similar multilayered genomic approaches have successfully delineated the shared genetic architecture between T2D and other metabolic comorbidities, such as muscle loss and frailty[14]. In this study, we performed a comprehensive genetic analysis to investigate the pleiotropy and causality between AP and T2D. Specifically, we hypothesize that the genetic predisposition to T2D increases AP susceptibility, potentially mediated through metabolic disturbances. To test this hypothesis, we aim to: (1) quantify their genome-wide genetic correlation; (2) identify pleiotropic SNPs jointly associated with both traits; (3) map these SNPs to independent genomic loci and candidate genes, construct a protein-protein interaction (PPI) network to identify key hub genes, and perform functional enrichment analyses to systematically uncover shared biological pathways; and (4) evaluate bidirectional causal relationships using Mendelian randomization (MR) to determine the direction of genetic influence. Our findings are expected to unveil the shared genetic underpinnings of AP and T2D and provide novel insights into the etiology of their frequent co-occurrence.
METHODS
Overview
This study aimed to systematically elucidate the shared genetic architecture and causal relationship between AP and T2D. The analytical workflow comprised four sequential steps [Figure 1]: (1) estimating the genome-wide genetic correlation between AP and T2D using linkage disequilibrium score regression (LDSC); (2) identifying pleiotropic SNPs jointly associated with both traits using the pleiotropy analysis under the composite null hypothesis (PLACO); (3) annotating the pleiotropic SNPs to independent genomic loci and candidate genes using the functional mapping and annotation (FUMA) platform, followed by PPI network construction, hub gene identification, and systematic functional enrichment analyses (Gene Ontology, GO and Kyoto Encyclopedia of Genes and Genomes, KEGG); and (4) evaluating the direction of causal relationships using bidirectional two-sample MR analysis.
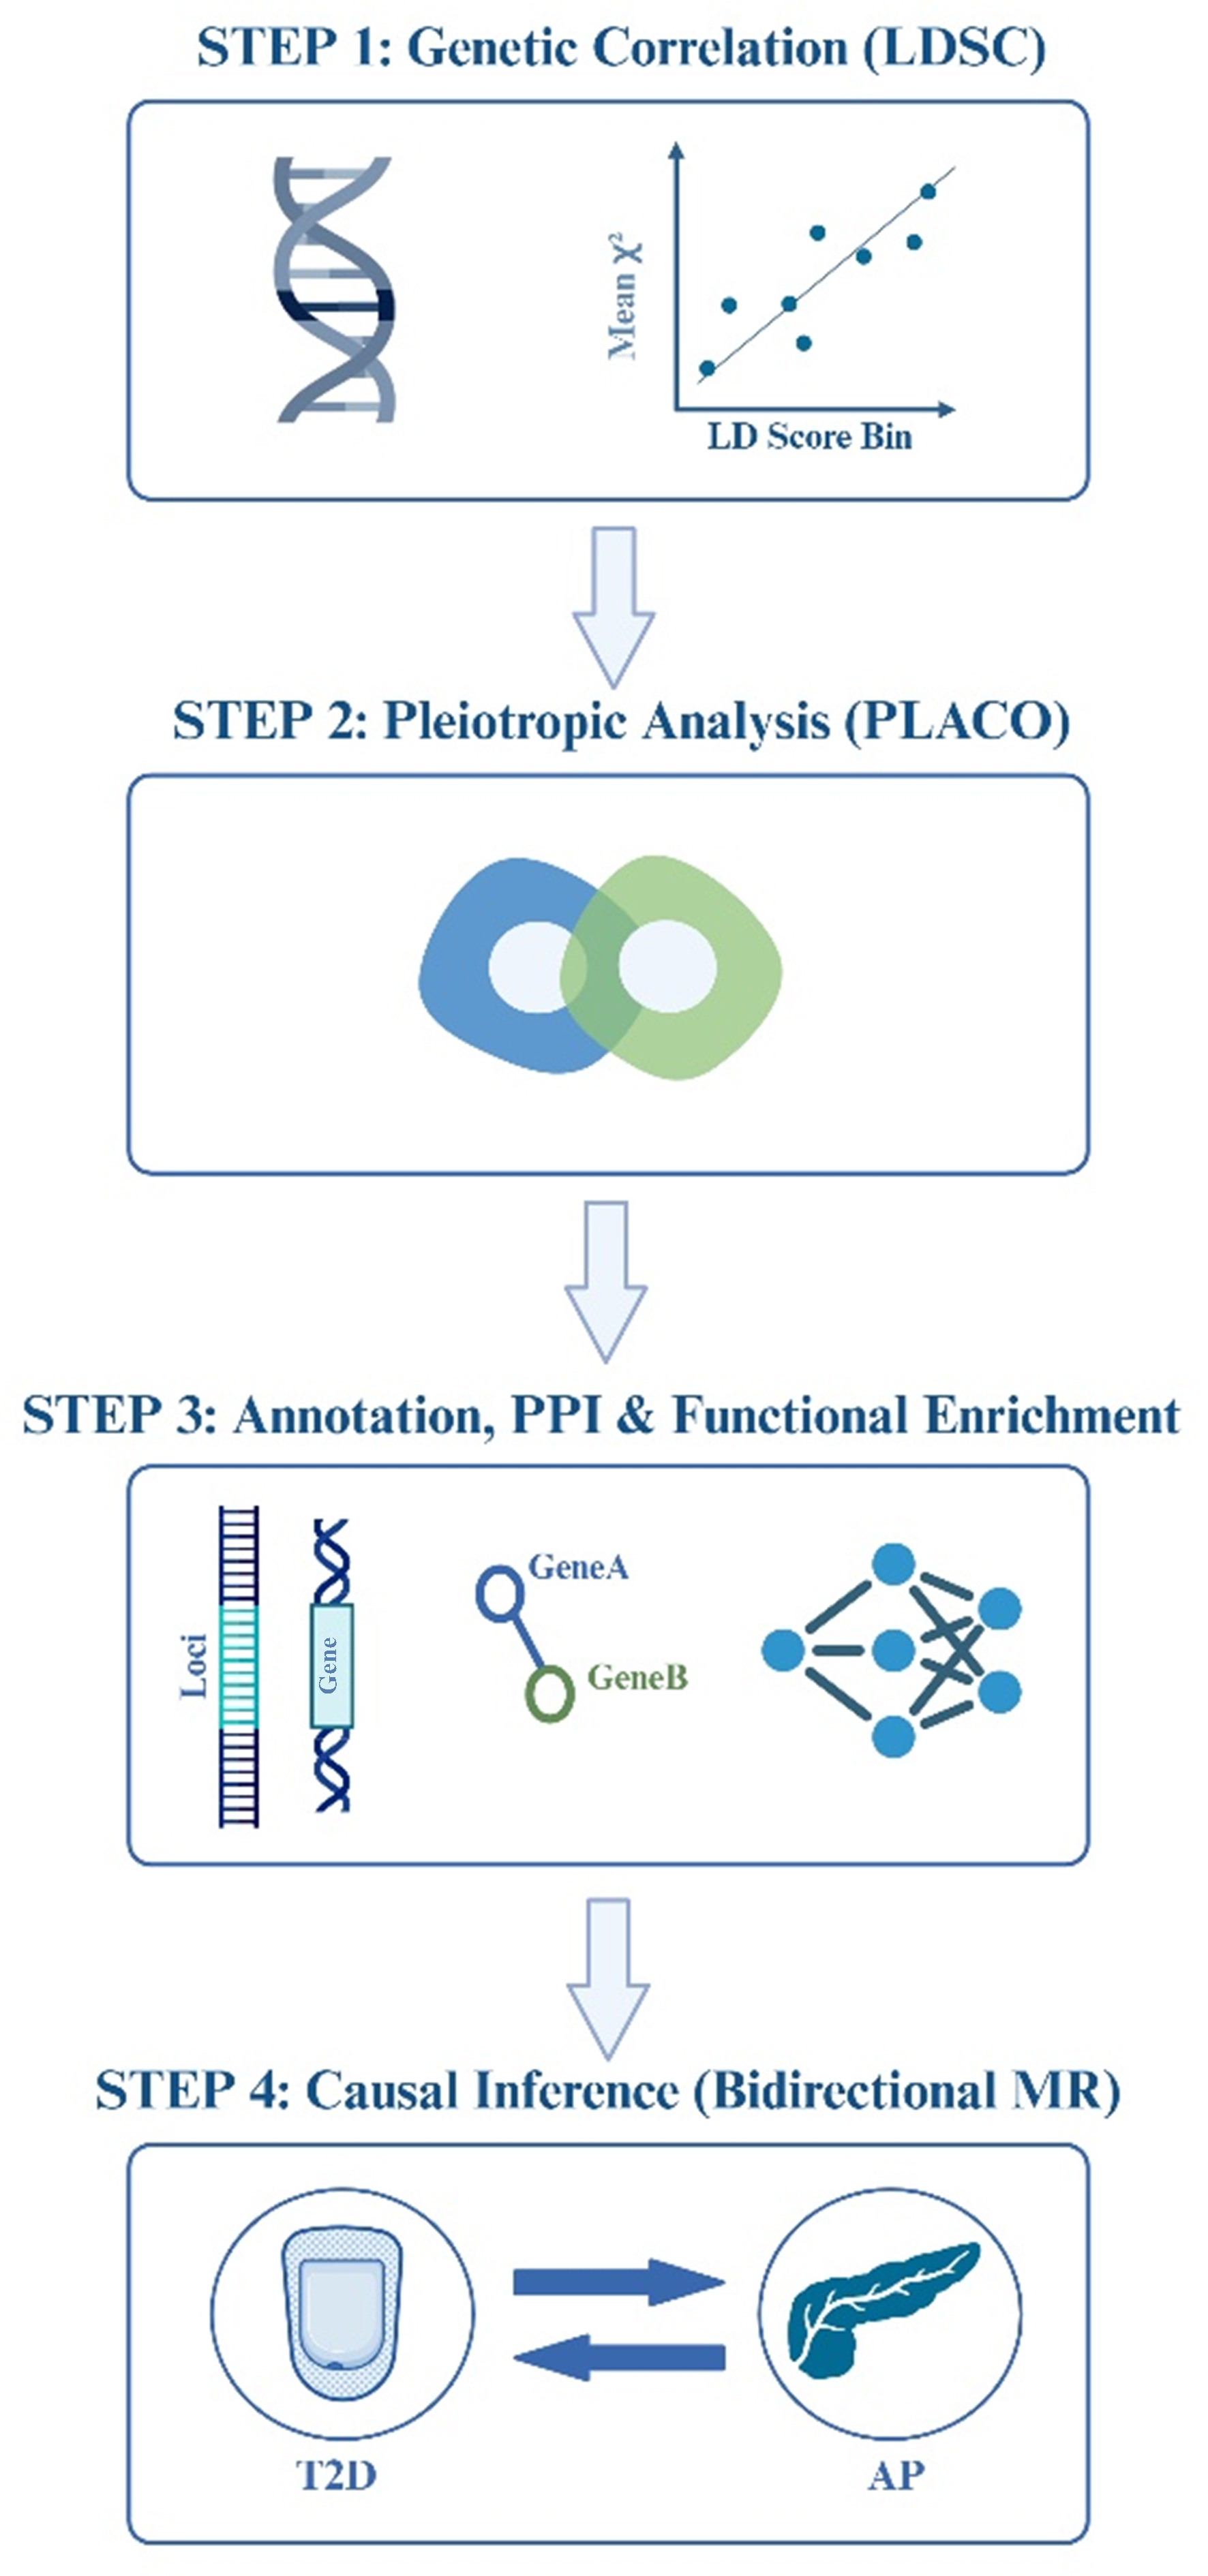
Figure 1. Analytical workflow. A four-step analytical workflow for investigating the genetic relationship between AP and T2D. The four steps span genetic correlation, pleiotropic SNP identification, gene annotation with network and functional enrichment analyses, and causal relationship assessment. The figure was created by BioRender.com (https://BioRender.com/5brb66n). AP: Acute pancreatitis; T2D: type 2 diabetes; SNP: single-nucleotide polymorphism; LDSC: linkage disequilibrium score regression; LD: linkage disequilibrium; PLACO: pleiotropy analysis under the composite null hypothesis; PPI: protein-protein interaction; MR: Mendelian randomization.
GWAS data sources
All analyses used publicly available summary-level data from GWAS conducted in individuals of European ancestry. Steps were taken to ensure no sample overlap between the AP and T2D datasets.
AP data
Summary statistics for AP (defined by ICD-10 code K85) were obtained from the whole-genome sequencing (WGS)-based genome-wide association analysis conducted by the UK Biobank Whole-Genome Sequencing Consortium (GCST90473884)[12]. This dataset included a total of 458,440 individuals (4,688 cases and 453,752 controls) of non-Finnish European ancestry. The use of WGS data ensured comprehensive variant coverage, including rare and structural variants. These summary statistics are publicly available for download from the EBI GWAS Catalog (https://www.ebi.ac.uk/gwas/studies/GCST90473884).
T2D data
Summary-level data for T2D were obtained from the DIAGRAM (DIAbetes Genetics Replication And Meta-analysis) consortium’s European ancestry meta-analysis (https://diagram-consortium.org/index.html)[13]. To avoid any sample overlap with the AP GWAS data (derived from the UK Biobank), we specifically utilized the summary statistics file excluding UK Biobank samples (Mahajan.NatGenet2018b.T2D-noUKBB.European). This curated subset comprised 455,313 individuals of European ancestry. Importantly, we used the GWAS version of “unadjusted for BMI”. This dataset was selected to prevent potential mediator or collider bias introduced by BMI, enabling accurate estimation of the total genetic effect of T2D.
Statistical analysis
Genetic correlation analysis
We estimated the genome-wide genetic correlation (rg) between AP and T2D using LDSC. European ancestry linkage disequilibrium (LD) information from the 1000 Genomes Project served as the reference panel. As this analysis involved a single trait pair, statistical significance of the genetic correlation was directly assessed using the P-value derived from the LDSC analysis. A P-value < 0.05 was considered statistically significant. A significant genetic correlation would justify designating the AP-T2D pair as a linkage pair for subsequent pleiotropic analysis.
Identification of pleiotropic SNPs and loci
The PLACO method was applied to detect SNPs showing significant associations with both AP and T2D, indicative of pleiotropy[15]. Only SNPs present in the summary statistics of both traits were included. A stringent significance threshold of PPLACO < 5 × 10⁻⁸ was applied. Significant pleiotropic SNPs were subsequently annotated to independent genomic loci using the FUMA platform with default parameters.
Functional annotation and PPI network analysis
Functional annotation and gene mapping
The identified pleiotropic SNPs and genomic loci were functionally annotated using the FUMA platform[16]. This process included:
Variant Annotation: All SNPs were annotated for their genomic context [e.g., coding, Untranslated Region (UTR), intronic, intergenic], regulatory potential based on chromatin state data (ENCODE/Roadmap Epigenomics), and predicted functional impact scores [e.g., Combined Annotation Dependent Depletion (CADD) score].
Gene Mapping: Candidate causal genes were assigned to each locus based on three complementary strategies: (1) Positional mapping, which included all protein-coding genes within a predefined physical window; (2) Expression quantitative trait locus (eQTL) mapping, utilizing significant variant-gene associations from the comprehensive GTEx v8 database (incorporating all 54 tissue types and 30 general tissue types, such as gtex_v8_ts_avg_log2TPM) to capture unbiased pleiotropic expression signals; and (3) Chromatin interaction mapping, incorporating promoter capture Hi-C data to link regulatory variants to their potential distal target genes.
PPI Network Construction and Hub Gene Identification: To explore the functional associations and identify key regulators among the prioritized candidate genes, a PPI network was constructed using the STRING database (version 12.0). The resulting PPI network was then imported into Cytoscape (version 3.10.4) for visualization and further topological analysis. Within Cytoscape, the CytoHubba plugin was employed to identify hub genes - genes that occupy central and influential positions within the network. Hub genes were primarily identified by ranking all nodes based on the Maximal Clique Centrality (MCC) algorithm. The MCC score, which identifies key nodes by assessing their involvement in the network’s largest interconnected clusters (cliques), was selected due to its high efficacy in detecting functionally essential genes within biological networks. Genes ranked in the top 10 by MCC score were defined as the key hub genes.
Functional enrichment analysis
To identify biological pathways enriched by the prioritized pleiotropic genes, GO biological process (BP) and KEGG pathway enrichment analyses were performed. A false discovery rate (FDR)-adjusted P-value < 0.05 was considered statistically significant.
Bidirectional MR analysis
Two-sample MR was used to assess bidirectional causal relationships between AP and T2D. Genetic instruments (SNPs) for each exposure were selected based on the following criteria: genome-wide significance (P < 5 × 10⁻⁶), independence (LD r2 < 0.001 within a 10,000 kb clumping window), and sufficient instrument strength. The strength of each instrument was assessed using the F-statistic, calculated using[17]:
where n is the sample size of the exposure dataset, k is the number of SNPs, and R2 is the portion of exposure variance explained by the genetics. We calculated the R2 using[18]:
Only SNPs with F > 10 were retained. An F-statistic > 10 empirically indicates a strong instrumental variable (IV), thereby minimizing the risk of weak instrument bias. To further substantiate the reported causal direction and empirically ensure that the IVs explained significantly more variance in the exposure than the outcome, the MR Steiger directionality test was performed.
The primary causal estimate was derived using the inverse-variance weighted (IVW) method under a random-effects model. To assess robustness and potential pleiotropy, we applied complementary methods, including the weighted median[19], MR-Egger[20], simple mode, and weighted mode estimators. Sensitivity analyses were conducted to evaluate heterogeneity and horizontal pleiotropy. Cochran’s Q test was used to assess heterogeneity across IVs. The MR-Egger intercept test and MR-PRESSO global test were applied to detect and correct for horizontal pleiotropy. Additionally, leave-one-out analysis was performed to determine whether causal estimates were driven by any single SNP.
RESULTS
Genome-wide genetic correlation between AP and T2D
To assess the shared genetic basis between AP and T2D, we first performed LDSC. The analysis revealed a significant positive genetic correlation between AP and T2D [rg = 0.415, standard error (SE) = 0.082, P = 4.73 × 10⁻⁷]. This finding suggests a moderate yet statistically robust shared genetic architecture between AP and T2D.
Identification of pleiotropic SNPs
We next applied PLACO to identify SNPs jointly associated with both AP and T2D. This analysis identified 73 SNPs that reached genome-wide significance for pleiotropy (PPLACO < 5 × 10⁻⁸) [Supplementary Table 1 and Supplementary Figure 1].
Annotation of independent pleiotropic loci and candidate gene mapping
To delineate the shared genomic architecture, the 73 pleiotropic SNPs were annotated and clustered into independent loci using the FUMA platform. This process defined 12 independent genomic risk loci [Supplementary Table 2]. Within these loci, a total of 23 candidate genes were initially mapped. Of these, 22 candidate genes were prioritized based on the strength of the genetic association signal within their respective loci [Table 1]. TCF7L2 exhibited the most significant pleiotropic association. Other top-ranked genes included IGF2BP2, GCKR, and a gene cluster on chromosome 19 encompassing APOE, APOC1, and TOMM40.
Candidate pleiotropic genes mapped from shared genomic loci between AP and T2D
| Ensembl ID | Gene symbol | CADD score | minGwasP |
| ENSG00000148737 | TCF7L2 | 21.7 | 9.02 × 10⁻²¹ |
| ENSG00000084734 | GCKR | 13.22 | 2.78 × 10⁻¹¹ |
| ENSG00000130204 | TOMM40 | 21.1 | 1.42 × 10⁻¹¹ |
| ENSG00000130203 | APOE | 12.64 | 1.42 × 10⁻¹¹ |
| ENSG00000130208 | APOC1 | 12.64 | 1.42 × 10⁻¹¹ |
| ENSG00000073792 | IGF2BP2 | 13.44 | 1.16 × 10⁻¹² |
| ENSG00000145996 | CDKAL1 | 21.3 | 1.60 × 10⁻¹⁰ |
| ENSG00000140718 | FTO | 10.57 | 2.29 × 10⁻⁸ |
| ENSG00000152804 | HHEX | 11.84 | 2.15 × 10⁻⁸ |
| ENSG00000153814 | JAZF1 | 8.54 | 8.95 × 10⁻⁹ |
| ENSG00000136267 | DGKB | 8.67 | 3.81 × 10⁻⁸ |
| ENSG00000130202 | PVRL2 | 21.1 | 5.32 × 10⁻⁹ |
| ENSG00000115211 | EIF2B4 | 2.38 | 5.67 × 10⁻⁹ |
| ENSG00000115234 | SNX17 | 2.38 | 5.67 × 10⁻⁹ |
| ENSG00000163795 | ZNF513 | 2.38 | 5.67 × 10⁻⁹ |
| ENSG00000115241 | PPM1G | 2.38 | 5.67 × 10⁻⁹ |
| ENSG00000165066 | NKX6-3 | 6.27 | 1.12 × 10⁻⁸ |
| ENSG00000158669 | AGPAT6 | 10.02 | NA |
| ENSG00000198876 | DCAF12 | 1.97 | NA |
| ENSG00000119912 | IDE | 3.68 | NA |
| ENSG00000138160 | KIF11 | 14.57 | NA |
| ENSG00000169783 | LINGO1 | 12.7 | NA |
PPI network and hub gene analysis
To elucidate the functional relationships among the 22 candidate pleiotropic genes, a PPI network was constructed using the STRING database. The resulting network contained 22 nodes (genes) connected by 46 edges, representing significant functional associations [Figure 2]. The network exhibited a high average node degree (4.18) and local clustering coefficient (0.629), indicating a densely interconnected structure. Notably, the PPI enrichment (P < 1.0 × 10⁻¹⁶) confirmed that the observed interactions are significantly greater than expected by chance, strongly supporting the biological coherence of this gene set.
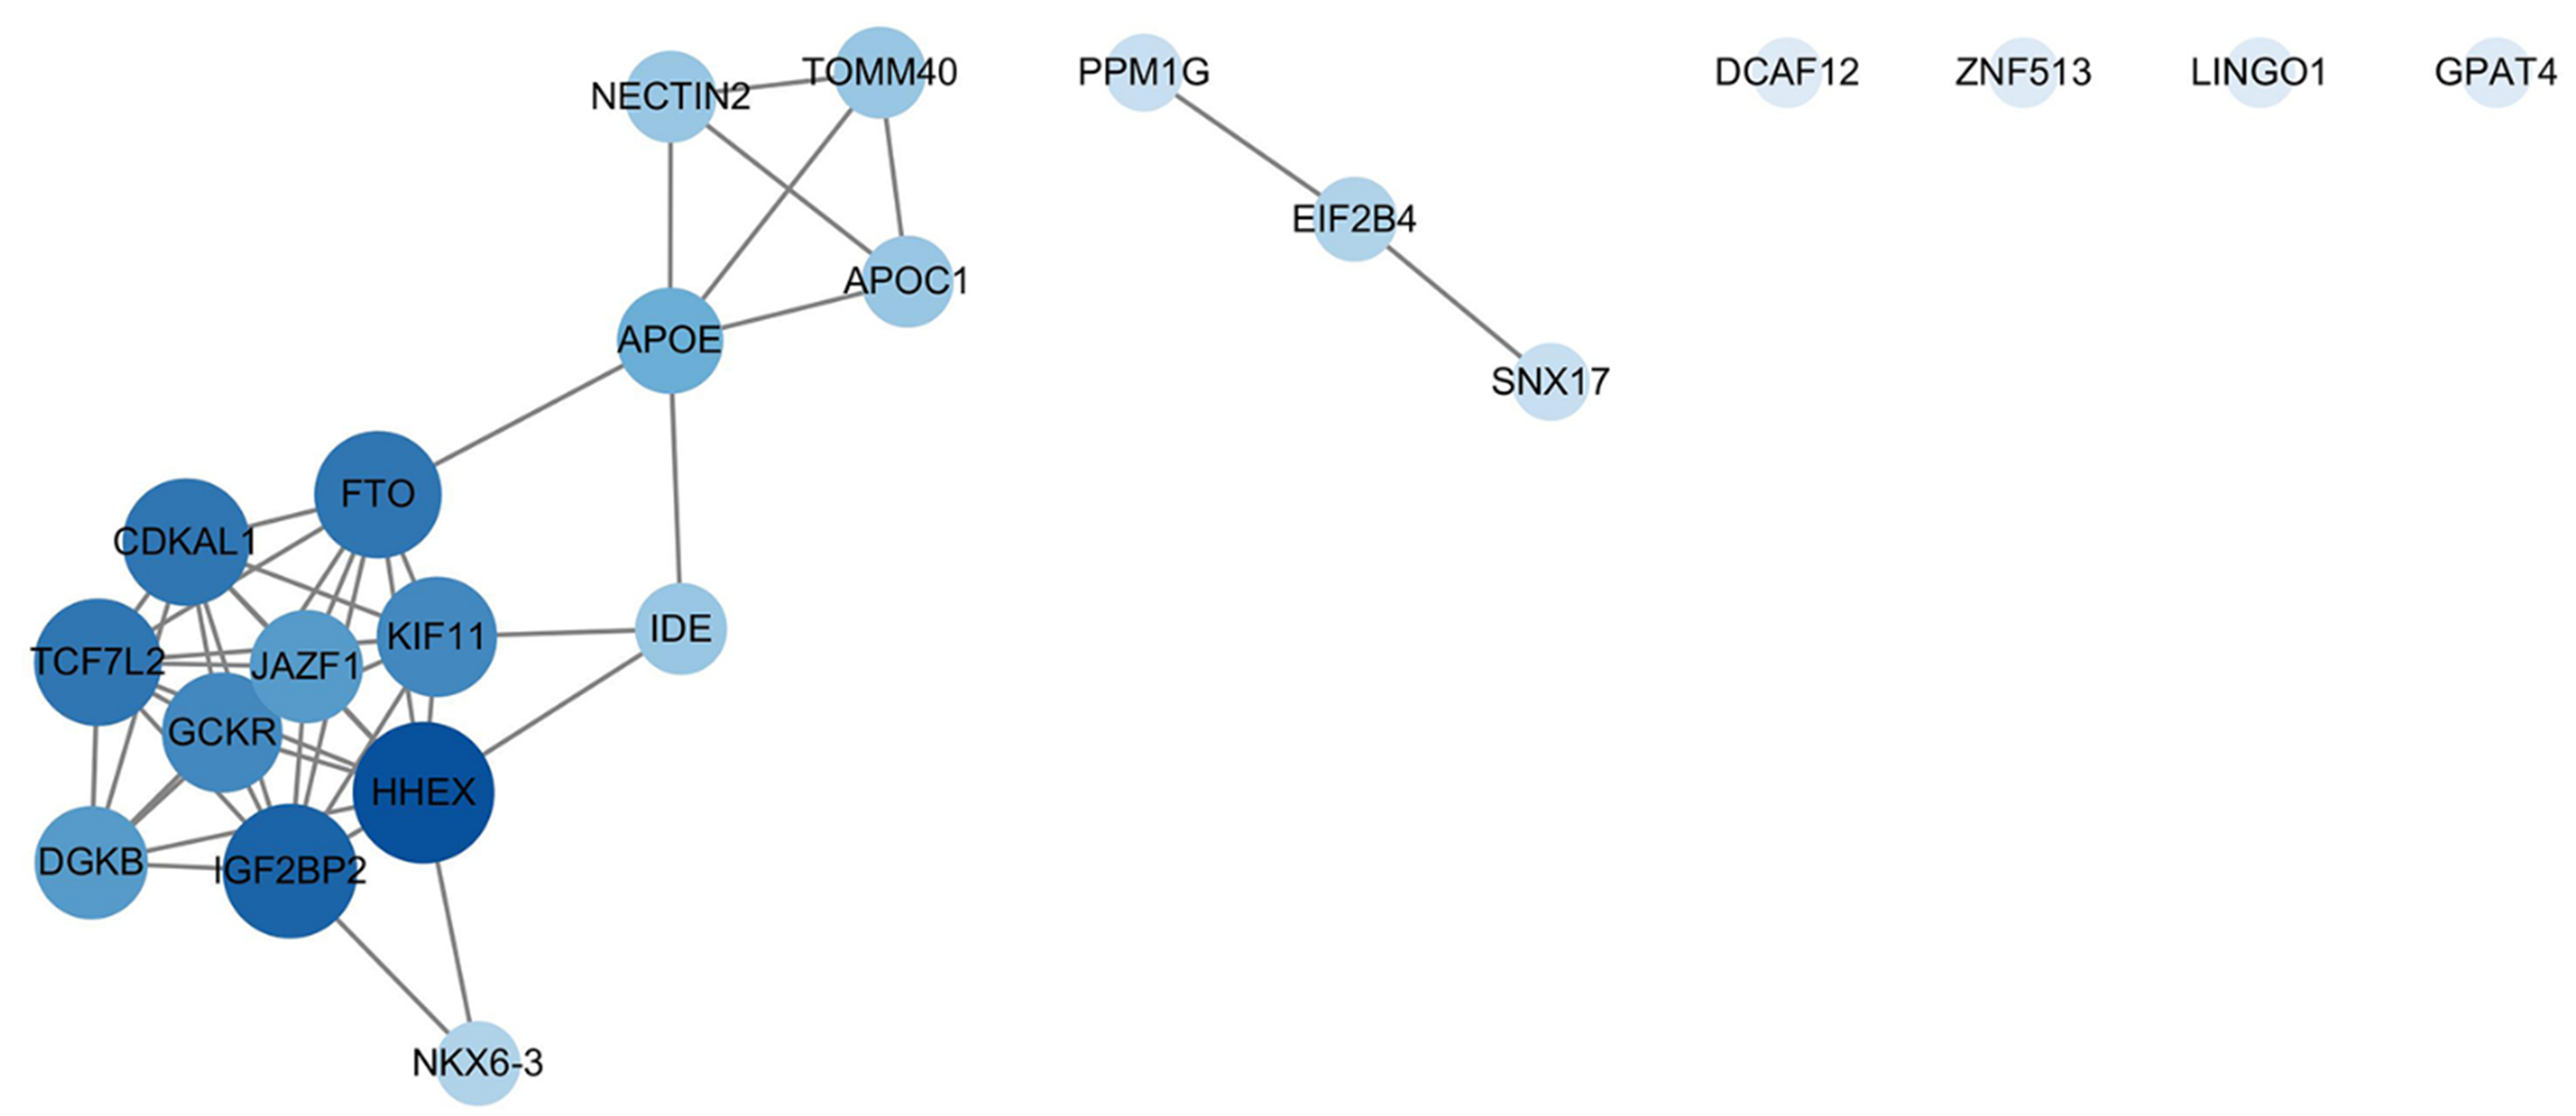
Figure 2. PPI network analysis of candidate pleiotropic genes. The network depicts functional interactions among the 22 candidate genes mapped from shared genomic loci. Nodes represent genes, and edges represent known or predicted functional associations from the STRING database. The size and color intensity of each node are proportional to its degree centrality - a measure of connectedness within the network - with larger, darker nodes indicating more highly interconnected hub genes. The network exhibits significant interconnectivity (PPI enrichment P < 1.0 × 10⁻¹⁶), highlighting key hub genes such as HHEX and a distinct functional module containing APOE, APOC1, and TOMM40. This network visualization was generated using Cytoscape (version 3.10.4). PPI: Protein-protein interaction; STRING: Search Tool for the Retrieval of Interacting Genes/Proteins.
Topological analysis of the network identified key hub genes central to the network’s overall connectivity. Based on the MCC algorithm, HHEX, IGF2BP2, CDKAL1, and TCF7L2 were ranked as the top hub genes [Supplementary Table 3]. Furthermore, a distinct, tightly interconnected module on chromosome 19, comprising APOE, APOC1, and TOMM40, was evident within the network, underscoring the shared role of lipid metabolism and mitochondrial function in AP and T2D. Additional genes such as GCKR and FTO also demonstrated high connectivity, serving as key connectors within the overall network architecture.
Functional enrichment highlights lipid metabolism
To link the genetic findings to underlying biological mechanisms, we performed GO and KEGG enrichment analyses on the 22 candidate pleiotropic genes [Supplementary Figure 2]. The findings revealed significant enrichment in lipid and metabolic pathways. KEGG analysis identified “Cholesterol metabolism” [hsa04979, adjusted P-value (P.adj) = 0.036] as the most significantly enriched pathway. Similarly, GO BP analysis highlighted crucial pathways including “phospholipid efflux” (GO:0033700), “neutral lipid metabolic process” (GO:0006638), “acylglycerol metabolic process” (GO:0006639), and the negative regulation of phosphate and phosphorus metabolic processes (all P.adj < 0.05). These enrichments were predominantly driven by APOE, APOC1, GCKR, and HHEX genes, corroborating the hypothesis that genetically driven lipid dysregulation is a core shared mechanism between T2D and AP.
Bidirectional MR analysis reveals an asymmetric causal relationship
To dissect the causal direction underlying the observed genetic correlation, we performed bidirectional two-sample MR analyses between AP and T2D.
Genetically predicted T2D was causally associated with increased risk of AP. Using 104 independent genetic variants as IVs (Supplementary Table 4, all F-statistics > 10), the primary IVW method revealed that genetic predisposition to T2D was associated with an 8.0% increase in the odds of AP [odds ratio (OR) = 1.08, 95% confidence interval (CI): 1.00-1.16, P = 0.040]. The direction of effect was consistent across complementary MR methods, with the weighted median approach yielding a significant estimate (OR = 1.14, 95%CI: 1.02-1.26, P = 0.018) [Figure 3 and Supplementary Figure 3A]. Sensitivity analyses supported the robustness of this causal inference. Although Cochran’s Q test indicated moderate heterogeneity (P = 0.017), there was no significant evidence of horizontal pleiotropy (MR-Egger intercept P = 0.477). The MR-PRESSO analysis found no significant outliers (P = 0.356), and leave-one-out analysis confirmed that the overall effect was not driven by any single influential SNP. Importantly, the Steiger directionality test empirically confirmed our causal assumption: the IVs for T2D explained significantly more variance in T2D (R2 = 1.34%) than in AP (R2 = 0.03%), yielding a highly significant correct causal direction (PSteiger < 0.001).
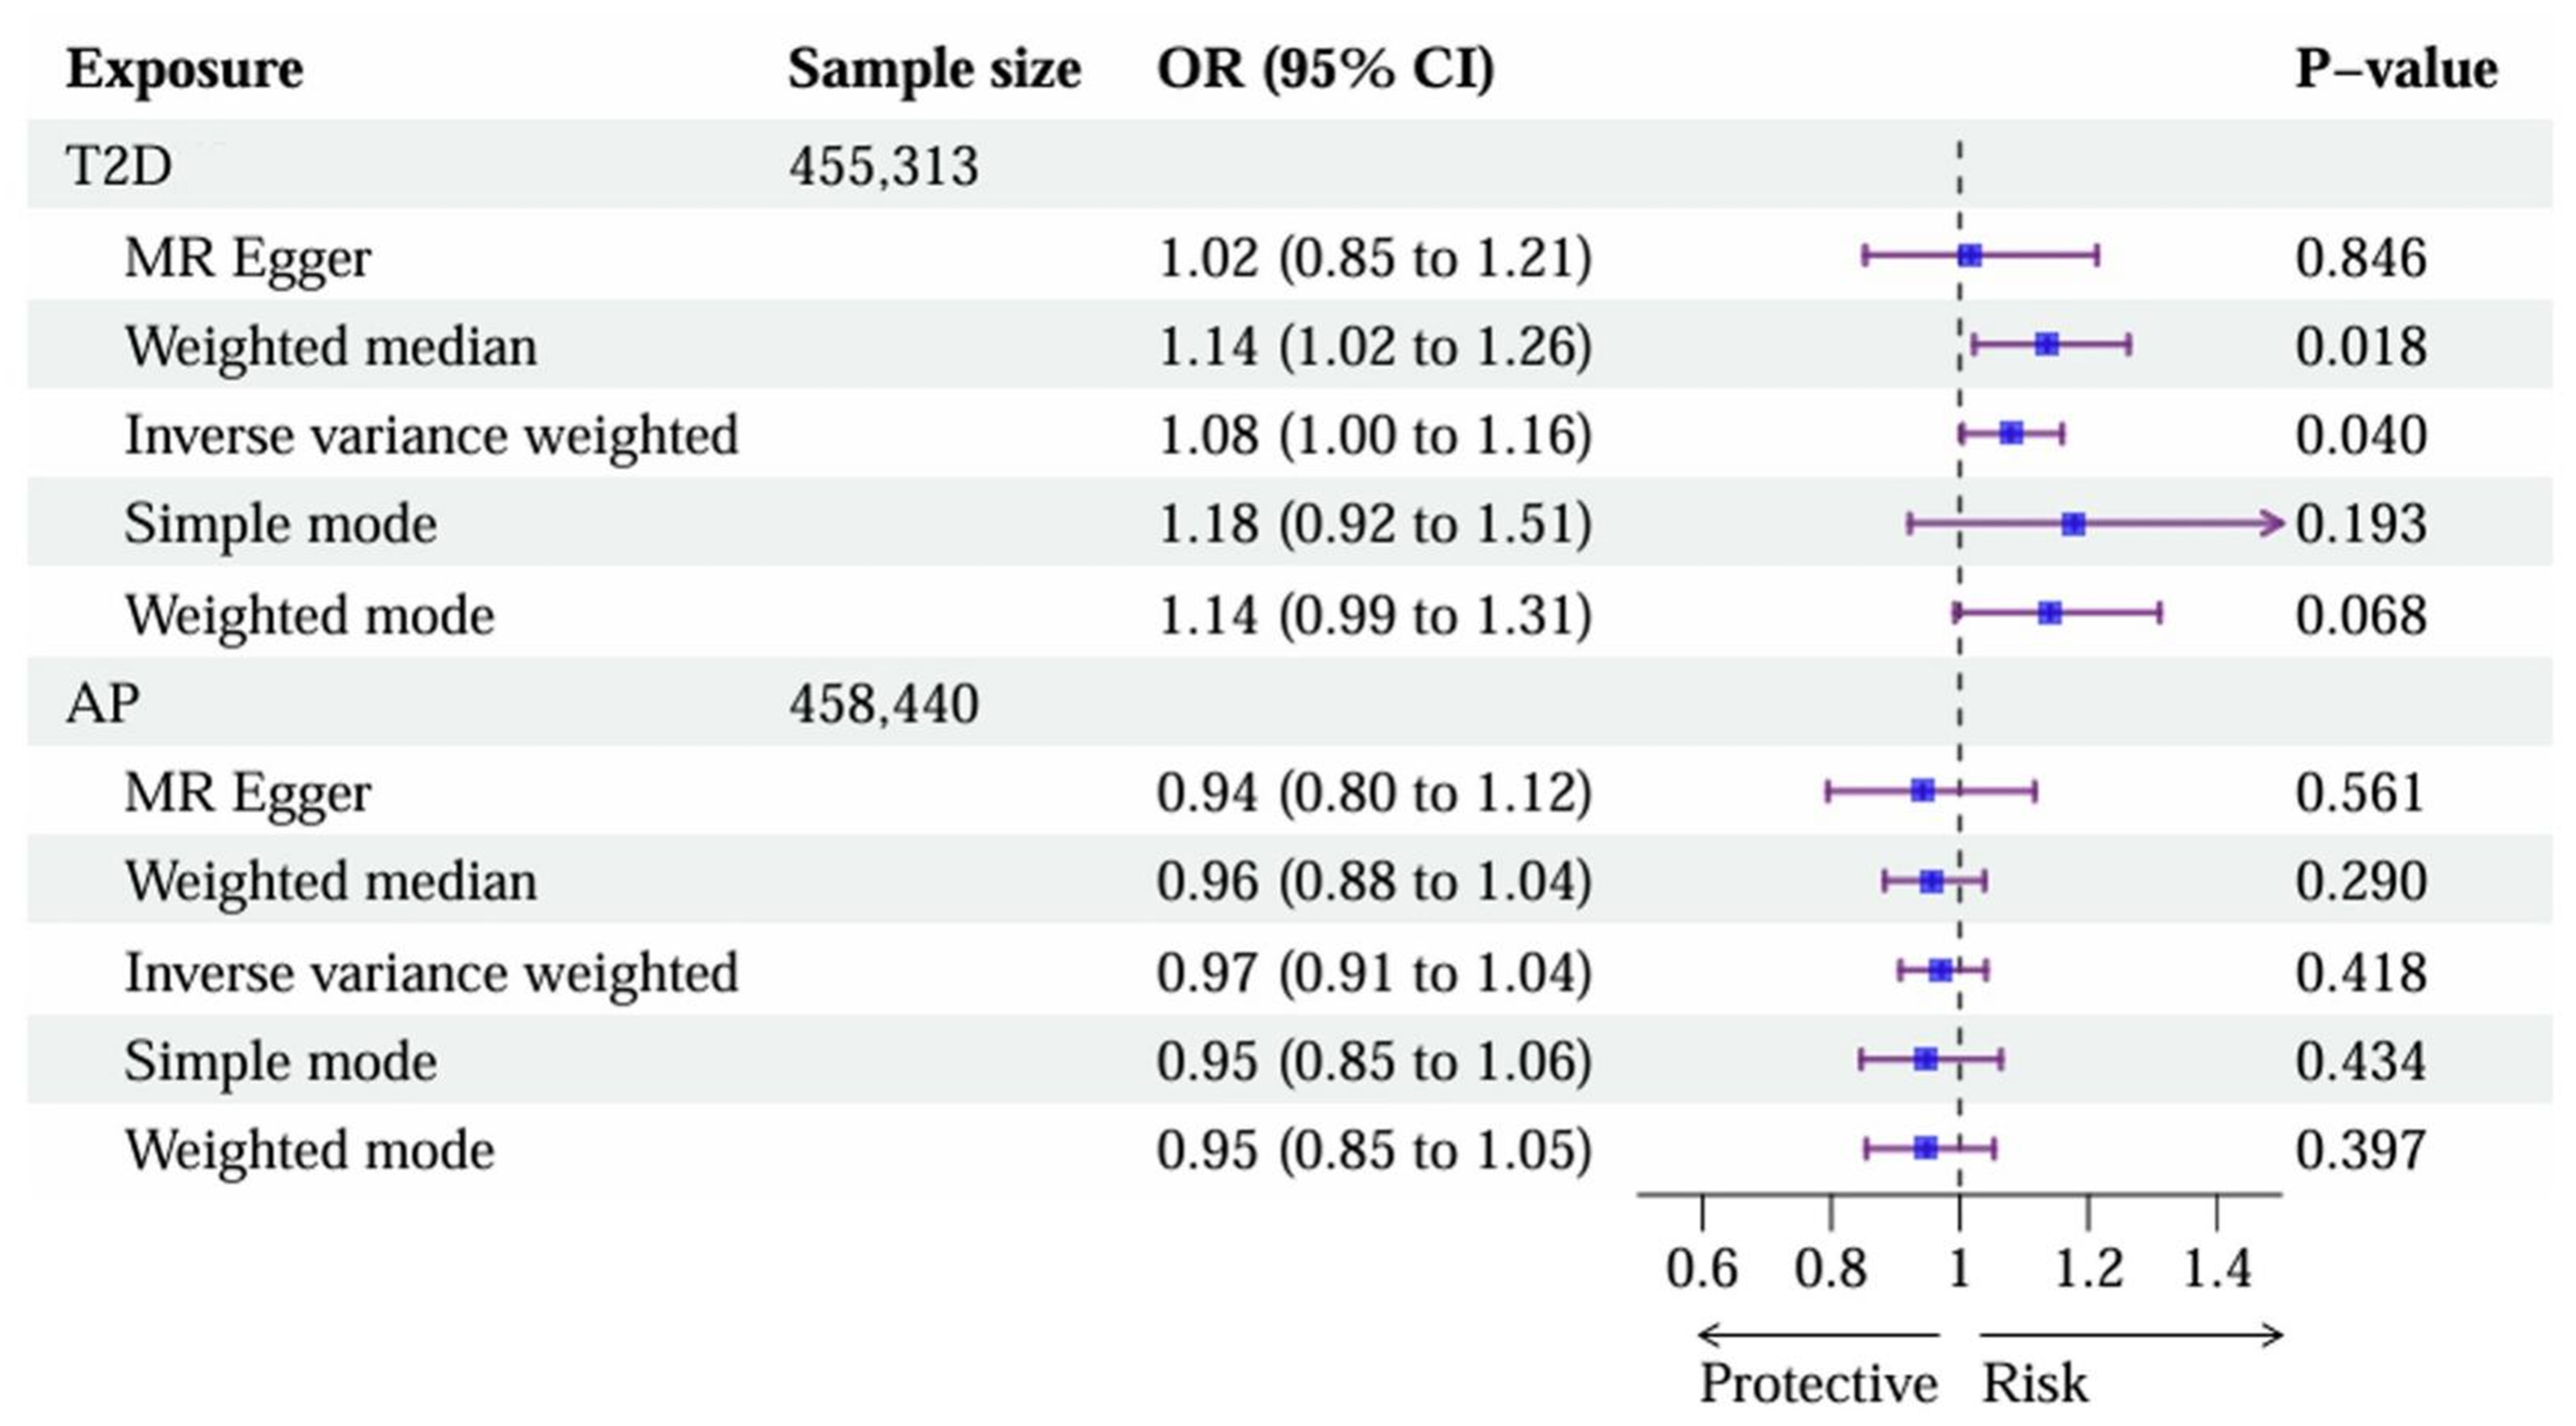
Figure 3. An asymmetric causal link from T2D to AP revealed by MR. The forest plot presents the ORs and 95%CIs for the causal effects in two directions: (1) the effect of T2D on AP and (2) the effect of AP on T2D. Statistical methods: Causal estimates were derived primarily using the IVW method under a random-effects model. All P-values are two-sided. T2D: Type 2 diabetes; AP: acute pancreatitis; MR: Mendelian randomization; ORs: odds ratios; CIs: confidence intervals; IVW: inverse-variance weighted.
In contrast, we found no statistically significant evidence for a reverse causal effect of AP on T2D. Using 4 independent genetic instruments for AP (Supplementary Table 5, all F-statistics > 10), the IVW estimate showed no statistically significant causal effect (OR = 0.97, 95%CI: 0.91-1.04, P = 0.418). All sensitivity analyses yielded consistently non-significant results, with no evidence of heterogeneity (Cochran’s Q P = 0.460) or directional pleiotropy (MR-Egger intercept P = 0.724) [Figure 3 and Supplementary Figure 3B].
Collectively, these MR results revealed an asymmetric causal relationship: genetic predisposition to T2D confers a causal risk for developing AP, whereas genetic liability to AP does not appear to causally influence T2D risk.
DISCUSSION
In this genetic study, we systematically dissected the shared etiology between AP and T2D through a multilayer analytical framework. Our principal findings include: (1) a significant positive genetic correlation between AP and T2D; (2) 73 pleiotropic SNPs across 12 independent loci, pinpointing 22 candidate genes; (3) the construction of a highly interconnected PPI network with key hub genes and a distinct functional module; and (4) an asymmetric causal relationship, demonstrating that genetic predisposition to T2D confers risk for AP, but not vice versa. These results collectively advance our understanding of the genetic nexus linking metabolic dysregulation to pancreatic inflammation.
Shared genetic architecture and pleiotropic hubs
The robust genome-wide genetic correlation between AP and T2D (rg = 0.415, SE = 0.082, P = 4.73 × 10⁻⁷), corroborated by the identification of 12 independent pleiotropic risk loci and 22 candidate genes [Table 1], confirms that a substantial portion of the observed clinical co-occurrence is rooted in shared genetic factors, beyond common environmental exposures. The pleiotropic loci we identified converge on biological pathways central to both diseases. Notably, TCF7L2, the top-ranked gene, reaffirms the pivotal role of Wnt signaling and pancreatic beta-cell dysfunction[21]. The PPI network analysis further transformed this list of candidate genes from a static catalog into a dynamic functional map. The identification of HHEX, IGF2BP2, CDKAL1, and TCF7L2 as network hubs suggests these genes act as critical regulators within the shared genetic program, potentially orchestrating downstream effects on insulin secretion, cell proliferation, and inflammatory responses.
The APOE/APOC1/TOMM40 cluster: a nexus of lipid metabolism and mitochondrial integrity
A particularly notable finding is that the APOE/APOC1/TOMM40 gene cluster on chromosome 19 forms a tightly interconnected module within the pleiotropic PPI network [Figure 2]. This module is not merely a bystander but represents a functional module with direct relevance to the pathophysiology of both conditions. APOE is a master regulator of lipoprotein metabolism, with alleles influencing circulating triglyceride levels[22], a well-established, direct trigger for AP. Simultaneously, APOE expression in macrophages regulates inflammation and tissue repair via extracellular vesicles[23]. Mitochondrial dysfunction is implicated in both insulin resistance in T2D[24] and in acinar cell injury and necrosis during AP[25]. TOMM40, encoding an essential mitochondrial import subunit, sits at the crossroads of these pathways, as it is crucial not only for organellar function but also for modulating hepatic lipid and plasma lipoprotein
Directional causality and pathophysiological implications
The bidirectional MR analysis yielded a clear and asymmetric causal inference [Figure 3]: genetic predisposition to T2D significantly increased AP risk, whereas genetic liability to AP did not significantly alter T2D risk. This asymmetry provides genetic evidence to reframe the clinical AP-DM relationship. We propose a two-hit model in which T2D-associated genetic variants establish a baseline state of metabolic vulnerability. This vulnerability compromises the exocrine ability of the pancreas to withstand secondary insults, thereby lowering the threshold for developing pancreatitis. Specific variants in genes such as GCKR (influencing hepatic lipid and glucose metabolism)[27] and FTO (linked to adiposity)[28] exemplify genetic factors that may predispose individuals to this vulnerable state. The lack of a reverse causal effect suggests that the development of DM following AP is not driven by the common genetic variants that predispose to AP itself. This supports the understanding that diabetes of the exocrine pancreas (DEP) is largely a sequela of anatomical and inflammatory pancreatic damage, distinguishing it etiologically from classic T2D. This distinction is important for accurate disease classification and management.
Clinical translation and the potential of genetic risk scoring
Our findings have direct translational implications. First, they reinforce that intensive management of shared modifiable risk factors is paramount in individuals with or at high genetic risk for T2D, as it may prevent both T2D progression and AP episodes. Second, the identified pleiotropic genes and pathways reveal potential targets for novel therapeutic strategies aimed at enhancing metabolic resilience and reducing pancreatic inflammation. Importantly, our findings lay the groundwork for implementing polygenic risk scores (PRS) in clinical risk stratification. A PRS derived from the T2D risk-increasing alleles identified here could be used to identify a subset of diabetic patients, or even high-risk prediabetic individuals, who carry an exceptionally high genetic burden associated with AP risk. This genetically high-risk cohort could benefit from targeted surveillance (e.g., periodic pancreatic enzyme or triglyceride checks), personalized lifestyle interventions, and earlier pharmacologic management of lipids, moving toward a paradigm of genetically informed prevention of pancreatitis.
Several limitations of our study should be acknowledged to ensure a comprehensive interpretation of the findings. First, our analyses were restricted to GWAS summary statistics from European ancestry populations. While this restriction minimized population stratification bias, it inherently limits the generalizability of our findings to non-European ancestry groups. Given the known differences in lipid metabolism and diabetes prevalence across global populations, future multi-ancestry GWAS and cross-ethnic meta-analyses are warranted. Second, although we conducted extensive MR sensitivity analyses, there was a notable disparity in the number of IVs used (104 for T2D vs. only 4 for AP). This limited number of instruments for AP significantly constrained the statistical power of the reverse MR analysis. Therefore, while our data suggest a lack of reverse causality (AP leading to T2D), this null finding should be interpreted with caution until larger, better-powered AP GWAS datasets become available. Third, our study identified associations and provided causal estimates at the population level, but it did not include experimental validation. The precise biological mechanisms and cooperative regulatory networks through which these specific variants (e.g., the APOE/APOC1/TOMM40 cluster) exert their pleiotropic effects cannot be fully resolved through in silico analyses alone. Functional follow-up studies, particularly those utilizing Clustered Regularly Interspaced Short Palindromic Repeats-edited cellular models (CRISPR-edited cellular models), single-cell multi-omics of the human pancreas, and cell-type-specific investigations, are highly warranted to link these genetic findings to underlying biological mechanisms. Finally, while we employed robust methods to minimize confounding variables, residual horizontal pleiotropy can never be entirely ruled out in MR frameworks. Future prospective cohort studies incorporating PRS and detailed lipidomics are needed to fully translate our genetic findings into improved patient outcomes.
Our study provides genetic evidence for a shared etiological basis between AP and T2D, pinpointing pleiotropic loci, notably the APOE/APOC1/TOMM40 cluster, and highlighting core lipid and cholesterol metabolism pathways identified via functional enrichment that link metabolic dysregulation to both conditions. A unidirectional causal pathway from T2D to AP was identified, providing genetic evidence to distinguish classic T2D from diabetes secondary to pancreatic disease. These findings highlight the potential of genetic risk profiling to identify high-risk individuals who may benefit from targeted monitoring and early triglyceride management, supporting a proactive approach to pancreatic health in diabetes care.
DECLARATIONS
Acknowledgments
The authors are grateful to the participants of all the GWASs used in this manuscript, and BioRender for Figure 1. Graphical Abstract created in BioRender. zhou, W. (2026) https://BioRender.com/muu8g5j.
Authors’ contributions
Made substantial contributions to the conception, design, and analysis of the work: Wang YM, Zhou WY
Contributed to data acquisition and interpretation: Lu YX, Li BJ
Supervised the study, secured funding, and critically revised the manuscript for important intellectual content: Shi YQ, Li T
Availability of data and materials
The datasets generated and/or analyzed during the current study are available in public repositories. The AP GWAS summary statistics are available in the EBI GWAS Catalog (https://www.ebi.ac.uk/gwas/studies/GCST90473884). The T2D GWAS summary statistics are available from the DIAGRAM consortium (https://diagram-consortium.org/index.html).
AI and AI-assisted tools statement
Not applicable.
Financial support and sponsorship
This work was supported by the National Natural Science Foundation of China (Grant No. 82595903).
Conflicts of interest
All authors declared that there are no conflicts of interest.
Ethical approval and consent to participate
This study exclusively utilized publicly available, de-identified GWAS summary statistics. Ethical approval and informed consent were obtained by the original genome-wide association studies. No additional ethical approval is required.
Consent for publication
Not applicable.
Copyright
© The Author(s) 2026.
Supplementary Materials
REFERENCES
1. Zahariev OJ, Bunduc S, Kovács A, et al. Risk factors for diabetes mellitus after acute pancreatitis: a systematic review and meta-analysis. Front Med. 2023;10:1257222.
2. Ba DM, Chinchilli VM, Cozzi AM, Bradley DP, Pichardo-Lowden AR. Association of pancreatitis with risk of diabetes: analysis of real-world data. Front Clin Diabetes Healthc. 2023;4:1326239.
3. Pahomeanu MR, Ojog D, Nițu DT, Diaconu IȘ, Nayyerani H, Negreanu L. Acute pancreatitis and type 2 diabetes mellitus: the chicken-egg paradox-a seven-year experience of a large tertiary center. J Clin Med. 2024;13:1213.
4. Woodmansey C, McGovern AP, McCullough KA, et al. Incidence, demographics, and clinical characteristics of diabetes of the exocrine pancreas (type 3c): a retrospective cohort study. Diabetes Care. 2017;40:1486-93.
5. García-Compeán D, Jiménez-Rodríguez AR, Muñoz-Ayala JM, González-González JA, Maldonado-Garza HJ, Villarreal-Pérez JZ. Post-acute pancreatitis diabetes: a complication waiting for more recognition and understanding. World J Gastroenterol. 2023;29:4405-15.
6. Lonardo A, Singal AK, Osna N, Kharbanda KK. Effect of cofactors on NAFLD/NASH and MAFLD. A paradigm illustrating the pathomechanics of organ dysfunction. Metab Target Organ Damage. 2022;2:12.
7. Corbett JA, Sweetland MA, Wang JL, Lancaster JR Jr, McDaniel ML. Nitric oxide mediates cytokine-induced inhibition of insulin secretion by human islets of Langerhans. Proc Natl Acad Sci U S A. 1993;90:1731-5.
8. Böni-Schnetzler M, Boller S, Debray S, et al. Free fatty acids induce a proinflammatory response in islets via the abundantly expressed interleukin-1 receptor I. Endocrinology. 2009;150:5218-29.
9. Zhang AMY, Xia YH, Lin JSH, et al. Hyperinsulinemia acts via acinar insulin receptors to initiate pancreatic cancer by increasing digestive enzyme production and inflammation. Cell Metab. 2023;35:2119-35.e5.
10. Zhong L, Liu J, Liu S, Tan G. Correlation between pancreatic cancer and metabolic syndrome: a systematic review and meta-analysis. Front Endocrinol. 2023;14:1116582.
11. DiNorcia J, Lee MK, Moroziewicz DN, et al. RAGE gene deletion inhibits the development and progression of ductal neoplasia and prolongs survival in a murine model of pancreatic cancer. J Gastrointest Surg. 2012;16:104-12; discussion 112.
12. UK Biobank Whole-Genome Sequencing Consortium. Whole-genome sequencing of 490,640 UK Biobank participants. Nature. 2025;645:692-701.
13. Mahajan A, Taliun D, Thurner M, et al. Fine-mapping type 2 diabetes loci to single-variant resolution using high-density imputation and islet-specific epigenome maps. Nat Genet. 2018;50:1505-13.
14. Dou C, Liu D, Kong L, et al. Shared genetic architecture of type 2 diabetes with muscle mass and function and frailty reveals comorbidity etiology and pleiotropic druggable targets. Metabolism. 2025;164:156112.
15. Ray D, Chatterjee N. A powerful method for pleiotropic analysis under composite null hypothesis identifies novel shared loci between Type 2 Diabetes and Prostate Cancer. PLoS Genet. 2020;16:e1009218.
16. Watanabe K, Taskesen E, van Bochoven A, Posthuma D. Functional mapping and annotation of genetic associations with FUMA. Nat Commun. 2017;8:1826.
17. Burgess S, Thompson SG; CRP CHD Genetics Collaboration. Avoiding bias from weak instruments in Mendelian randomization studies. Int J Epidemiol. 2011;40:755-64.
18. Papadimitriou N, Dimou N, Tsilidis KK, et al. Physical activity and risks of breast and colorectal cancer: a Mendelian randomisation analysis. Nat Commun. 2020;11:597.
19. Bowden J, Davey Smith G, Haycock PC, Burgess S. Consistent estimation in Mendelian randomization with some invalid instruments using a weighted median estimator. Genet Epidemiol. 2016;40:304-14.
20. Bowden J, Davey Smith G, Burgess S. Mendelian randomization with invalid instruments: effect estimation and bias detection through Egger regression. Int J Epidemiol. 2015;44:512-25.
21. Del Bosque-Plata L, Martínez-Martínez E, Espinoza-Camacho MÁ, Gragnoli C. The role of TCF7L2 in type 2 diabetes. Diabetes. 2021;70:1220-8.
22. Rasmussen KL, Frikke-Schmidt R. The current state of apolipoprotein E in dyslipidemia. Curr Opin Lipidol. 2024;35:78-84.
23. Phu TA, Ng M, Vu NK, Gao AS, Raffai RL. ApoE expression in macrophages communicates immunometabolic signaling that controls hyperlipidemia-driven hematopoiesis & inflammation via extracellular vesicles. J Extracell Vesicles. 2023;12:e12345.
24. Keenan SN, Watt MJ, Montgomery MK. Inter-organelle communication in the pathogenesis of mitochondrial dysfunction and insulin resistance. Curr Diab Rep. 2020;20:20.
25. Chen F, Xu K, Han Y, et al. Mitochondrial dysfunction in pancreatic acinar cells: mechanisms and therapeutic strategies in acute pancreatitis. Front Immunol. 2024;15:1503087.
26. Yang NV, Chao JY, Garton KA, et al. TOMM40 regulates hepatocellular and plasma lipid metabolism via an LXR-dependent pathway. Mol Metab. 2024;90:102056.
27. Ma Y, Zuo S, Lo T, et al. Genetic variations in GCKR and PNPLA3 regulate metabolic balance across the liver. Diabetes. 2025;74:1300-9.
Cite This Article
 Open Access
How to Cite
Download Citation
Export Citation File:
Type of Import
Tips on Downloading Citation
Citation Manager File Format
Type of Import
Direct Import: When the Direct Import option is selected (the default state), a dialogue box will give you the option to Save or Open the downloaded citation data. Choosing Open will either launch your citation manager or give you a choice of applications with which to use the metadata. The Save option saves the file locally for later use.
Indirect Import: When the Indirect Import option is selected, the metadata is displayed and may be copied and pasted as needed.
About This Article
Copyright

Data & Comments
Data
0










Comments
Comments must be written in English. Spam, offensive content, impersonation, and private information will not be permitted. If any comment is reported and identified as inappropriate content by OAE staff, the comment will be removed without notice. If you have any queries or need any help, please contact us at [email protected].