

fig2
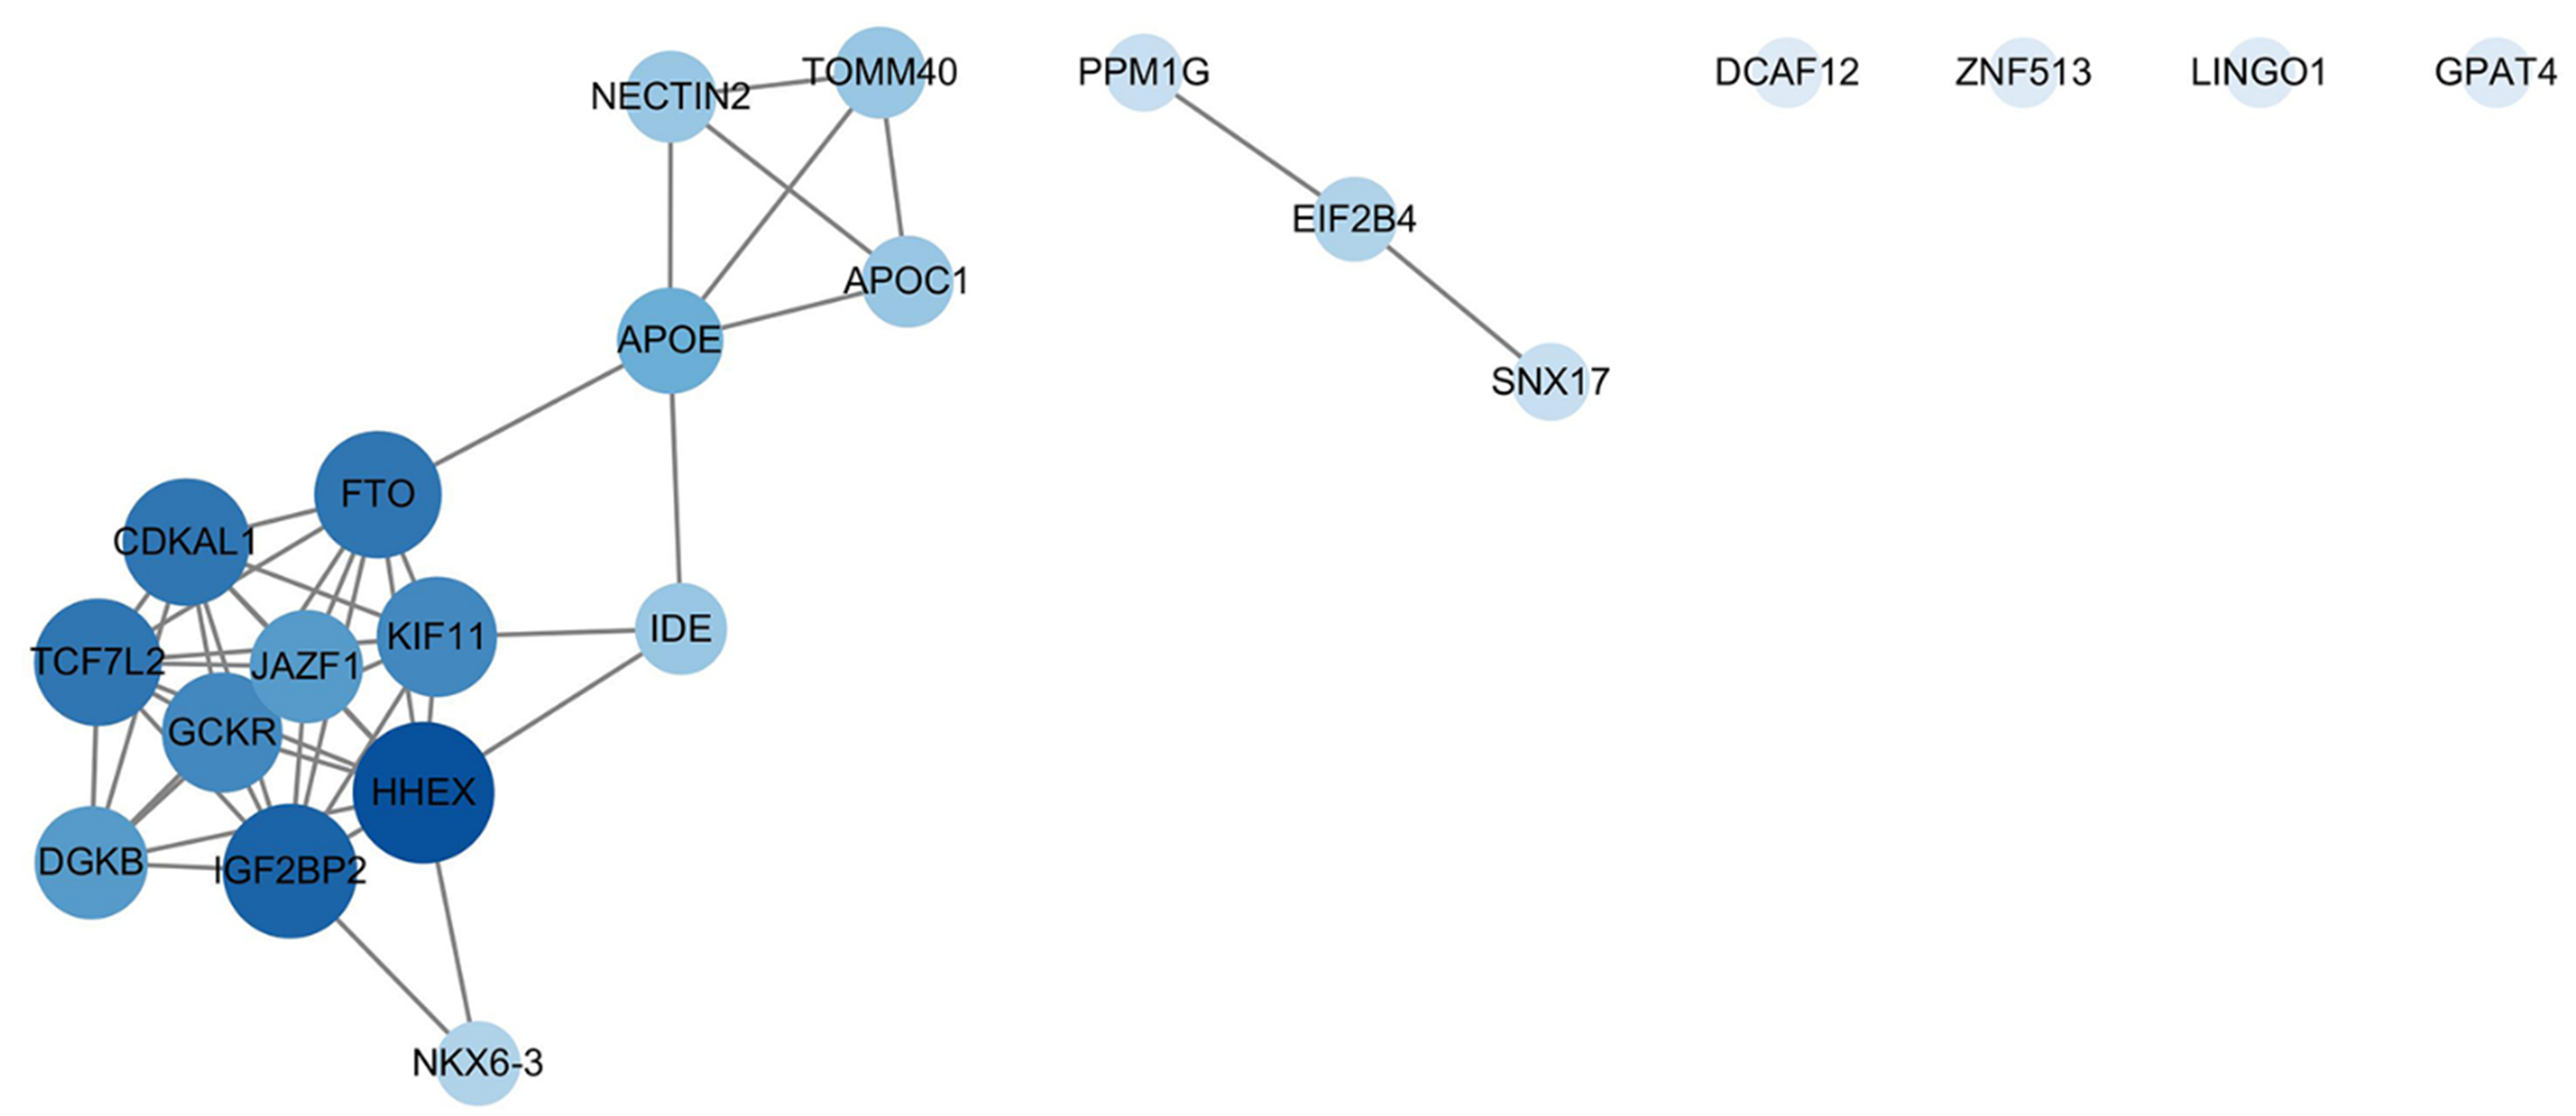
Figure 2. PPI network analysis of candidate pleiotropic genes. The network depicts functional interactions among the 22 candidate genes mapped from shared genomic loci. Nodes represent genes, and edges represent known or predicted functional associations from the STRING database. The size and color intensity of each node are proportional to its degree centrality - a measure of connectedness within the network - with larger, darker nodes indicating more highly interconnected hub genes. The network exhibits significant interconnectivity (PPI enrichment P < 1.0 × 10⁻¹⁶), highlighting key hub genes such as HHEX and a distinct functional module containing APOE, APOC1, and TOMM40. This network visualization was generated using Cytoscape (version 3.10.4). PPI: Protein-protein interaction; STRING: Search Tool for the Retrieval of Interacting Genes/Proteins.





