

fig3
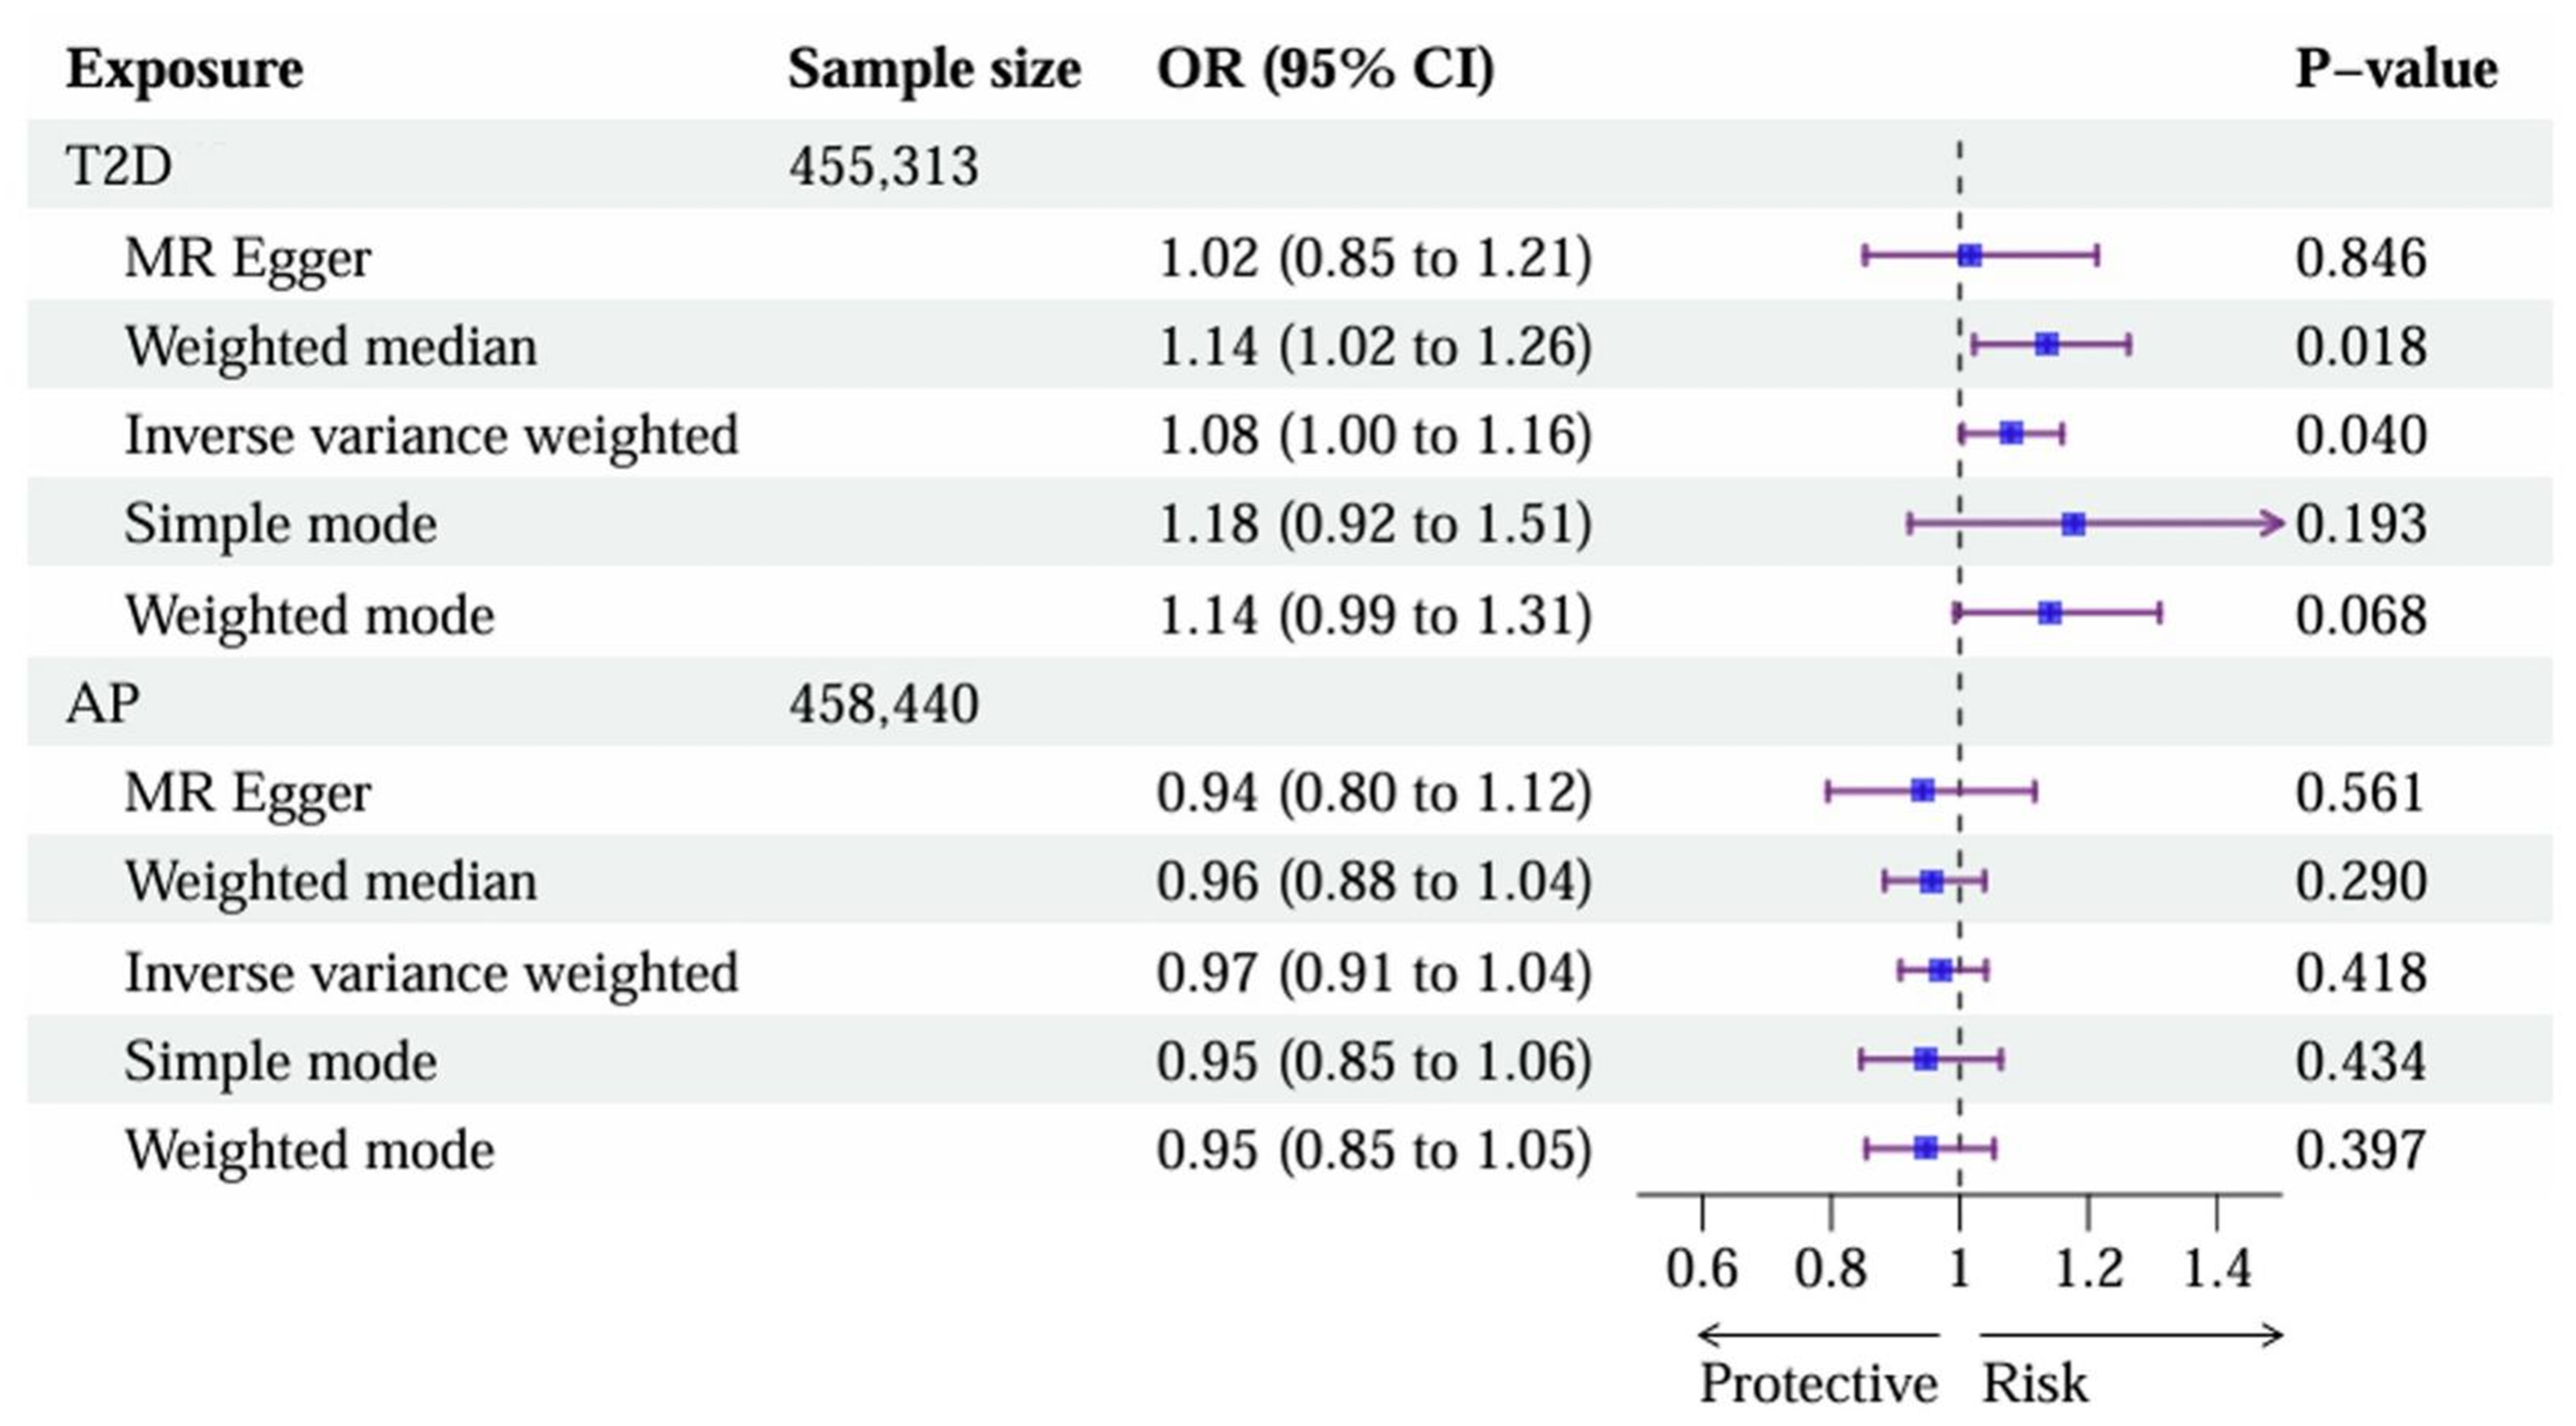
Figure 3. An asymmetric causal link from T2D to AP revealed by MR. The forest plot presents the ORs and 95%CIs for the causal effects in two directions: (1) the effect of T2D on AP and (2) the effect of AP on T2D. Statistical methods: Causal estimates were derived primarily using the IVW method under a random-effects model. All P-values are two-sided. T2D: Type 2 diabetes; AP: acute pancreatitis; MR: Mendelian randomization; ORs: odds ratios; CIs: confidence intervals; IVW: inverse-variance weighted.





