

Incommensurate modulations and thickness-dependent energy storage density in (PbLaSrBa)(ZrSnTi)O3 relaxor antiferroelectric thick-film ceramics
 0

Graphical Abstract
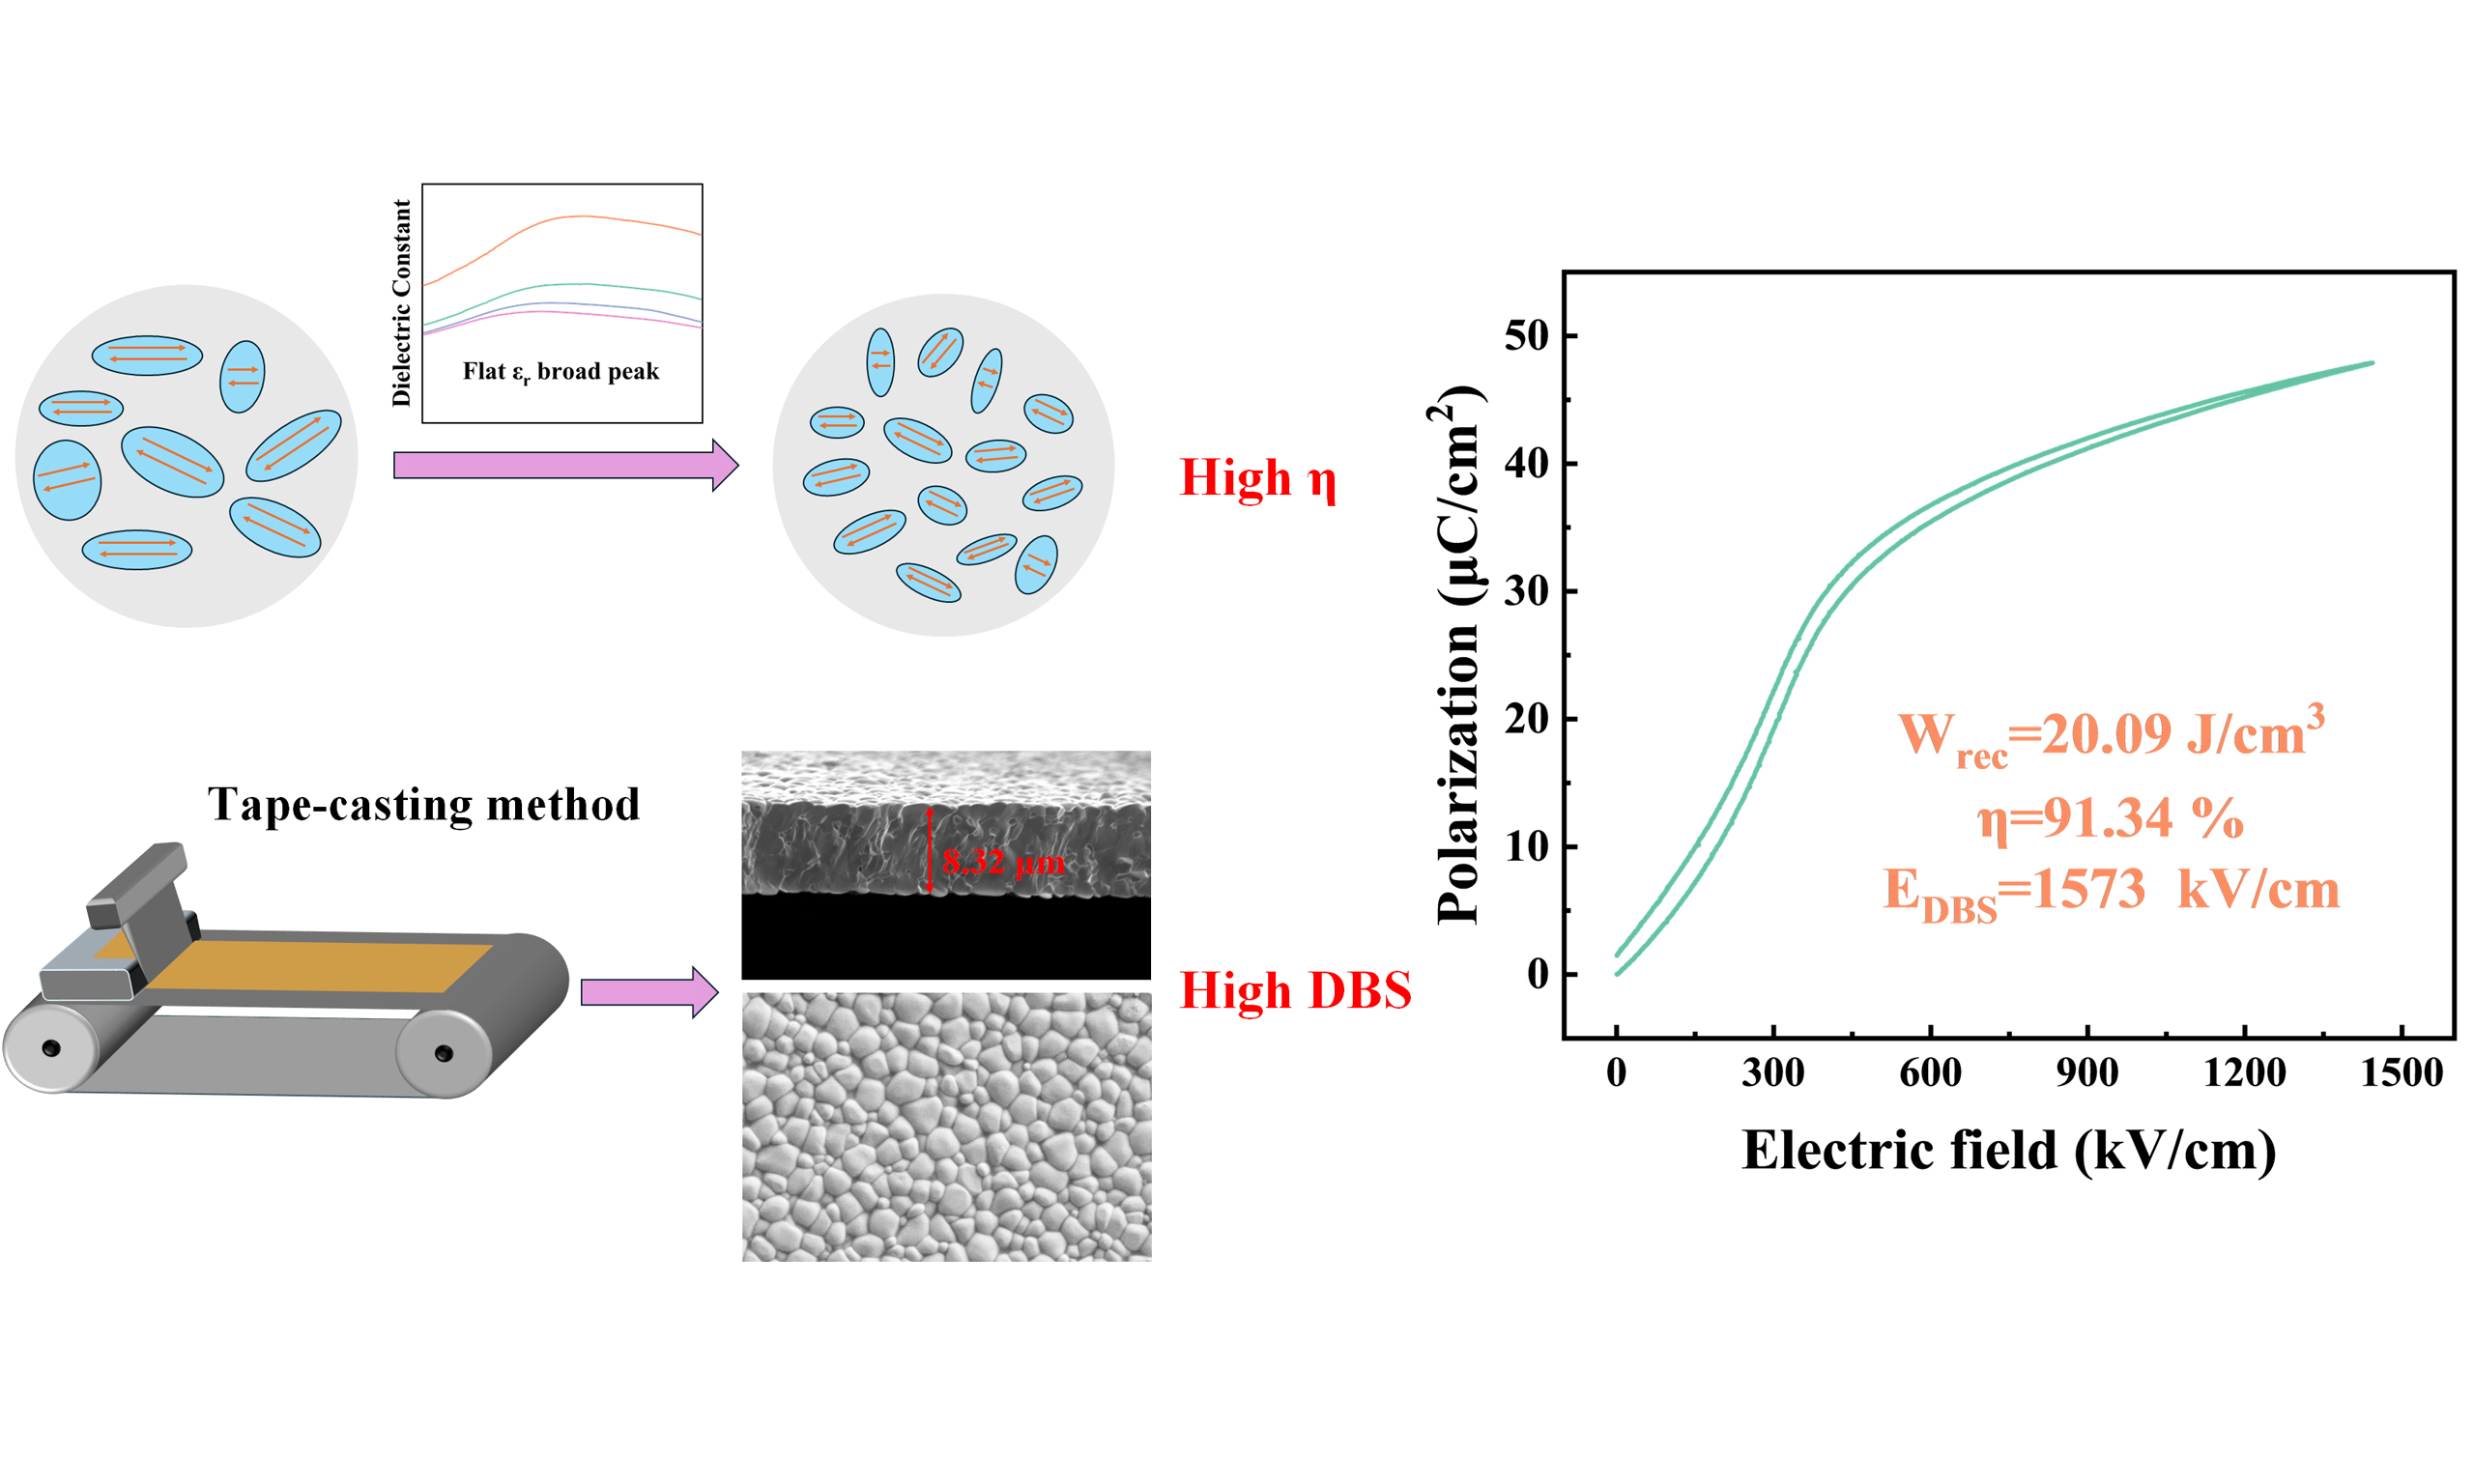
Abstract
In this study, (Pb0.92-xLa0.04SrxBa0.02)(Zr0.64Sn0.35Ti0.01)O3 (PLSBZSTi, i = 1 (x=0.04), 2 (0.06), 3 (0.08), and 4 (0.10)) relaxor antiferroelectric thick-film ceramics were prepared using a tape-casting process. An ultrahigh Wrec of 20.09 J/cm3 with an ultrahigh η of 91.34% was obtained for the PLSBZST2 (x = 0.06) ceramic. This outstanding energy storage performance is attributed to the distinct microstructural features of this system. Specifically, transmission electron microscopy revealed the presence of nanosized stripe domains, along with F-spots associated with 1/2{ooo} superlattice diffraction and an incommensurate modulation structure (IMS) related to the 1/n<110> superlattice (n = 4.91). These microstructural characteristics are direct evidence of oxygen octahedral tilting, which promotes the formation of relatively slim hysteresis loops. Moreover, the inverse power-law relationship between the sample thickness and energy storage density was determined. The fitted exponent was -0.43 ± 0.04, which can be quantified by combining the thickness-dependent dielectric breakdown strength (exponent of -0.39) and maximum polarization (exponent of -0.13) with a 20% correction factor accounting for the practical underutilization of the maximum electric field and polarization.
Keywords


 Download PDF
INTRODUCTION
Compared with traditional lithium-ion batteries, electrochemical capacitors, and polymer media, ceramic-based dielectric capacitors offer high power densities and are attractive for meeting the growing demand for energy storage devices[1-5], and many studies have attempted to develop these systems[6-10]. Ceramic-based dielectric capacitors have attracted much attention because of their high power densities, fast charge-discharge abilities, broad operating-temperature ranges, long cyclic times, and excellent thermal stabilities in pulse-power devices[11-16]. These characteristics make ceramic dielectric capacitors promising for energy storage applications such as pulse-power supplies, electric vehicles, and electromagnetic pulse devices[17-19].
Dielectric materials can be classified into four categories: linear dielectrics, normal ferroelectrics, antiferroelectrics (AFEs), and relaxor ferroelectrics[20-23]. Among them, AFEs show unique double polarization-electric field (P-E) hysteresis loops in an external electric field, experience a transition from an AFE phase to a ferroelectric (FE) phase with an increasing electric field, and demonstrate a transition from an FE to AFE phase in a decreasing electric field. Because of the antiparallel arrangement of adjacent dipoles, the remnant polarization of AFEs is near zero, and the polarization and dielectric constant sharply increase when the electric field reaches the transition field. These features improve the discharged energy storage density and charge-discharge performance of AFEs in terms of increasing the integrated area of the upper branch of P-E hysteresis loop with respect to the polarization axis[24-27]. The total energy storage density (Wtot), recoverable energy storage density (Wrec), and energy storage efficiency (η) of dielectric ceramic capacitors can be defined as follows[28,29]:
where E, Pm, and Pr denote the applied electric field, maximum polarization, and remnant polarization, respectively.
Therefore, improving the polarization, AFE-FE transition field, and dielectric breakdown strength (DBS) of AFE materials can enhance the energy storage performance of dielectric capacitors. The stability of the AFE phase can be evaluated using the Goldschmidt tolerance factor for the ABO3 perovskite structure:
where RA, RB, and RO denote the radii of A-site, B-site, and oxygen ions, respectively. When ionic doping decreases t, the stability of the AFE phase increases, thus increasing the phase transition field EAFE-FE. For linear ferroelectrics, the polarization is usually proportional to the dielectric constant multiplied by the electric field, and it therefore increases with increasing electric field intensity. The DBS can be increased either intrinsically by increasing the bandgap through doping or extrinsically by refining the grain-size distribution to reduce defect concentration and interfacial flaws[30-32]. Liu et al.[32,33] investigated (Pb0.925La0.05)(Zr0.995Ti0.005)O3 ceramics and obtained Wrec = 12.3 J/cm3 and η = 84% under an electric field of
These previous studies found that although these materials demonstrate high energy-storage densities, their energy storage efficiencies remain relatively low. By contrast, the energy storage efficiency of (PbLa)(ZrSnTi)O3 (PLZST) ceramics is related to the hysteresis of the AFE-FE and FE-AFE phase transitions. Previous investigations have shown that the electric hysteresis in the P-E loop can be reduced by doping Sr2+ ions at A-sites, and a relaxor AFE with a diffuse phase transition can be constructed to form a slim P-E hysteresis loop, thereby effectively improving the energy storage efficiency of this system[11,35]. Moreover, the doping of Ba2+ ions at A-sites has been shown to increase the dielectric constant and correspondingly decrease the phase transition temperature[36,37]. Therefore, this study investigated Ba2+ and Sr2+ co-doped PLZST AFE bulk ceramics. In addition, doped PLZST thick-film ceramics were fabricated using a tape-casting process to further improve the DBS and energy storage performance[38]. The effect of film thickness on DBS and polarization was evaluated, and the influence of the ceramic thickness on the energy storage density was statistically determined.
EXPERIMENTAL
Experimental methods
First, (Pb0.92-xLa0.04SrxBa0.02)(Zr0.64Sn0.35Ti0.01)O3 (where x = 0.04, 0.06, 0.08, and 0.10; abbreviated as PLSBZST1, PLSBZST2, PLSBZST3, and PLSBZST4, respectively) ceramics were prepared using a tape-casting approach. Raw materials were purchased from Aladdin (China), including PbO (99.90%), La2O3 (99.90%), SrCO3 (99.00%), BaCO3 (99.95%), ZrO2 (99.99%), SnO2 (99.50%), and TiO2 (99.00%). The raw materials were weighed according to their stoichiometric ratios, and an excess of 3% PbO was added to compensate for PbO volatilization during high-temperature sintering. The mixture was ball milled (MSK-SFM-1, Kejing, China) at 250 rpm for 24 h using anhydrous ethanol as a solvent, dried at 100 °C overnight after ball milling, and the resulting green powders were calcined at 900 °C for 2 h. A second ball milling and drying step was then performed to obtain crystalline PLSBZST powders. Next, the PLSBZST ceramic powders were dispersed in a solvent. The dispersant, binder, and plasticizer were then added to prepare the slurry, which was tape-cast into PLSBZST thick-film green sheets. Finally, the thick-film green sheets were cut and debindered at 650 °C for 6 h, followed by sintering at 1,100~1,200 °C for 6 h to obtain dense, freestanding thick-film ceramics.
Microstructural characterization and performance testing
The lattice structure was characterized using X-ray diffractometry (XRD; Rigaku, Ultima-Ⅳ). Rietveld refinement was carried out using FullProf software. The surface morphologies and elemental distributions of the ceramics were analyzed using scanning electron microscopy (SEM; S3400-N and SU8010, Hitachi High-Technologies Corporation, Japan) equipped with an energy-dispersive X-ray spectrometer (EDS). The grain size distribution was statistically analyzed using ImageJ software. Selected-area electron diffraction (SAED) patterns and high-resolution transmission electron microscopy (HRTEM) images were obtained using a Talos F200x microscope (FEI Company, USA). The temperature- and frequency-dependent dielectric constant and loss tangent were measured using a precision inductor-capacitor-resistor (LCR) analyzer (4980A, Keysight, USA). The P-E hysteresis loops of the ceramics were measured using a Sawyer-Tower circuit (Precision Multiferroic II ferroelectric test system, Radiant Technologies Inc., USA). Circular gold electrodes with a diameter of 1 mm were used for the P-E and other electrical measurements, whereas electrodes with a diameter of 1.8 mm were used for the charge-discharge measurements.
RESULTS AND DISCUSSION
Figure 1A shows the XRD patterns of the PLSBZST1-4 AFE ceramics at room temperature. All ceramics demonstrate pure perovskite structures, and no diffraction peaks from the impurity phase are detected. In the magnified patterns near 2θ = 44°, the intensity of the (200) peak is approximately twice that of the (002) peak, indicating that the PLSBZST ceramics may have an orthorhombic structure[30,39,40]. According to the Bragg equation,
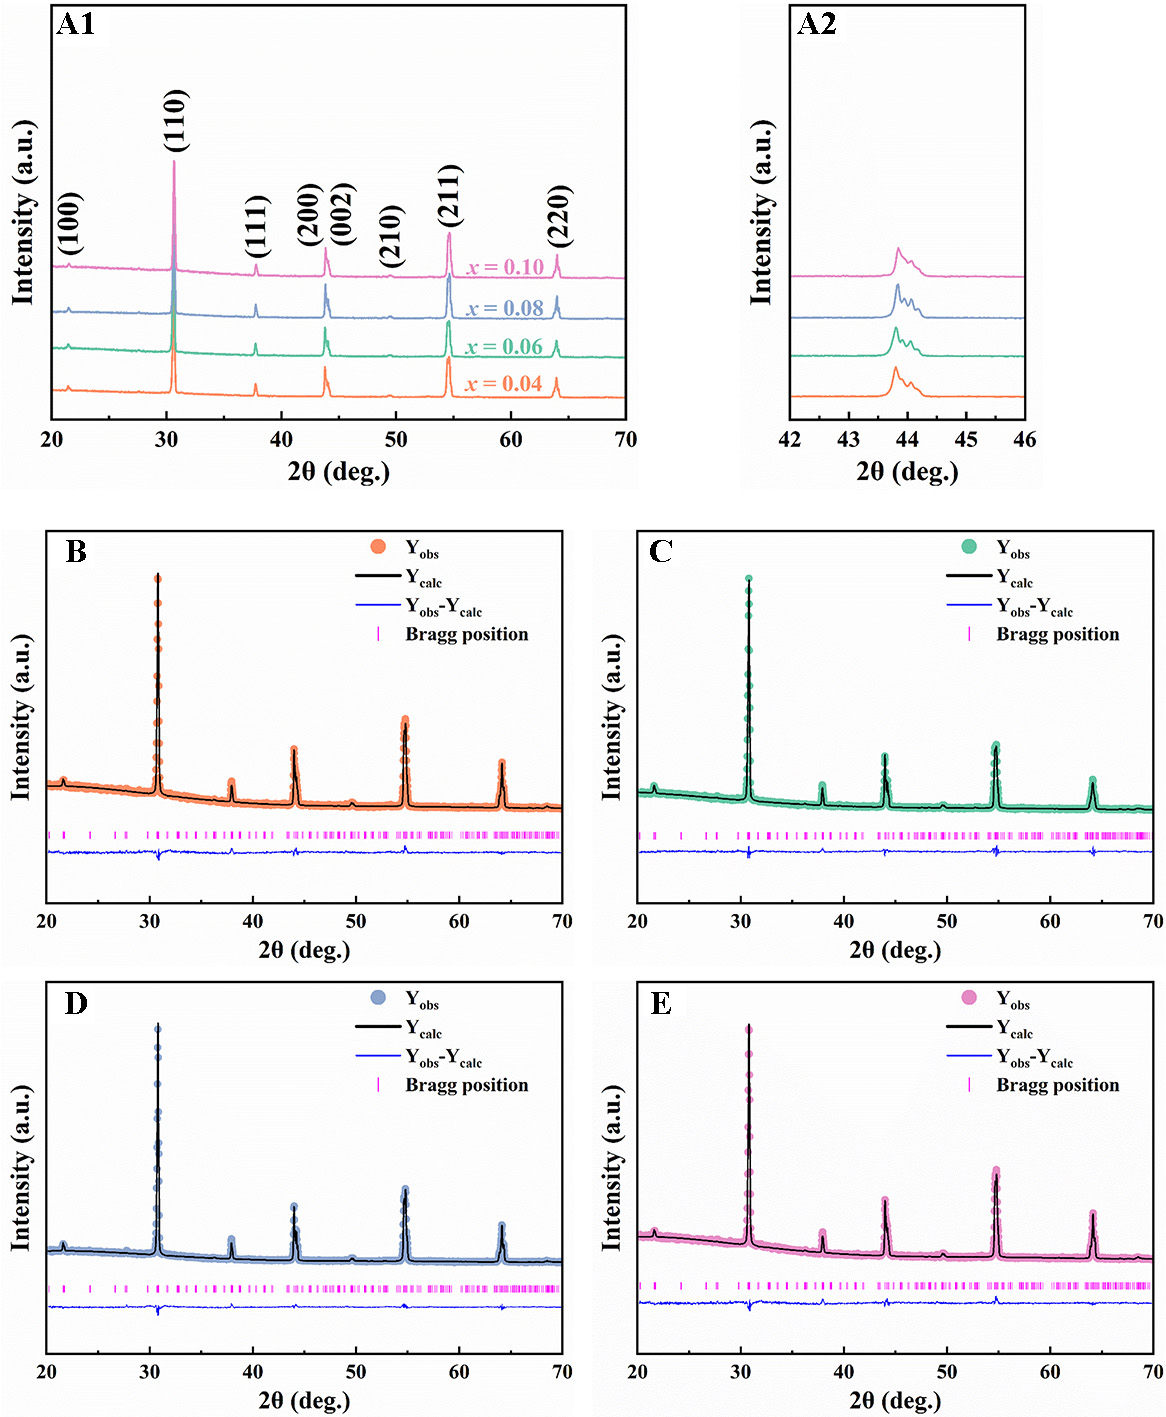
Figure 1. (A1) XRD patterns obtained at room temperature for the PLSBZST thick-film ceramics; (A2) Magnified XRD patterns for 2θ ranging from 42° to 46°; and Rietveld refinements for (Pb0.92-xLa0.04SrxBa0.02)(Zr0.64Sn0.35Ti0.01)O3 thick-film ceramics with different x values: (B) x = 0.04, (C) x = 0.06, (D) x = 0.08, (E) x = 0.10. XRD: X-ray diffraction; PLSBZST: (Pb0.92-xLa0.04SrxBa0.02)(Zr0.64Sn0.35Ti0.01)O3.
where d is the distance between the two close crystalline planes, θ is the angle of incidence or the angle of reflection, n is the whole number, and λ is the wavelength of X-ray. The lattice shrinks and the lattice constant decreases as Sr2+ (1.19 Å) has a smaller ionic radius than Pb2+ (1.49 Å). Therefore, the diffraction peaks shift toward higher diffraction angles.
Rietveld refinements were used to confirm the exact phase structures and detailed lattice parameters of all samples. Figure 1B-E demonstrates the Rietveld refinement results of the PLSBZST thick-film ceramics, which show that all thick-film ceramics adopt an orthorhombic phase structure (Pbam space group). Table 1 summarizes the lattice parameters and reasonable agreement indices (Rp, Rwp, and χ2).
Lattice parameters obtained using Rietveld refinement
| Composition | Lattice parameters | Phase | Rp (%) | Rwp (%) | χ2 | |||
| a (Å) | b (Å) | c (Å) | Α = β = γ (°) | |||||
| x = 0.04 | 5.82617 | 11.63645 | 8.18836 | 90 | O | 4.03 | 5.32 | 2.44 |
| x = 0.06 | 5.82586 | 11.63240 | 8.18749 | 90 | O | 3.65 | 4.87 | 2.37 |
| x = 0.08 | 5.82329 | 11.62583 | 8.18616 | 90 | O | 4.02 | 5.25 | 2.04 |
| x = 0.10 | 5.82280 | 11.62437 | 8.18529 | 90 | O | 3.70 | 4.74 | 2.94 |
To further characterize the microstructures of PLSBZST ceramics, the sample with x = 0.06 was analyzed using transmission electron microscopy (TEM). In Figure 2A, typical nanosized stripe electric domains (e.g., ~200-300 nm in size) can be observed in the bright-field image. An HRTEM image covering an electric domain area with tens of nanometers in size is also shown in the inset of Figure 2A. The reduction in the size of the ordered regions is attributed to the disruption of long-range order caused by compositional and structural fluctuations. These nanosized domains, also called polar nanoregions (PNRs), result in slim P-E hysteresis loops and other typical relaxor AFE behaviors, such as diffuse phase transitions[11,35]. Moreover, the relaxor AFE diffuseness parameter is > 1 and close to 1.6 (see Figure 2A)[41,42]. Figure 2B shows the SAED pattern obtained along the [
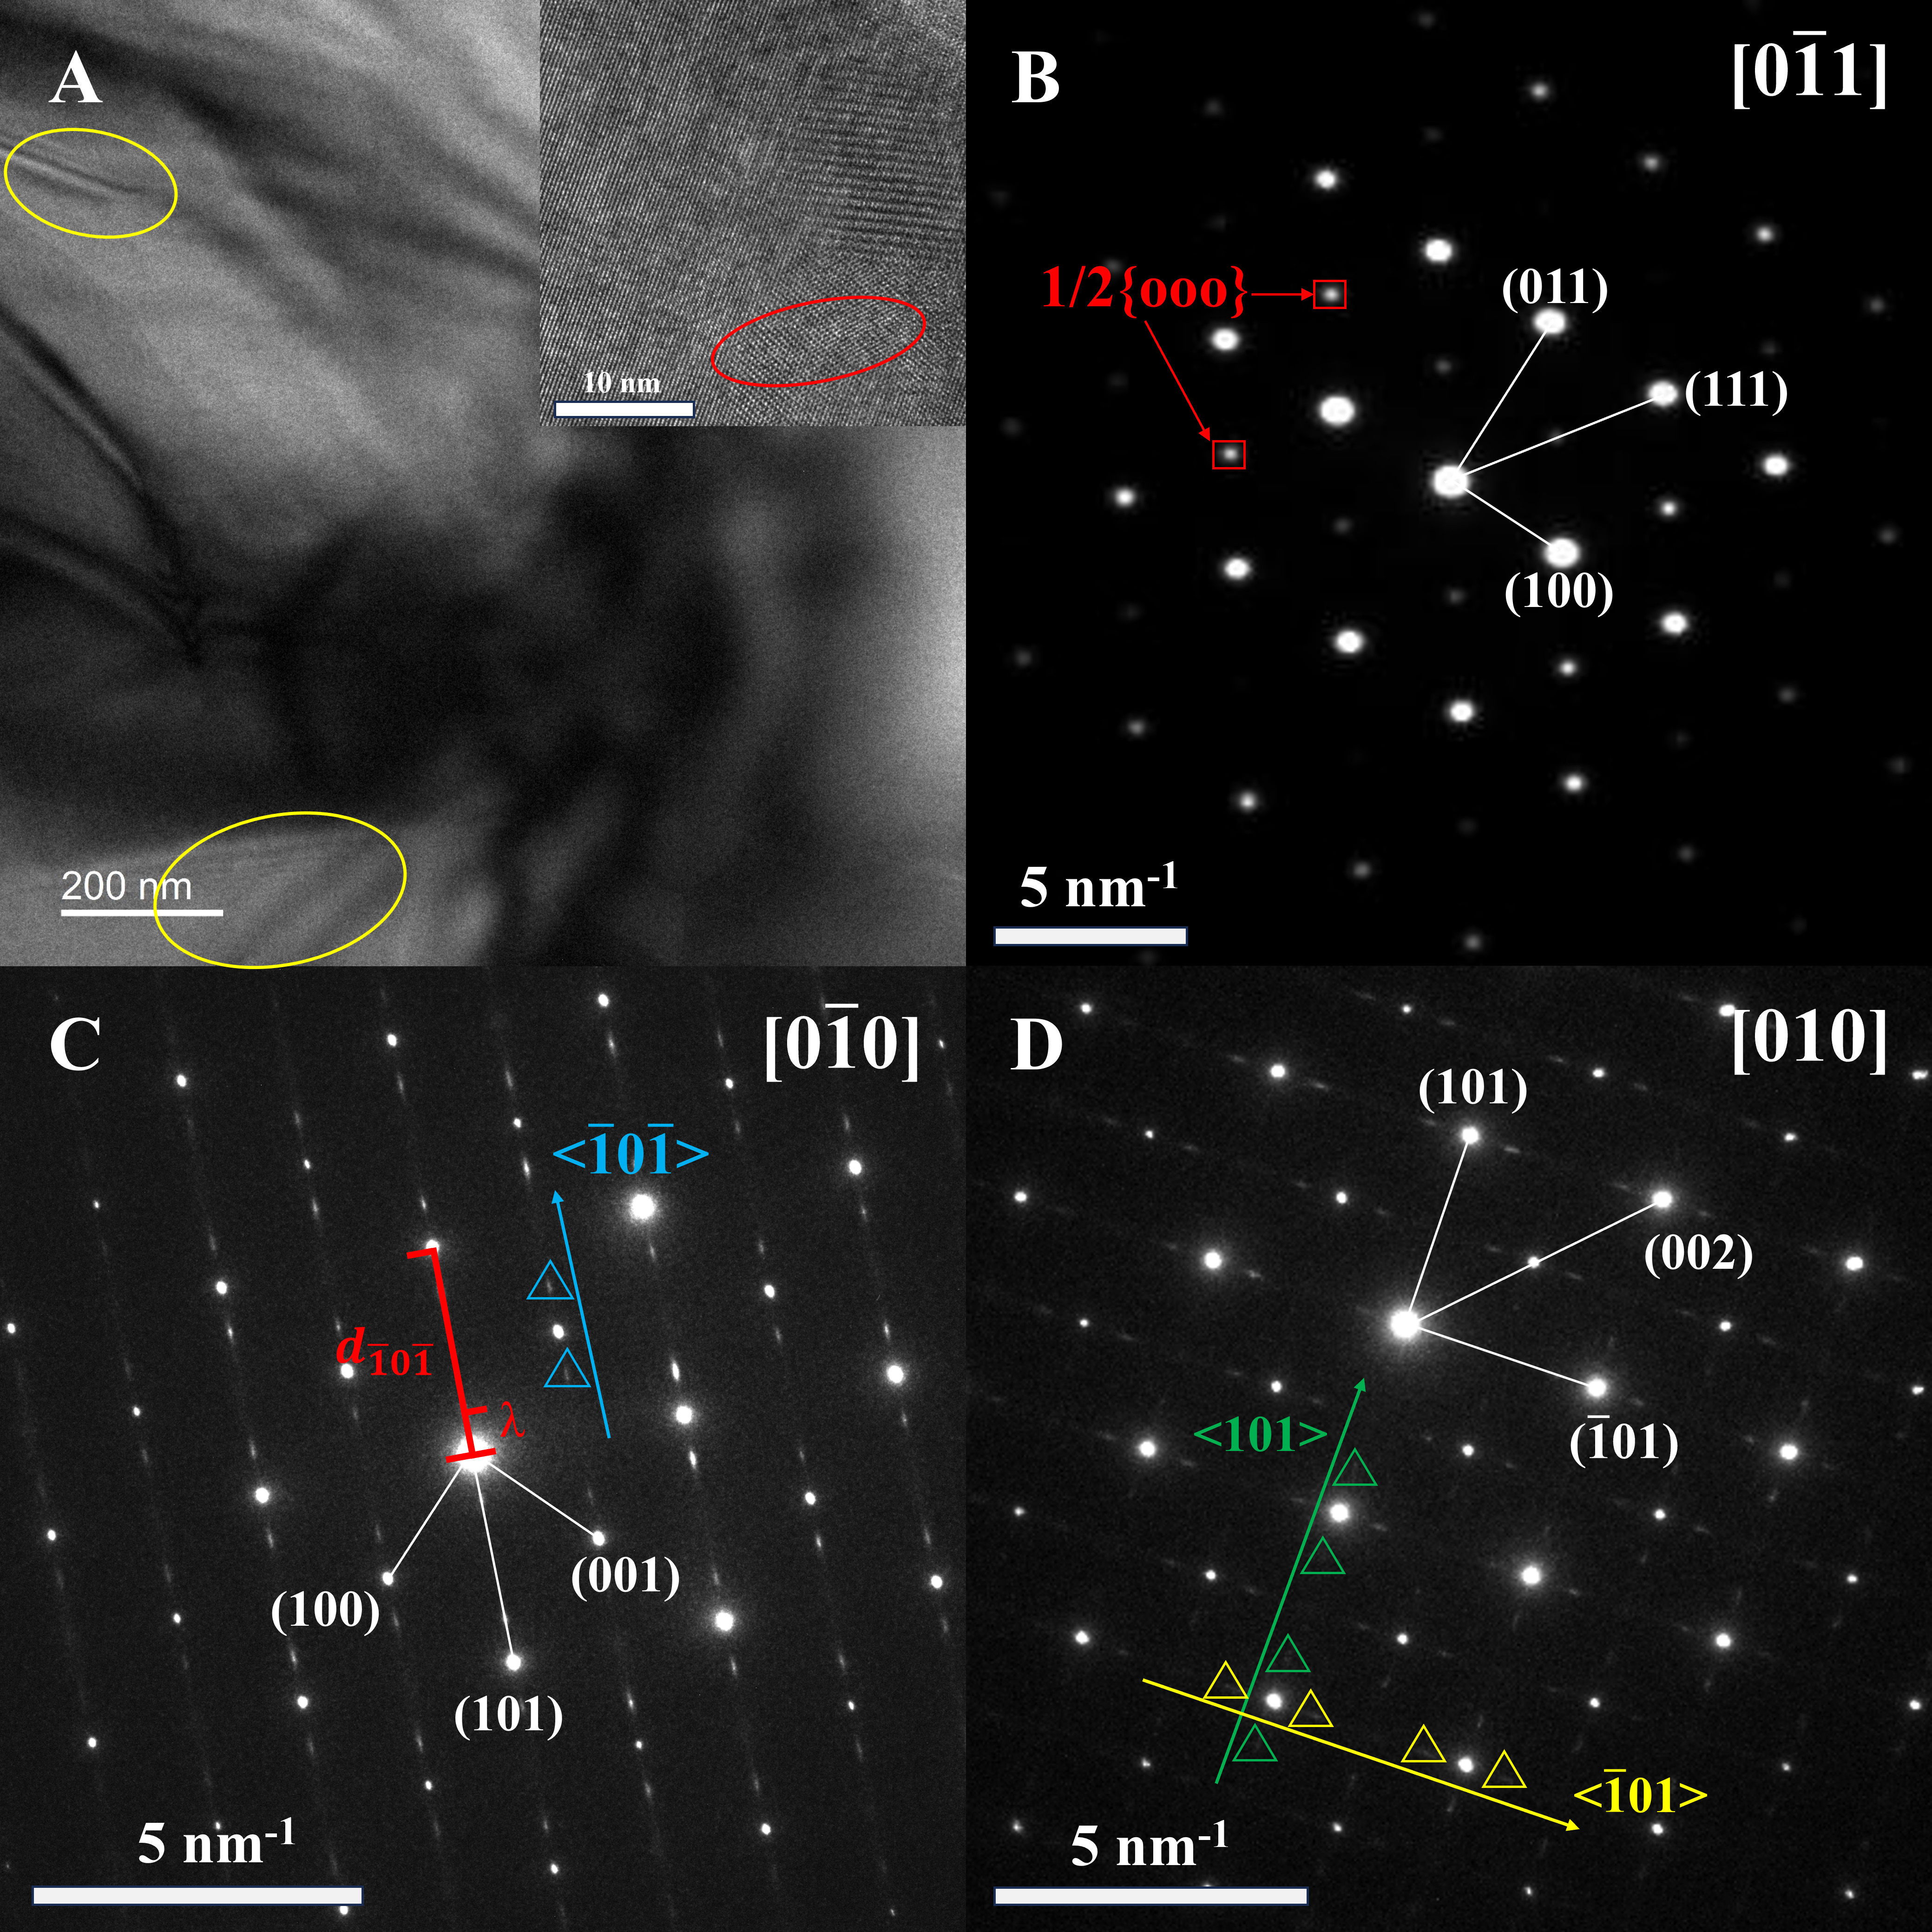
Figure 2. TEM image and diffraction patterns for PLSBZST2 (x = 0.06) AFE thick-film ceramics. (A) Bright-field images of the stripe domains, and the inset shows an HRTEM image of a nanosized domain; (B) SAED pattern with 1/2{ooo} superlattice patterns (F-spots); (C) [
Figure 3A-D presents the surface SEM images of the four PLSBZST thick-film ceramics and their grain size distributions. All ceramic samples show dense microstructures, clear grain boundaries, closely packed grains, and small pores at multigrain junctions. The inset of each panel shows the grain size distribution histogram obtained using ImageJ software. The grain sizes are mainly distributed between 1 and 3 μm. These fine grain sizes improve the DBS of the ceramics via the relation
Figure 3. (A-D) SEM images of the PLSBZST thick-film ceramics; (E) Cross-sectional SEM image of the PLSBZST1 sample; (F) Surface morphology and SEM-EDS elemental mappings (Pb, La, Sr, Ba, Zr, Sn, Ti, O) of the PLSBZST1 sample; the scale bar for these mappings is shown in (F). SEM: Scanning electron microscopy; PLSBZST: (Pb0.92-xLa0.04SrxBa0.02)(Zr0.64Sn0.35Ti0.01)O3; EDS: energy-dispersive X-ray spectrometer.
Figure 4A-D shows the temperature-dependent relative dielectric constant (εr) and loss tangent (tanθ) for PLSBZST ceramics at frequencies of 1, 5, 10, and 50 kHz in the temperature range of 30-320 °C. At a constant temperature, the slight decrease in the dielectric constant with increasing measurement frequency is attributed to the reduced ability of dipoles to follow the alternating field at high frequencies[43]. The maximum dielectric constant (εm) gradually decreases with increasing Sr2+ content, and the peak temperature (Tm) corresponding to εm also decreases. Due to the influence of the thermodynamic instability of PbSnO3, all the samples underwent a stage in which the dielectric constant showed little variation and resulted in a flat, broad peak. This behavior is attributed to the occurrence of a multicell cubic (MCC) phase[47], which exhibits dielectric characteristics similar to those of the relaxor AFEs. To further examine the relaxor AFE characteristics of PLSBZST thick-film ceramics, the modified Curie-Weiss law was used[33]
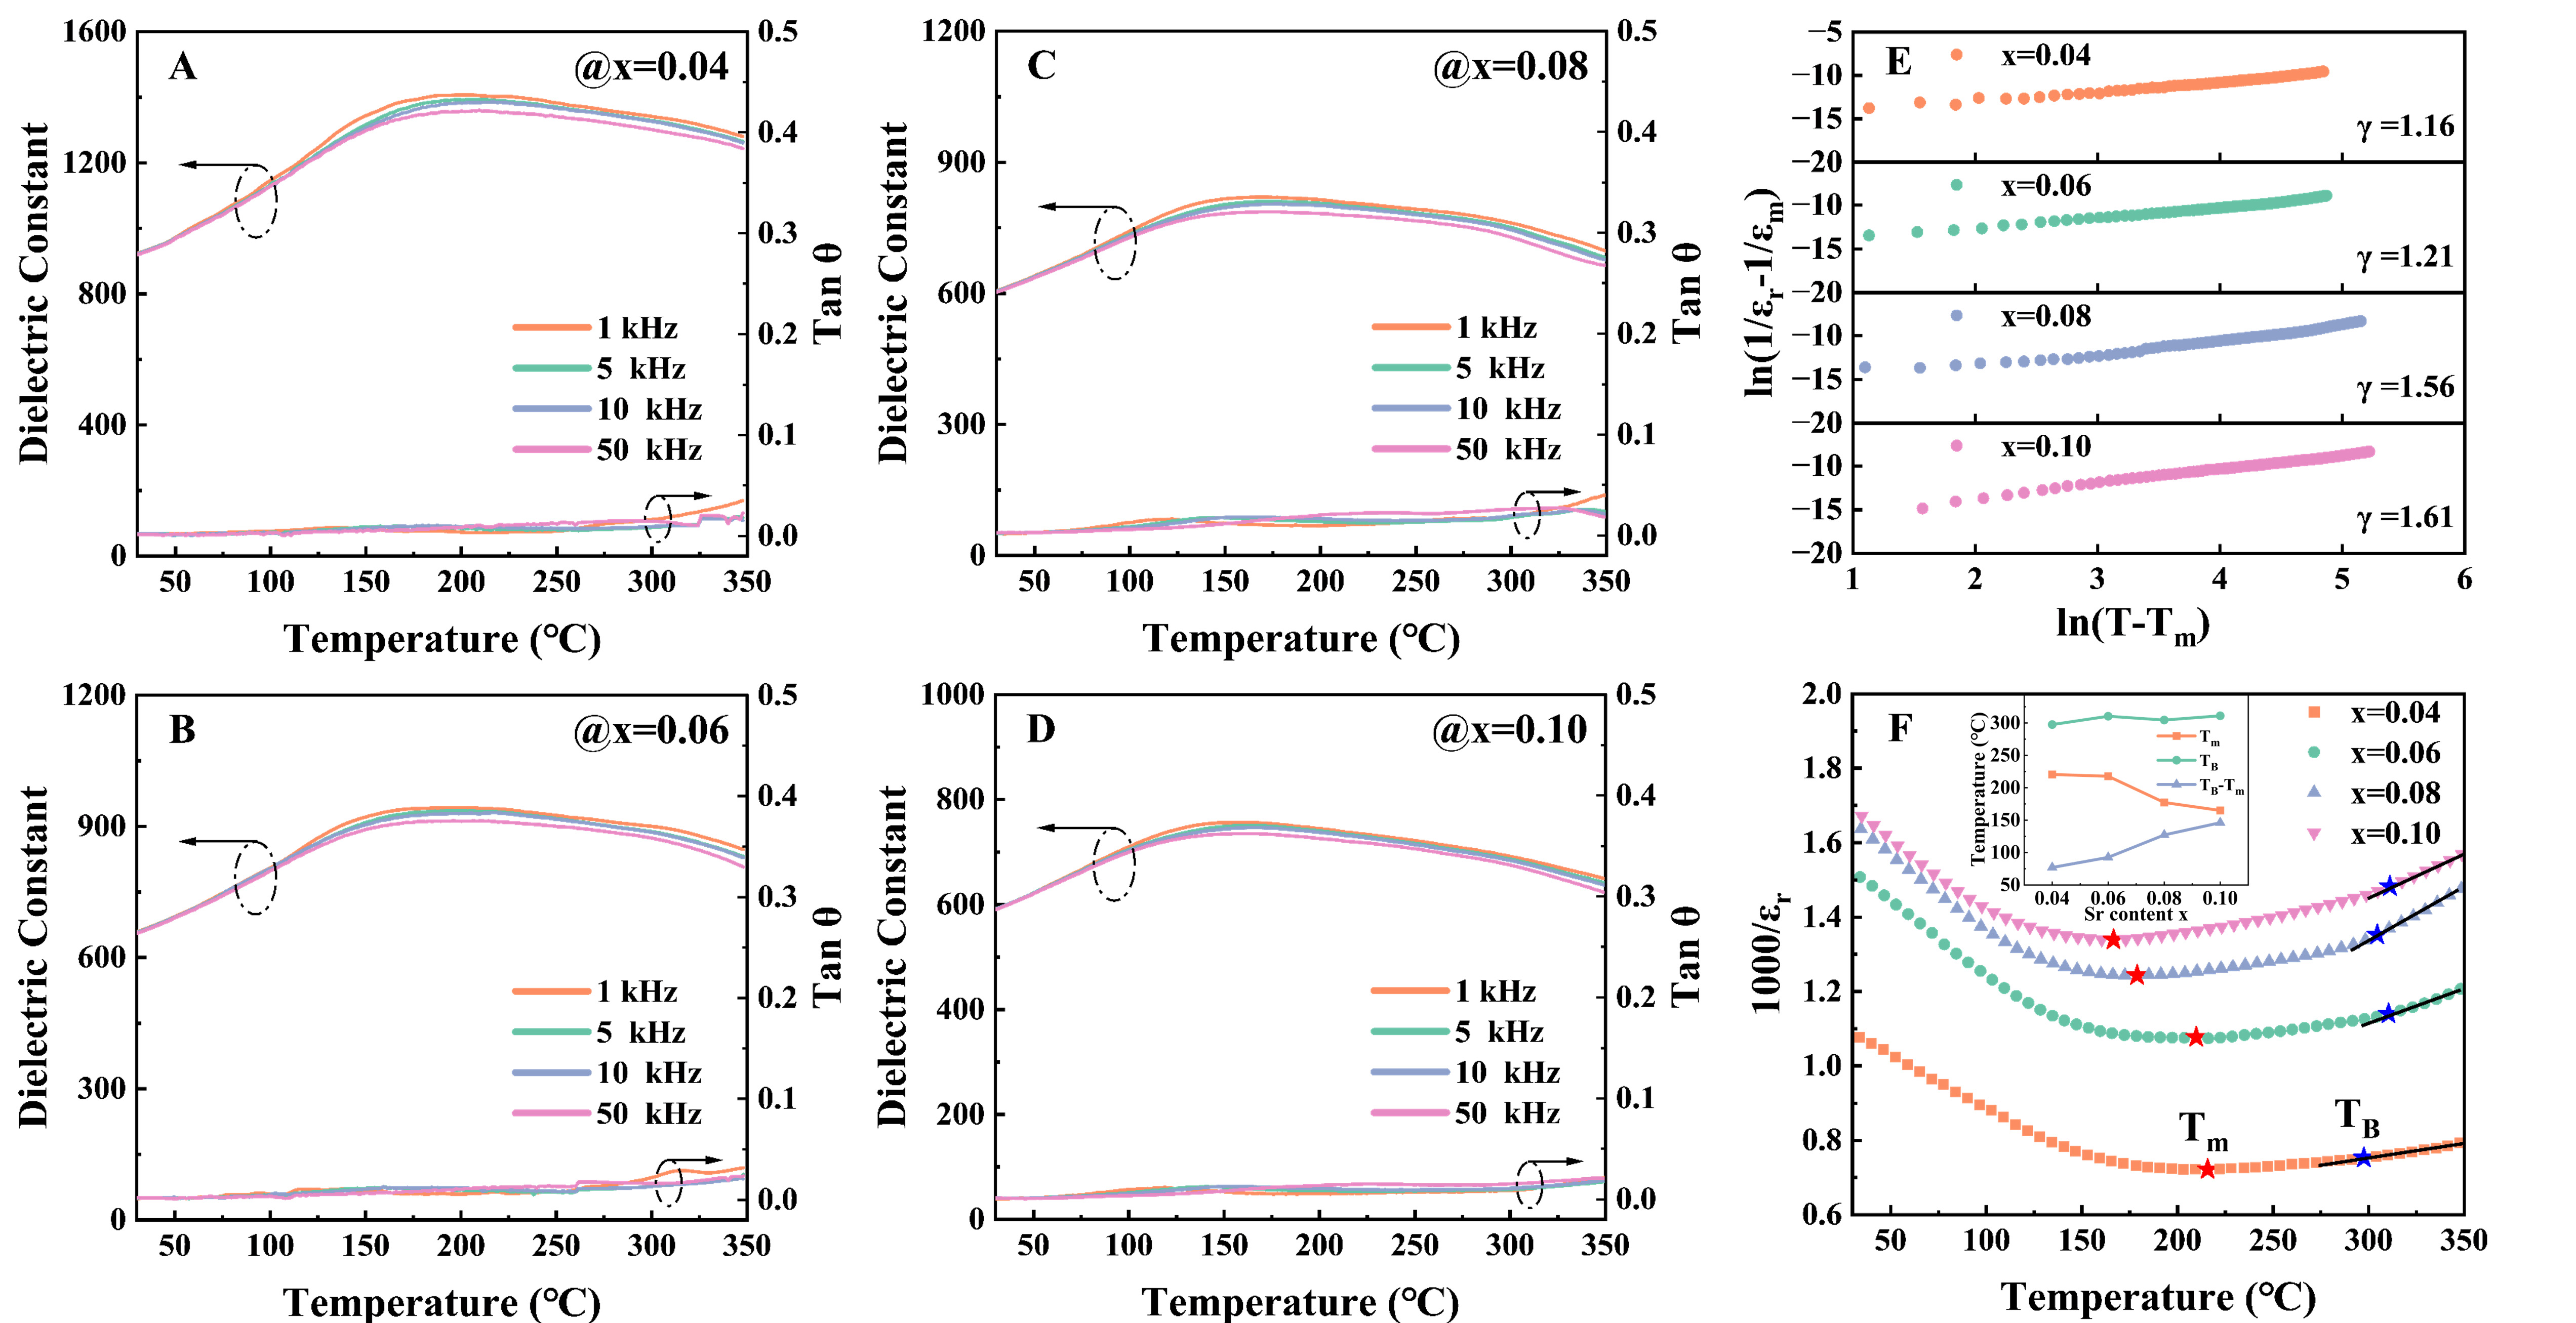
Figure 4. (A-D) Dielectric constant and loss tangent as a function of temperature for PLSBZST thick-film ceramics at 1, 5, 10, and 50 kHz; (E) ln(1/εr-1/εm) as a function of ln(T-Tm) at 10 kHz. (F) Inverse dielectric constant (1000/εr) as a function of temperature at 10 kHz; the inset shows Tm, TB, and TB-Tm as a function of the Sr2+ content. Moreover, the red stars denote Tm, while the blue stars denote TB. PLSBZST: (Pb0.92-xLa0.04SrxBa0.02)(Zr0.64Sn0.35Ti0.01)O3.
where T is the temperature above Tm, εr is the relative dielectric constant at T, εm is the maximum dielectric constant, C is the Curie constant, and γ is the diffuseness parameter. As shown in Figure 4E, γ increases with increasing x from 1.16 (x = 0.04) to 1.61 (x = 0.10). This indicates that the relaxor AFE characteristics of PLSBZST thick-film ceramics are gradually enhanced under these conditions.
In Figure 4F, 1000/εr as a function of temperature, based on the dielectric constant versus temperature plot, clearly shows the degree of diffuseness. TB is the Burns temperature, defined as the formation of polar nano regions in relaxor ferroelectrics, at which εr begins to deviate from the Curie-Weiss law. The results show that TB-Tm and the degree of diffuseness increase with increasing Sr2+ content. The increase in the diffuse degree and relaxor AFE character is beneficial for refining the P-E hysteresis loop, thus obtaining higher Wrec and η values[31,32,48,49].
Figure 5A and B shows the P-E and current - electric field (I-E) hysteresis loops for the PLSBZST1-4 thick-film ceramics at room temperature. All PLSBZST ceramic samples show typical AFE hysteresis loops and bimodal current curves. With increasing Sr2+ content, the P-E hysteresis loop exhibits stronger relaxor AFE characteristics, the I-E current peaks broaden, and the peaks shift towards high electric fields, which indicates that the AFE-FE phase transition electric field increases with x[11].
Figure 5. (A) P-E and (B) current - electric field (I-E) hysteresis loops obtained at room temperature for PLSBZST thick-film ceramics; (C) EAFE-FE, EFE-AFE, ΔE, and Pmax; (D) Weibull distribution of the four samples, with the inset showing the DBS as a function of x; (E) Wrec and η for four samples; (F) Comparison of the Wrec and η values of PLSBZST2 with those of recently reported AFE ceramics[11,29,30,34,35,50-59]. P-E: Polarization - electric field; PLSBZST: (Pb0.92-xLa0.04SrxBa0.02)(Zr0.64Sn0.35Ti0.01)O3; DBS: dielectric breakdown strength; AFE: antiferroelectric; Pmax: maximum polarization; Wrec: recoverable energy storage density.
The AFE-FE and FE-AFE phase transition electric fields and hysteresis width for the four ceramics (ΔE = EAFE-FE - EFE-AFE) are shown in Figure 5C. It can be seen that EAFE-FE and EFE-AFE increase from 306.08 and
Figure 5D shows the Weibull distribution results used to obtain the DBS. The slopes (βs) of all the Weibull distributions are > 14, indicating that all the specimens have better qualities (e.g., DBS, consistency, narrow distribution of the DBS, etc.). The Weibull distribution results show that the PLSBZST2 (x = 0.06) sample demonstrated the highest DBS among the four thick-film ceramics, and it was approximately 7.00 ± 0.20 μm thick. These results indicate that a fine and uniform grain-size distribution, dense microstructure, and small ceramic thickness can effectively improve DBS.
The Wrec and η values for the PLSBZST ceramics are shown in Figure 5E to further investigate the energy storage performance of the PLSBZST ceramics. The PLSBZST2 (x = 0.06) ceramic sample demonstrates the highest Wrec and η values among all specimens, at 20.09 J/cm3 and 91.34%, respectively. With increasing Sr2+ content, Pmax gradually decreases. However, the Wrec values of the PLSBZST3 (x = 0.08) and PLSBZST4 (x = 0.10) ceramic samples are larger than those of PLSBZST1 (x = 0.04) due to the increase in the relaxor AFE characteristics. Finally, as shown in Figure 5F, the Wrec and η values for PLSBZST2 are compared with those recently published for AFE ceramics[11,29,30,34,35,50-59]. The enhanced Wrec and η will be favorable for the larger discharged energy density and higher energy efficiency of the pulse power capacitors.
The analysis of the P-E hysteresis loops indicated that the PLSBZST2 ceramic sample exhibits the highest Wrec among all PLSBZST AFE ceramics. In addition, the stability of Wrec with respect to temperature and frequency is an important parameter for evaluating the energy-storage performance of dielectric capacitors[60]. Figure 6A shows the P-E hysteresis loops of the PLSBZST2 ceramic at 940 kV/cm and 10 Hz over the temperature range of 30-110 °C. The EAFE-FE, EFE-AFE, ΔE, and Pmax values as a function of temperature for PLSBZST2 ceramics are shown in Figure 6B. As temperature increases, the hysteresis loop slightly widens, which can be attributed to the continuous increase in the loss tangent. Moreover, Pmax decreases almost linearly from 41.13 to 36.86 μC/cm2 at 940 kV/cm with increasing temperature, which is probably due to the diffuse phase transition from an orthorhombic phase to a MCC phase[31], whereas ΔE increases from 14.87 to 39.89 kV/cm. The Wrec and η values as a function of temperature for the PLSBZST2 ceramics are shown in Figure 6C. With increasing temperature, Wrec gradually decreases from 13.39 to 11.65 J/cm3, corresponding to a variation of less than 15%. By contrast, η is initially constant with increasing temperature and then slightly decreases but remains above 86%. Because temperature does not significantly affect the shape of the P-E hysteresis loop, Wrec and η values show very small variations with increasing temperature, demonstrating excellent temperature stability. Figure 6D shows the P-E hysteresis loops for the PLSBZST2 ceramics at 880 kV/cm and room temperature over the frequency range of 0.2-100 Hz. The corresponding EAFE-FE, EFE-AFE, ΔE, and Pmax values are shown in Figure 6E as a function of frequency. With increasing measurement frequency, Pmax slightly decreases from 40.8 to 39.60 μC/cm2 at 880 kV/cm, corresponding to a variation of less than 3%, which is due to the small variation in the shape of the P-E hysteresis loop with increasing frequency. EAFE-FE and ΔE monotonically increase with increasing frequency, and EFE-AFE slightly decreases, resulting in a slowly increasing energy storage density and efficiency for PLSBZST2 [Figure 6F]. At a low frequency of 0.2 Hz, Wtot is the largest among the tested frequencies while Wrec is the smallest because of the wide loop, and η is only 85.31%. However, at other frequencies from 1 to 100 Hz, Wrec increases from 12.44 to 12.86 J/cm3, corresponding to a variation of less than 3.4%, while η remains above 91%. Overall, the PLSBZST2 ceramics exhibit excellent temperature and frequency stabilities over the measured ranges, indicating their potential for use in pulse power capacitor applications.
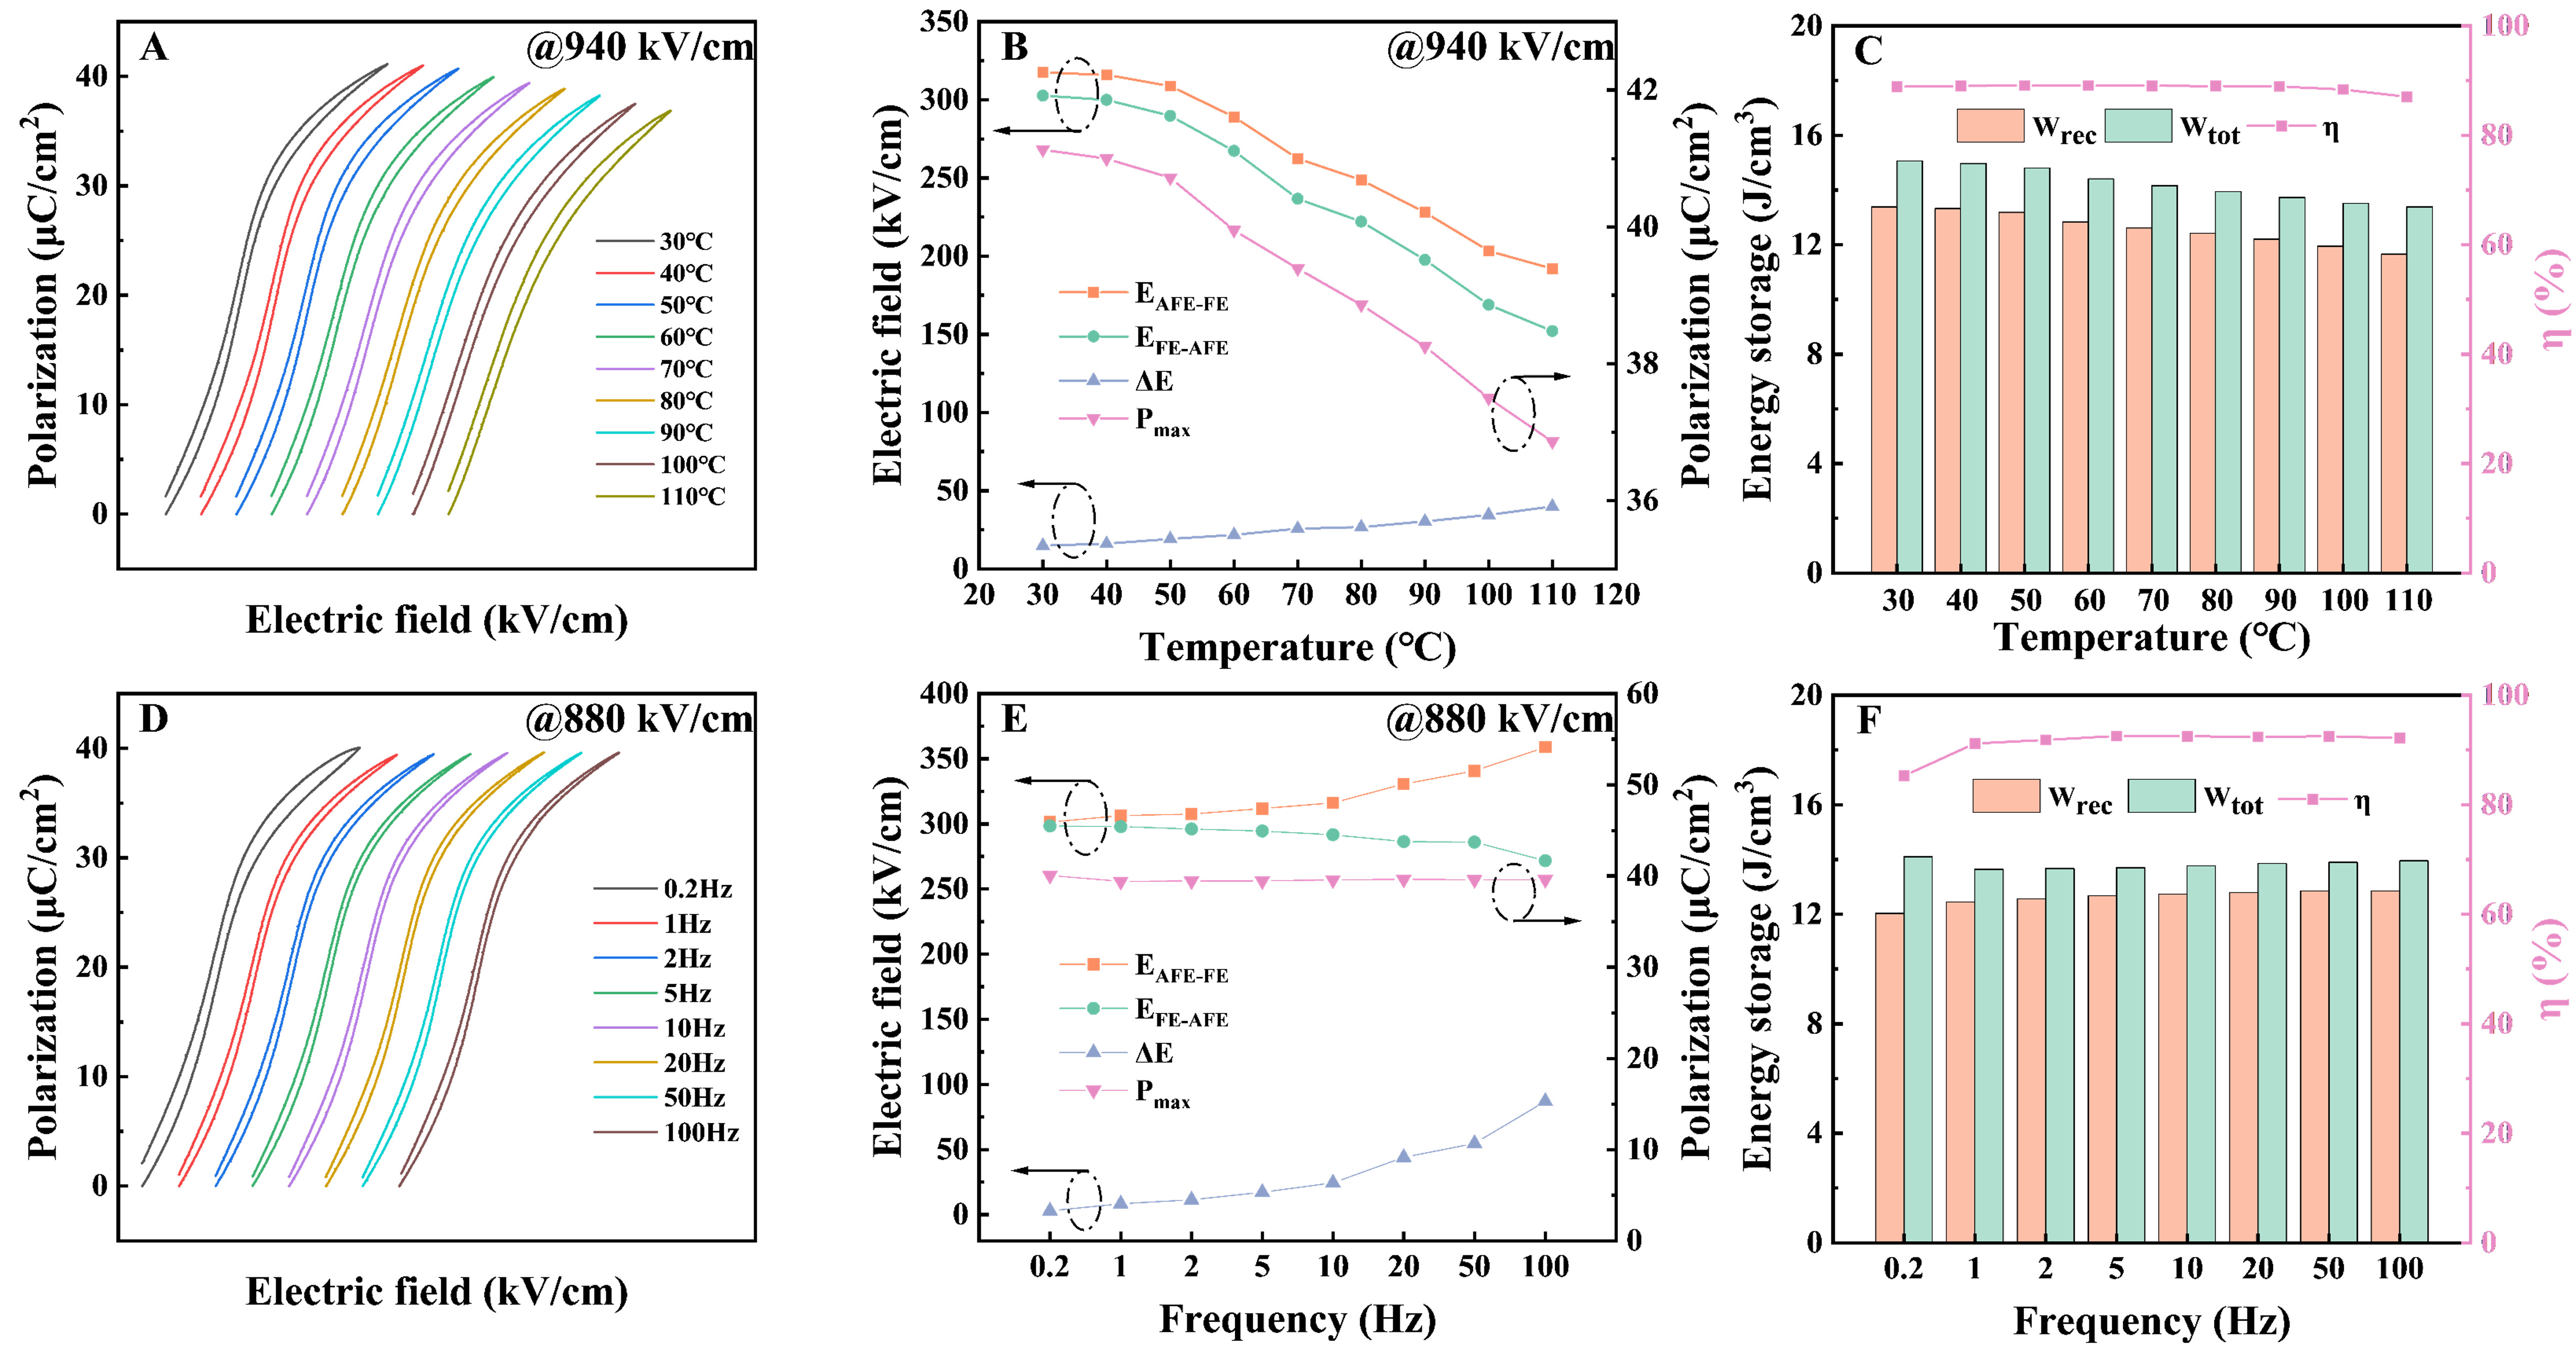
Figure 6. (A) P-E loops for PLSBZST2 thick-film ceramics at 940 kV/cm from 30 to 110 °C; (B) Corresponding EAFE-FE, EFE-AFE, ΔE, and Pmax values obtained at various temperatures; (C) Calculated Wtot, Wrec, and η values obtained at various temperatures; (D) P-E loops for the PLSBZST2 thick-film ceramic at 880 kV/cm from 0.2 to 100 Hz; (E) Corresponding EAFE-FE, EFE-AFE, ΔE, and Pmax obtained at various frequencies; (F) Calculated Wtot, Wrec, and η values obtained at various frequencies. P-E: Polarization - electric field; PLSBZST2: (Pb0.86La0.04Sr0.06Ba0.02)(Zr0.64Sn0.35Ti0.01)O3; Pmax: maximum polarization; Wtot: total energy storage density; Wrec: recoverable energy storage density.
Moreover, it was observed that the thickness of the ceramic was closely related to the energy storage density. For example, an energy storage density Wrec of 20.09 J/cm3 was obtained at 1,440 kV/cm for a PLSBZST2 ceramic with a thickness of 7.00 ± 0.20 μm. In our previous studies, Wrec was 12.9 J/cm3 at 570 kV/cm for a (PbBaSrLa)(ZrSn)O3 ceramic with a thickness of 32 μm[54], 9.84 J/cm3 at 440 kV/cm for a (PbLa)(ZrSn)O3 ceramic with a thickness of 50 μm[61], and 5.72 J/cm3 at 280 kV/cm for (PbLa)(ZrSnHf)O3 ceramic with a thickness of 50-70 μm[62]. The energy storage density increases with decreasing thickness in thick-film ceramics. The thickness dependence of the energy storage density reminds us of the general relationship of energy storage density as a function of thickness. Especially whether or not we can figure out a mathematical relation to describe this kind of relation. Furthermore, the thickness dependences of polarization, especially the maximum polarization and DBS, might also be figured out. In fact, the DBS may be related to the thickness via the Gerson-Marshall relation[63]:
where t is in cm and EDBS is in kV/cm.
In general, EDBS can be written as
where s1 is a constant, -0.39. Because the polarization is proportional to the electric field, P = εrε0E for linear ferroelectrics (ε0 is the vacuum dielectric constant) and P~E2 for nonlinear ferroelectrics (i.e., via the Rayleigh relation and even higher powers[64]), the polarization remains an exponential function:
where s2 is also a constant. The recoverable energy storage density is defined as Equation (2) i.e.,
where s0 is still a constant. Because Wrec is the product of the polarization and the electric field, there exists the following relationship among s0, s1, and s2:
We compared the data obtained with this study with DBS (a)[65-69], Pmax (b)[70-74], and Wrec (c)[75-79] data obtained in previous studies as a function of thickness[80-84] for bulk ceramics, thick film ceramics, and thin films (see Supplementary Table 1)[11,31,33-35,41-43,55,56,85-93]. The data were then fitted using Equations (8)-(10), and the results are shown in Figure 7A-C. We obtained s1, s2, and s0 values of -0.39 ± 0.03, -0.13 ± 0.03, and -0.43 ± 0.04, respectively. Here, s0 is notably less than the sum of s1 and s2, which likely resulted from the small polarization and electric field used to measure the recoverable energy storage density, because usually the applied electric field used for measuring the recoverable energy storage density is smaller than the DBS, and the polarization obtained at an electric field less than the DBS is smaller than the maximum polarization, and the larger the electric field, the larger the maximum polarization, the DBS and the recoverable energy storage density. Therefore, the absolute value of s0 will be less than the absolute sum of s1 + s2. For example, if less than 10% of each parameter is used, then a 20% error will be generated. Therefore, an s0 value of -0.42 will be obtained, which is similar to the actual s0 value of -0.43. In addition, it should be noted that the s1 value obtained here (-0.39) is the same as that obtained using Equation (7)[63].
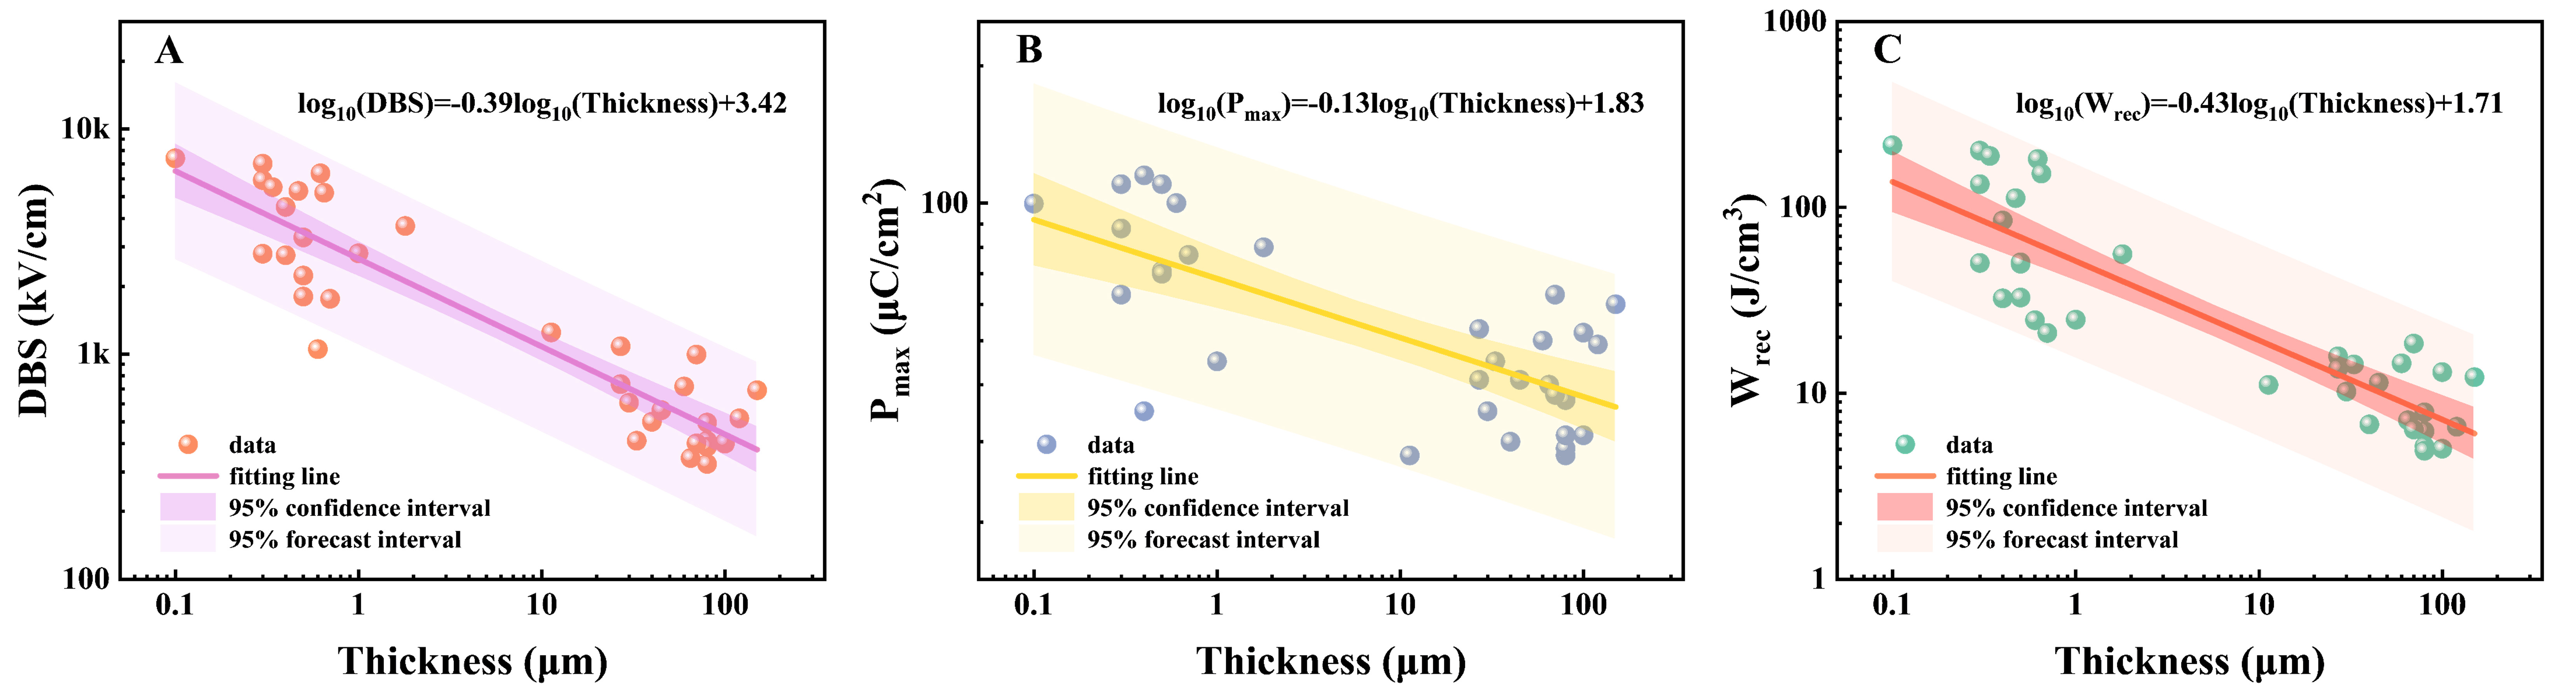
Figure 7. Fitted results of the DBS (A)[65-69], Pmax (B)[70-74] and Wrec (C)[75-79] values as a function of thickness[80-84] for data extracted from the literature[11,31,33-35,41-43,55,56,85-89,90-93]. DBS: Dielectric breakdown strength; Pmax: maximum polarization; Wrec: recoverable energy storage density.
The nominal energy density can be calculated by integrating the electric field with respect to the polarization for the P-E hysteresis loop. Therefore, the actual charging and discharging performance of ceramics can be evaluated using the resistor-inductor-capacitor (R-L-C) circuit[30,94,95]. According to the different circuit parameters, the circuit can be divided into an underdamped circuit and an overdamped circuit depending on the load. In an underdamped circuit, the pulse capacitor can release a higher current and thus a higher power density. In an overdamped circuit, the energy stored in the ceramic capacitor can be fully released[43], which is beneficial for analyzing the actual discharge performance of the ceramics. Figure 8A shows the discharged current as a function of time for the PLSBZST2 thick-film ceramic obtained under different electric fields in the overdamped circuit. The peak current gradually increases with increasing electric field. The discharged energy density (Wdis) may be defined as a function of time for different electric fields during charging, as shown in Figure 8B. In general, Wdis can be calculated via[96]
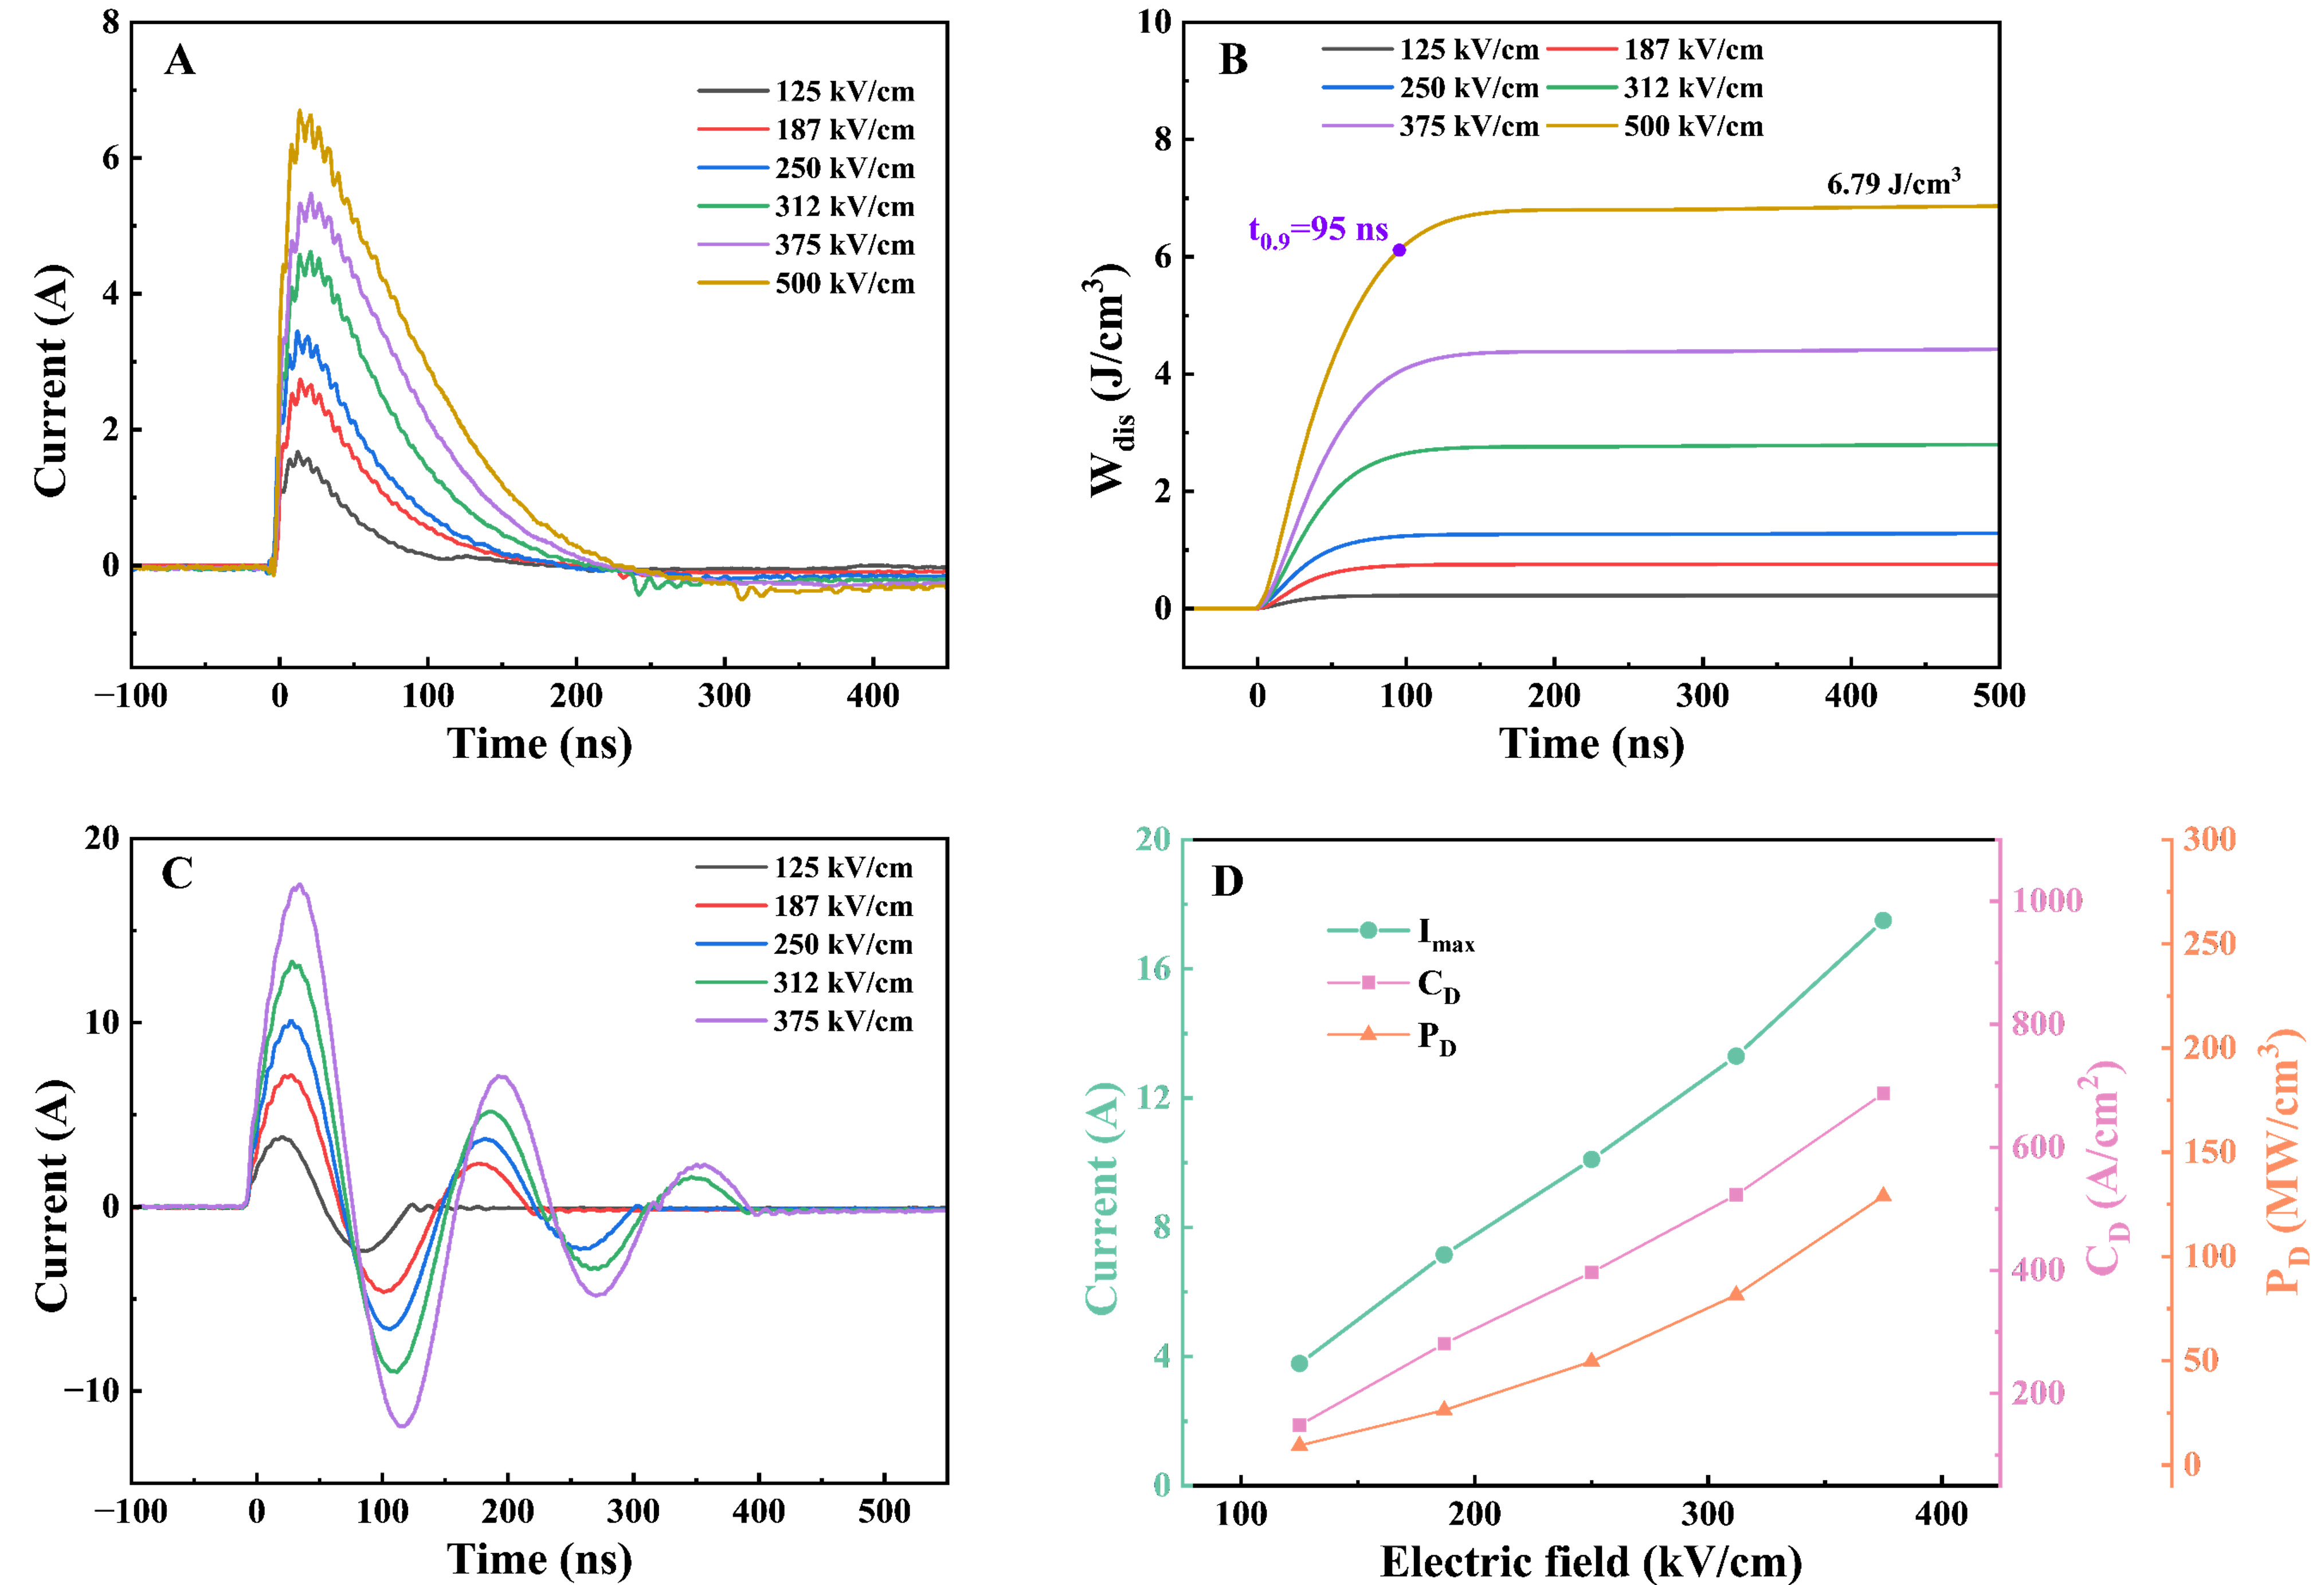
Figure 8. Discharge current as a function of time for the PLSBZST2 thick-film ceramic. (A) Overdamped discharge current obtained under various electric fields; (B) Corresponding Wdis values obtained under various electric fields; (C) Underdamped discharge current obtained under various electric fields; (D) Corresponding Imax, CD, and PD values as a function of the electric field. Imax: Peak current; PLSBZST2: (Pb0.86La0.04Sr0.06Ba0.02)(Zr0.64Sn0.35Ti0.01)O3; CD: discharged current density; PD: discharged power density; Wdis: discharged energy density.
where R is the total resistance in the overdamped circuit (here, R = 100 Ω), i(t) is the discharged current, and v is the effective volume of the sample under test. Therefore, Wdis increases with increasing electric field. When the electric field approaches 312 kV/cm near the transition field EAFE-FE, Wdis rapidly increases, and the maximum Wdis value of 6.79 J/cm3 is obtained at 500 kV/cm. The discharge time (t0.9) is defined as the time required to reach 90% of the discharged energy density Wdis[97]. At an electric field of 500 kV/cm, the PLSBZST2 ceramics can release 90% of Wdis in 95 ns, demonstrating rapid discharge. Figure 8C shows the discharged current as a function of time for the PLSBZST2 ceramic under different electric fields in an underdamped state. Here, the peak current (Imax) increases with increasing electric field. The oscillatory pulse current can be evaluated in terms of the discharged current density (CD) and power density (PD)[98]:
where Imax is the peak value of the first pulse current, E is the charging electric field, and S is the electrode area of the sample. Imax, CD, and PD are shown as functions of the electric field in Figure 8D. Here, Imax, CD, and PD monotonically increase with increasing electric field, and a pronounced increase occurs near the AFE-FE transition field. The maximum CD and PD values of 687.73 A/cm2 and 128.95 MW/cm3, respectively, are obtained under an electric field of 375 kV/cm. These results demonstrate that the PLSBZST2 ceramic exhibits a high discharged energy density, high discharged current, high power density, and short discharge time, indicating its potential for application in pulse-power devices.
CONCLUSIONS
In this study, (Pb0.92-xLa0.04SrxBa0.02)(Zr0.64Sn0.35Ti0.01)O3 (PLSBZST; x = 0.04, 0.06, 0.08 and 0.10) freestanding thick-film ceramics were successfully fabricated using the tape-casting process. The results show that the forward AFE-FE switching field and relaxor degree increase with increasing Sr2+ content, while a fine grain size and dense microstructure are beneficial for improving the DBS. In particular, the PLSBZST2 thick-film ceramic demonstrated a maximum Wrec of 20.09 J/cm3 with an η of 91.34% at 1,440 kV/cm, together with excellent frequency and temperature stabilities and an excellent discharging performance. In addition, under a load of 100 Ω, the PLSBZST2 ceramic exhibited a maximum Wdis value of 6.79 J/cm3 at 500 kV/cm and released 90% of this Wdis value within 95 ns. Moreover, maximum CD and PD values of 687.73 A/cm2 and 128.95 MW/cm3 were obtained. These findings indicate the potential of PLSBZST thick-film ceramics for use in pulse-power devices. Moreover, reciprocal exponential relationships of the maximum polarization, DBS, and Wrec as a function of the sample thickness were obtained. The s2, s1, and s0 exponents associated with these relationships were -0.13 ± 0.03, -0.39 ± 0.03, and -0.43 ± 0.04, respectively. Here, the value of exponent s1 is the same as that obtained using the Gerson-Marshall equation, and s0 is almost equal to (s1 + s2) 80%, which results from using 10% less than the maximum polarization and a lower electric field than that used for the DBS due to the lower electric field that was employed during measurement. The thickness dependence of the recoverable energy storage density directly indicates that the reduction on the thickness of the ceramic layer will be one of the important approaches to enhance the energy storage density for the pulse power capacitors.
DECLARATIONS
Authors’ contributions
Conception and design: Lu, S. G.; Wang, S.; Yan, X.
Experiments, data collection and analysis, data curation: Yan, X.; Yu, C.; Li, Y.
Writing of the original draft: Yan, X.; Wang, S.
Writing - review and editing: Lu, S. G.; Gao, X.; Wang, S.; Yao, Y.; Tao, T.; Liang, B.; Gong, W.; Niu, X.; Jian, X.
Supervision, project administration and funding acquisition: Lu, S. G.; Gao, X.; Jian, X.
Availability of data and materials
The data supporting the findings of this study are available within this Article and its Supplementary Materials. Further data are available from the corresponding authors upon request.
AI and AI-assisted tools statement
Not applicable.
Financial support and sponsorship
This work was supported by the Natural Science Foundation of China (Grant Nos. 52272105, 52202130, 52402161), the NSFC-Guangdong Joint Fund (Grant No. U1501246), the State Key Laboratory of Precision Electronic Manufacturing Technology and Equipment-opening fund (JMDZ202305), the Dongguan City Frontier Research Project (2019622101006), the Advanced Energy Science and Technology Guangdong Provincial Laboratory Foshan Branch-Foshan Xianhu Laboratory Open Fund-Key Project (Grant No. XHT2020-011), the Open Projects of the Guangdong Provincial Key Laboratory of Electronic Functional Materials and Devices, Huizhou University [grant numbers EFMD2022004Z and EFMD2024007Z], the Open Project of the Guangdong Provincial Key Laboratory of Energy Conversion Materials and Technology, Guangdong Technion-Israel Institute of Technology [MATEC2024KF003], and the Taishan Industrial Experts Program [No. tscx202507141].
Conflicts of interest
Gao, X. is affiliated with Shandong Industrial Ceramics Research and Design Institute Co., Ltd. The other authors declared that there are no conflicts of interest.
Ethical approval and consent to participate
Not applicable.
Consent for publication
Not applicable.
Copyright
© The Author(s) 2026.
Supplementary Materials
REFERENCES
1. Hao, X.; Zhai, J.; Kong, L. B.; Xu, Z. A comprehensive review on the progress of lead zirconate-based antiferroelectric materials. Prog. Mater. Sci. 2014, 63, 1-57.
2. Zhang, L.; Jing, R.; Zhang, S.; Jin, L. Multiscale microstructure design for high-performance dielectric energy storage materials. Microstructures 2026, 6, 2026002.
3. Luo, N.; Ma, L.; Luo, G.; et al. Well-defined double hysteresis loop in NaNbO3 antiferroelectrics. Nat. Commun. 2023, 14, 1776.
4. You, Y.; Fang, G.; Fan, M.; Guo, J.; Li, Q.; Wan, J. Leveraging novel microwave techniques for tailoring the microstructure of energy storage materials. Microstructures 2024, 4, 2024035.
5. Randall, C. A.; Fan, Z.; Reaney, I.; Chen, L. Q.; Trolier-McKinstry, S. Antiferroelectrics: history, fundamentals, crystal chemistry, crystal structures, size effects, and applications. J. Am. Ceram. Soc. 2021, 104, 3775-810.
6. Tan, X.; Ma, C.; Frederick, J.; Beckman, S.; Webber, K. G. The antiferroelectric ↔ ferroelectric phase transition in lead-containing and lead-free perovskite ceramics. J. Am. Ceram. Soc. 2011, 94, 4091-107.
7. Zhao, L.; Liu, Q.; Gao, J.; Zhang, S.; Li, J. F. Lead-free antiferroelectric silver niobate tantalate with high energy storage performance. Adv. Mater. 2017, 29, 1701824.
8. Luo, N.; Han, K.; Cabral, M. J.; et al. Constructing phase boundary in AgNbO3 antiferroelectrics: pathway simultaneously achieving high energy density and efficiency. Nat. Commun. 2020, 11, 4824.
9. Wang, J.; Shen, Z. Modeling-guided understanding microstructure effects in energy storage dielectrics. Microstructures. 2021, 1, 2021006.
10. Gao, J.; Zhang, Y.; Zhao, L.; et al. Enhanced antiferroelectric phase stability in La-doped AgNbO3: perspectives from the microstructure to energy storage properties. J. Mater. Chem. A. 2019, 7, 2225-32.
11. Wang, X.; Zhu, Q.; Sun, H.; et al. Ultrahigh energy storage density and efficiency in PLZST antiferroelectric ceramics via multiple optimization strategy. J. Eur. Ceram. Soc. 2023, 43, 4051-9.
12. Yao, Z.; Song, Z.; Hao, H.; et al. Homogeneous/inhomogeneous-structured dielectrics and their energy-storage performances. Adv. Mater. 2017, 29, 1601727.
13. Guo, J.; Yang, T. Giant energy storage density in Ba, La co-doped PbHfO3-based antiferroelectric ceramics by a rolling process. J. Alloys. Compd. 2021, 888, 161539.
14. Jiang, Y.; Zhu, C.; Zhao, P.; et al. Excellent energy storage performance of NaNbO3-based antiferroelectric ceramics with ultrafast charge/discharge rate. J. Eur. Ceram. Soc. 2021, 41, 6465-73.
15. Lin, Z.; Chen, Y.; Liu, Z.; Wang, G.; Rémiens, D.; Dong, X. Large energy storage density, low energy loss and highly stable (Pb0.97La0.02)(Zr0.66Sn0.23Ti0.11)O3 antiferroelectric thin-film capacitors. J. Eur. Ceram. Soc. 2018, 38, 3177-81.
16. Sun, N.; Du, J.; Zhao, Y.; et al. Flexible multilayer lead-free film capacitor with high energy storage performances via heterostructure engineering. J. Materiomics. 2022, 8, 772-80.
17. Palneedi, H.; Peddigari, M.; Hwang, G. T.; Jeong, D. Y.; Ryu, J. High-performance dielectric ceramic films for energy storage capacitors: progress and outlook. Adv. Funct. Mater. 2018, 28, 1803665.
18. Yang, L.; Kong, X.; Li, F.; et al. Perovskite lead-free dielectrics for energy storage applications. Prog. Mater. Sci. 2019, 102, 72-108.
19. Li, Y.; Gao, J.; Yang, T. Excellent energy density and efficiency in Ba and Sr co-doped (Pb,La)(Zr,Sn)O3 antiferroelectric ceramics. J. Phys. Chem. Solids. 2023, 172, 111046.
20. Pattipaka, S.; Lim, Y.; Son, Y. H.; Bae, Y. M.; Peddigari, M.; Hwang, G. Ceramic-based dielectric materials for energy storage capacitor applications. Materials 2024, 17, 2277.
21. Wang, X.; Shen, J.; Yang, T.; Dong, Y.; Liu, Y. High energy-storage performance and dielectric properties of antiferroelectric (Pb0.97La0.02)(Zr0.5Sn0.5-xTix)O3 ceramic. J. Alloys. Compd. 2016, 655, 309-13.
22. Wang, X.; Yang, T.; Shen, J. High-energy storage performance in (Pb0.98La0.02)(Zr0.45Sn0.55)0.995O3 AFE thick films fabricated via a rolling process. J. Am. Ceram. Soc. 2016, 99, 3569-72.
23. Zhang, Y.; Liu, P.; Shen, M.; et al. High energy storage density of tetragonal PBLZST antiferroelectric ceramics with enhanced dielectric breakdown strength. Ceram. Int. 2020, 46, 3921-6.
24. Huang, K.; Ge, G.; Bai, H.; et al. Ameliorative energy-storage properties stemmed from the refined grains in PBLZS antiferroelectric ceramics via introducing liquid phase sintering. J. Eur. Ceram. Soc. 2021, 41, 2450-7.
25. Mohapatra, P.; Fan, Z.; Cui, J.; Tan, X. Relaxor antiferroelectric ceramics with ultrahigh efficiency for energy storage applications. J. Eur. Ceram. Soc. 2019, 39, 4735-42.
26. Fu, Z.; Chen, X.; Li, Z.; et al. Unveiling the ferrielectric nature of PbZrO3-based antiferroelectric materials. Nat. Commun. 2020, 11, 3809.
27. Ge, P.; Tang, X.; Meng, K.; et al. Ultrahigh energy storage density and superior discharge power density in a novel antiferroelectric lead hafnate. Mater. Today. Phys. 2022, 24, 100681.
28. Zhao, P.; Wang, S.; Tang, H.; et al. Superior energy storage density and giant negative electrocaloric effects in (Pb0.98La0.02)(Zr, Sn)O3 antiferroelectric ceramics. Scr. Mater. 2021, 200, 113920.
29. Liu, X.; Li, Y.; Hao, X. Ultra-high energy-storage density and fast discharge speed of (Pb0.98-xLa0.02Srx)(Zr0.9Sn0.1)0.995O3 antiferroelectric ceramics prepared via the tape-casting method. J. Mater. Chem. A. 2019, 7, 11858-66.
30. Liu, X.; Yang, T.; Gong, W. Achieving ultrahigh energy-storage capability in PbZrO3-based antiferroelectric capacitors based on optimization of property parameters. J. Mater. Chem. A. 2022, 10, 4137-45.
31. Liu, X.; Zhao, Y.; Sun, N.; Li, Y.; Hao, X. Ultra-high energy density induced by diversified enhancement effects in (Pb0.98-xLa0.02Cax)(Zr0.7Sn0.3)0.995O3 antiferroelectric multilayer ceramic capacitors. Chem. Eng. J. 2021, 417, 128032.
32. Liu, X.; Yang, T.; Gong, W. Comprehensively enhanced energy-storage properties in (Pb1-3x/2Lax)(Zr0.995Ti0.005)O3 antiferroelectric ceramics via composition optimization. J. Mater. Chem. C. 2021, 9, 12399-407.
33. Niu, X.; Jiang, Y.; Liang, W.; et al. Boosted energy storage densities in lead-free Na0.5Bi0.5TiO3-based thick film ceramics via the compositional and microstructural tailoring. Chem. Eng. J. 2024, 496, 154047.
34. Li, C.; Yao, M.; Yang, T.; Yao, X. Optimizing energy storage performance of lead zirconate-based antiferroelectric ceramics by a phase modulation strategy. Chem. Eng. J. 2024, 497, 154913.
35. Li, Y.; Hu, T.; Chen, X.; Xie, J.; Shi, Y. Achieving high energy storage performance in PbHfO3-based antiferroelectric ceramics by Sr element doping. J. Alloys. Compd. 2024, 994, 174651.
36. Wang, X.; Shen, J.; Yang, T.; Xiao, Z.; Dong, Y. Phase transition and energy storage performance in Ba-doped PLZST antiferroelectric ceramics. J. Mater. Sci. Mater. Electron. 2015, 26, 9200-4.
37. Zhang, Q.; Liu, X.; Zhang, Y.; et al. Effect of barium content on dielectric and energy storage properties of (Pb,La,Ba)(Zr,Sn,Ti)O3 ceramics. Ceram. Int. 2015, 41, 3030-5.
38. Meng, X.; Zhao, Y.; Li, Y.; Hao, X. Systematical investigation on energy-storage behavior of PLZST antiferroelectric ceramics by composition optimizing. J. Am. Ceram. Soc. 2021, 104, 2170-80.
39. Breval, E.; Wang, C.; Dougherty, J. P.; Gachigi, K. W. PLZT phases near lead zirconate: 1. determination by X-ray diffraction. J. Am. Ceram. Soc. 2005, 88, 437-42.
40. Xing, Z.; Feng, Y.; Wei, X. Effect of Sn content on dielectric, piezoelectric and ferroelectric properties for Pb(Zr0.35Ti0.65)1-xSnxO3 ceramics near morphotropic phase boundary. J. Alloys. Compd. 2015, 627, 238-43.
41. Qi, H.; Zuo, R.; Xie, A.; et al. Ultrahigh energy-storage density in NaNbO3‐based lead-free relaxor antiferroelectric ceramics with nanoscale domains. Adv. Funct. Mater. 2019, 29, 1903877.
42. Liu, H.; Niu, X.; Wang, T.; et al. Superior energy storage properties in lead-free NaNbO3-based relaxor antiferroelectric ceramicsviaa combined optimization strategy. J. Mater. Chem. C. 2024, 12, 3962-71.
43. Yu, C.; Wang, S.; Yan, X.; et al. Excellent energy storage and charge-discharge performance in (Pb1-xCax)(Zr0.55Sn0.45)O3 antiferroelectric ceramics. ACS. Appl. Mater. Interfaces. 2025, 17, 5066-77.
44. He, H.; Tan, X. Electric-field-induced transformation of incommensurate modulations in antiferroelectric Pb0.99Nb0.02[(Zr1-xSnx)1-yTiy]0.98O3. Phys. Rev. B. 2005, 72, 024102.
45. Tunkasiri, T.; Rujijanagul, G. Dielectric strength of fine grained barium titanate ceramics. J. Mater. Sci. Lett. 1996, 15, 1767-9.
46. Zhao, M.; Shen, X.; Wang, J.; Wang, J.; Zhang, J.; Zhao, L. Superior comprehensive energy storage performances in Eu-doped AgNbO3 antiferroelectric ceramics. Chem. Eng. J. 2023, 478, 147527.
47. Zhang, Q.; Dan, Y.; Chen, J.; et al. Effects of composition and temperature on energy storage properties of (Pb,La)(Zr,Sn,Ti)O3 antiferroelectric ceramics. Ceram. Int. 2017, 43, 11428-32.
48. Gao, H.; Sun, N.; Li, Y.; et al. Enhanced electrocaloric effect and energy-storage performance in PBLZT films with various Ba2+ content. Ceram. Int. 2016, 42, 16439-47.
49. Xu, R.; Xu, Z.; Feng, Y.; Tian, J.; Huang, D. Energy storage and release properties of Sr-doped (Pb,La)(Zr,Sn,Ti)O3 antiferroelectric ceramics. Ceram. Int. 2016, 42, 12875-9.
50. Luo, Y.; Han, B.; Fu, Z.; et al. High polarization stability of Sr modified Pb(Zr,Sn)NbO3 antiferroelectric ceramics. J. Am. Ceram. Soc. 2022, 105, 6765-74.
51. Wang, H.; Liu, Y.; Yang, T.; Zhang, S. Ultrahigh energy-storage density in antiferroelectric ceramics with field-induced multiphase transitions. Adv. Funct. Mater. 2019, 29, 1807321.
52. Yang, Y.; Liu, P.; Zhang, Y.; et al. Low electric-field-induced strain and high energy storage efficiency in (Pb,Ba,La)(Zr,Sn,Ti)O3 antiferroelectric ceramics through regulating the content of La. Ceram. Int. 2020, 46, 18106-13.
53. Wang, S.; Zhao, P.; Jian, X.; et al. Large energy storage density and electrocaloric strength of Pb0.97La0.02(Zr0.46-xSn0.54Tix)O3 antiferroelectric thick film ceramics. Scr. Mater. 2022, 210, 114426.
54. Wang, S.; Li, W.; Yu, Y.; et al. Ultra-high energy storage density in PBSLZS antiferroelectric thick film ceramics. Scr. Mater. 2024, 252, 116287.
55. Meng, X.; Zhao, Y.; Li, Y.; Hao, X. Simultaneously achieving ultrahigh energy density and power density in PbZrO3-based antiferroelectric ceramics with field-induced multistage phase transition. J. Alloys. Compd. 2021, 868, 159149.
56. Hu, J.; Wang, W.; Yang, Y.; et al. Achieving ultrahigh energy storage performance of PBLZST-based antiferroelectric composite ceramics via interfacial polarization engineering. J. Eur. Ceram. Soc. 2024, 44, 7642-50.
57. Ma, J.; Zhang, J.; Guo, J.; et al. Achieving ultrahigh energy storage density in lead-free sodium niobate-based ceramics by modulating the antiferroelectric phase. Chem. Mater. 2022, 34, 7313-22.
58. Bi, W.; Li, L.; Tian, G.; et al. Comprehensive energy-storage performance enhancement in relaxor anti-ferroelectrics via strengthening local polarization. Chem. Eng. J. 2023, 478, 147383.
59. Chen, L.; Zhou, J.; Xu, L.; et al. Achieving ultra-short discharge time and high energy density in lead-based antiferroelectric ceramics by A-site substitution. Chem. Eng. J. 2022, 447, 137367.
60. Liu, X.; Li, Y.; Li, Y.; Hao, X. Giant energy-storage density and thermally activated phase transition in (Pb0.96La0.04)(Zr0.99Ti0.01)O3 antiferroelectric ceramics. ACS. Appl. Energy. Mater. 2021, 4, 4897-902.
61. Wang, S.; Chen, X.; Jian, X.; et al. High energy-storage density and giant negative electrocaloric effect in PLZS antiferroelectric thick film ceramics prepared via the tape-casting process. J. Alloys. Compd. 2024, 996, 174724.
62. Li, W.; Wang, S.; Lin, C.; et al. Enhanced energy-storage density in (Pb0.98La0.02)(Zr0.45-xSn0.55Hfx)0.995O3 antiferroelectric ceramics. Scr. Mater. 2024, 242, 115959.
63. Gerson, R.; Marshall, T. C. Dielectric breakdown of porous ceramics. J. Appl. Phys. 1959, 30, 1650-3.
64. Hall, D. A.; Stevenson, P. J. High field dielectric behaviour of ferroelectric ceramics. Ferroelectrics 1999, 228, 138-58.
65. Shi, M.; Pan, X.; Lin, D.; et al. Localized chemical disorder induced superior energy storage performance of PbZrO3-based antiferroelectric ceramics. Chem. Eng. J. 2025, 514, 163459.
66. Hu, P.; Yao, M.; Yang, T.; Yao, X. Ultrahigh energy storage density and efficiency achieved in PbZrO3-based antiferroelectric ceramics via phase modulation engineering. ACS. Appl. Mater. Interfaces. 2025, 17, 26881-91.
67. Chen, L.; Li, Y.; Zhang, Q.; Hao, X. Electrical properties and energy-storage performance of (Pb0.92Ba0.05La0.02)(Zr0.68Sn0.27Ti0.05)O3 antiferroelectric thick films prepared by tape-casing method. Ceram. Int. 2016, 42, 12537-42.
68. Jiang, J.; Meng, X.; Li, L.; et al. Ultrahigh energy storage density in lead-free relaxor antiferroelectric ceramics via domain engineering. Energy. Storage. Mater. 2021, 43, 383-90.
69. Wang, X.; Zhao, H.; Tang, M.; et al. Samarium-modified PLZST-based antiferroelectric energy storage ceramics for low-temperature sintering in reducing atmosphere. Ceram. Int. 2024, 50, 21736-44.
70. Wang, X.; Sun, H.; Wang, M.; et al. Low-temperature sintering of PLSZT-based antiferroelectric ceramics in reducing atmosphere for energy storage. J. Eur. Ceram. Soc. 2024, 44, 898-906.
71. Ye, W.; Zhu, C.; Xiao, Y.; et al. Remarkable energy-storage performances and excellent stability in CaTiO3-doped BiFeO3-BaTiO3 relaxor ferroelectric ceramics. J. Eur. Ceram. Soc. 2023, 43, 900-8.
72. Deng, T.; Liu, Z.; Hu, T.; Dai, K.; Hu, Z.; Wang, G. Excellent energy-storage performance in Bi0.5Na0.5TiO3-based lead-free composite ceramics via introducing pyrochlore phase Sm2Ti2O7. Chem. Eng. J. 2023, 465, 142992.
73. Che, Z.; Ma, L.; Luo, G.; et al. Phase structure and defect engineering in (Bi0.5Na0.5)TiO3-based relaxor antiferroelectrics toward excellent energy storage performance. Nano. Energy. 2022, 100, 107484.
74. Nguyen, M. D. Effect of substrate and electrode on the crystalline structure and energy storage performance of antiferroelectric PbZrO3 films. Thin. Solid. Films. 2021, 717, 138441.
75. Chen, Q.; Zhang, Y.; Zhang, J.; et al. Effects of Ti-doping on energy storage properties and cycling stability of Pb0.925La0.05ZrO3 antiferroelectric thin films. Mater. Sci. Eng. B. 2022, 286, 116024.
76. Li, Y. Z.; Wang, Z. J.; Bai, Y.; Zhang, Z. D. High energy storage performance in Ca-doped PbZrO3 antiferroelectric films. J. Eur. Ceram. Soc. 2020, 40, 1285-92.
77. Yang, F.; Shi, Y. J.; Lin, L.; et al. Improvement of energy storage performance in PbZr0.52Ti0.48O3/PbZrO3 multilayer thin films via regulating PbZrO3 thickness. Curr. Appl. Phys. 2023, 50, 145-52.
78. Cai, H.; Yan, S.; Dong, X.; Cao, F.; Wang, G. Significantly enhanced energy storage performance by constructing TiO2 nanowire arrays in PbZrO3-based antiferroelectric films. Ceram. Int. 2020, 46, 6436-42.
79. Ahn, C. W.; Amarsanaa, G.; Won, S. S.; Chae, S. A.; Lee, D. S.; Kim, I. W. Antiferroelectric thin-film capacitors with high energy-storage densities, low energy losses, and fast discharge times. ACS. Appl. Mater. Interfaces. 2015, 7, 26381-6.
80. Chen, T.; Wang, J.; Zhong, X.; Wang, F.; Li, B.; Zhou, Y. High energy density capacitors based on 0.88BaTiO3-0.12Bi(Mg0.5,Ti0.5)O3/PbZrO3 multilayered thin films. Ceram. Int. 2014, 40, 5327-32.
81. Zhang, J.; Zhang, Y.; Chen, Q.; et al. Enhancement of energy-storage density in PZT/PZO-based multilayer ferroelectric thin films. Nanomaterials. 2021, 11, 2141.
82. Ma, B.; Hu, Z.; Koritala, R. E.; Lee, T. H.; Dorris, S. E.; Balachandran, U. PLZT film capacitors for power electronics and energy storage applications. J. Mater. Sci:. Mater. Electron. 2015, 26, 9279-87.
83. Park, M. H.; Kim, H. J.; Kim, Y. J.; Moon, T.; Kim, K. D.; Hwang, C. S. Thin HfxZr1-xO2 films: a new lead-free system for electrostatic supercapacitors with large energy storage density and robust thermal stability. Adv. Energy. Mater. 2014, 4, 1400610.
84. Sun, Z.; Ma, C.; Liu, M.; et al. Ultrahigh energy storage performance of lead-free oxide multilayer film capacitors via interface engineering. Adv. Mater. 2016, 29, 1604427.
85. Hao, X.; Wang, Y.; Zhang, L.; Zhang, L.; An, S. Composition-dependent dielectric and energy-storage properties of (Pb,La)(Zr,Sn,Ti)O3 antiferroelectric thick films. Appl. Phys. Lett. 2013, 102, 163903.
86. Yang, B.; Zhang, Y.; Pan, H.; et al. High-entropy enhanced capacitive energy storage. Nat. Mater. 2022, 21, 1074-80.
87. Shu, L.; Shi, X.; Zhang, X.; et al. Partitioning polar-slush strategy in relaxors leads to large energy-storage capability. Science 2024, 385, 204-9.
88. Pan, H.; Lan, S.; Xu, S.; et al. Ultrahigh energy storage in superparaelectric relaxor ferroelectrics. Science 2021, 374, 100-4.
89. Kim, J.; Saremi, S.; Acharya, M.; et al. Ultrahigh capacitive energy density in ion-bombarded relaxor ferroelectric films. Science 2020, 369, 81-4.
90. Pan, H.; Li, F.; Liu, Y.; et al. Ultrahigh-energy density lead-free dielectric films via polymorphic nanodomain design. Science 2019, 365, 578-82.
91. Liu, Y.; Zhang, Y.; Wang, J.; et al. Ultrahigh capacitive energy storage through dendritic nanopolar design. Science 2025, 388, 211-6.
92. Han, S.; Kim, J. S.; Park, E.; et al. High energy density in artificial heterostructures through relaxation time modulation. Science 2024, 384, 312-7.
93. Yang, B.; Liu, Y.; Jiang, R.; et al. Enhanced energy storage in antiferroelectrics via antipolar frustration. Nature 2025, 637, 1104-10.
94. Xu, R.; Zhu, Q.; Xu, Z.; Feng, Y.; Wei, X. PLZST antiferroelectric ceramics with promising energy storage and discharge performance for high power applications. J. Am. Ceram. Soc. 2019, 103, 1831-8.
95. Zhang, Y.; Li, Y.; Hao, X.; Jiang, H.; Zhai, J. Flexible antiferroelectric thick film deposited on nickel foils for high energy-storage capacitor. J. Am. Ceram. Soc. 2019, 102, 6107-14.
96. Wang, X.; Sun, H.; Zhao, H.; et al. Ultrahigh energy storage density and efficiency in orthorhombic PLZST antiferroelectric ceramics via composition regulation. ACS. Appl. Mater. Interfaces. 2024, 16, 17787-96.
97. Huang, J.; Qi, H.; Gao, Y.; et al. Expanded linear polarization response and excellent energy-storage properties in (Bi0.5Na0.5)TiO3-KNbO3 relaxor antiferroelectrics with medium permittivity. Chem. Eng. J. 2020, 398, 125639.
Cite This Article
 Open Access
How to Cite
Lu, S.G.; Yan, X.; Gao, X.; Yu, C.; Li, Y.; Wang, S.; Yao, Y.; Tao, T.; Liang, B.; Gong, W.; Niu, X.; Jian, X. Incommensurate modulations and thickness-dependent energy storage density in (PbLaSrBa)(ZrSnTi)O3 relaxor antiferroelectric thick-film ceramics. Microstructures 2026, 6, 20260135. https://dx.doi.org/10.20517/microstructures.2026.93
Download Citation
If you have the appropriate software installed, you can download article citation data to the citation manager of your choice. Simply select your manager software from the list below and click on download.
Export Citation File
Type of Import
Tips on Downloading Citation
Citation Manager File Format
Type of Import
Direct Import: When the Direct Import option is selected (the default state), a dialogue box will give you the option to Save or Open the downloaded citation data. Choosing Open will either launch your citation manager or give you a choice of applications with which to use the metadata. The Save option saves the file locally for later use.
Indirect Import: When the Indirect Import option is selected, the metadata is displayed and may be copied and pasted as needed.
About This Article
Copyright

Data & Comments
Data
0











Comments
Comments must be written in English. Spam, offensive content, impersonation, and private information will not be permitted. If any comment is reported and identified as inappropriate content by OAE staff, the comment will be removed without notice. If you have any queries or need any help, please contact us at [email protected].