

Microstructure regulation of hollow AuAg alloy nanobowls toward high-performance electrochemical urea biosensing
 0
Graphical Abstract
Abstract
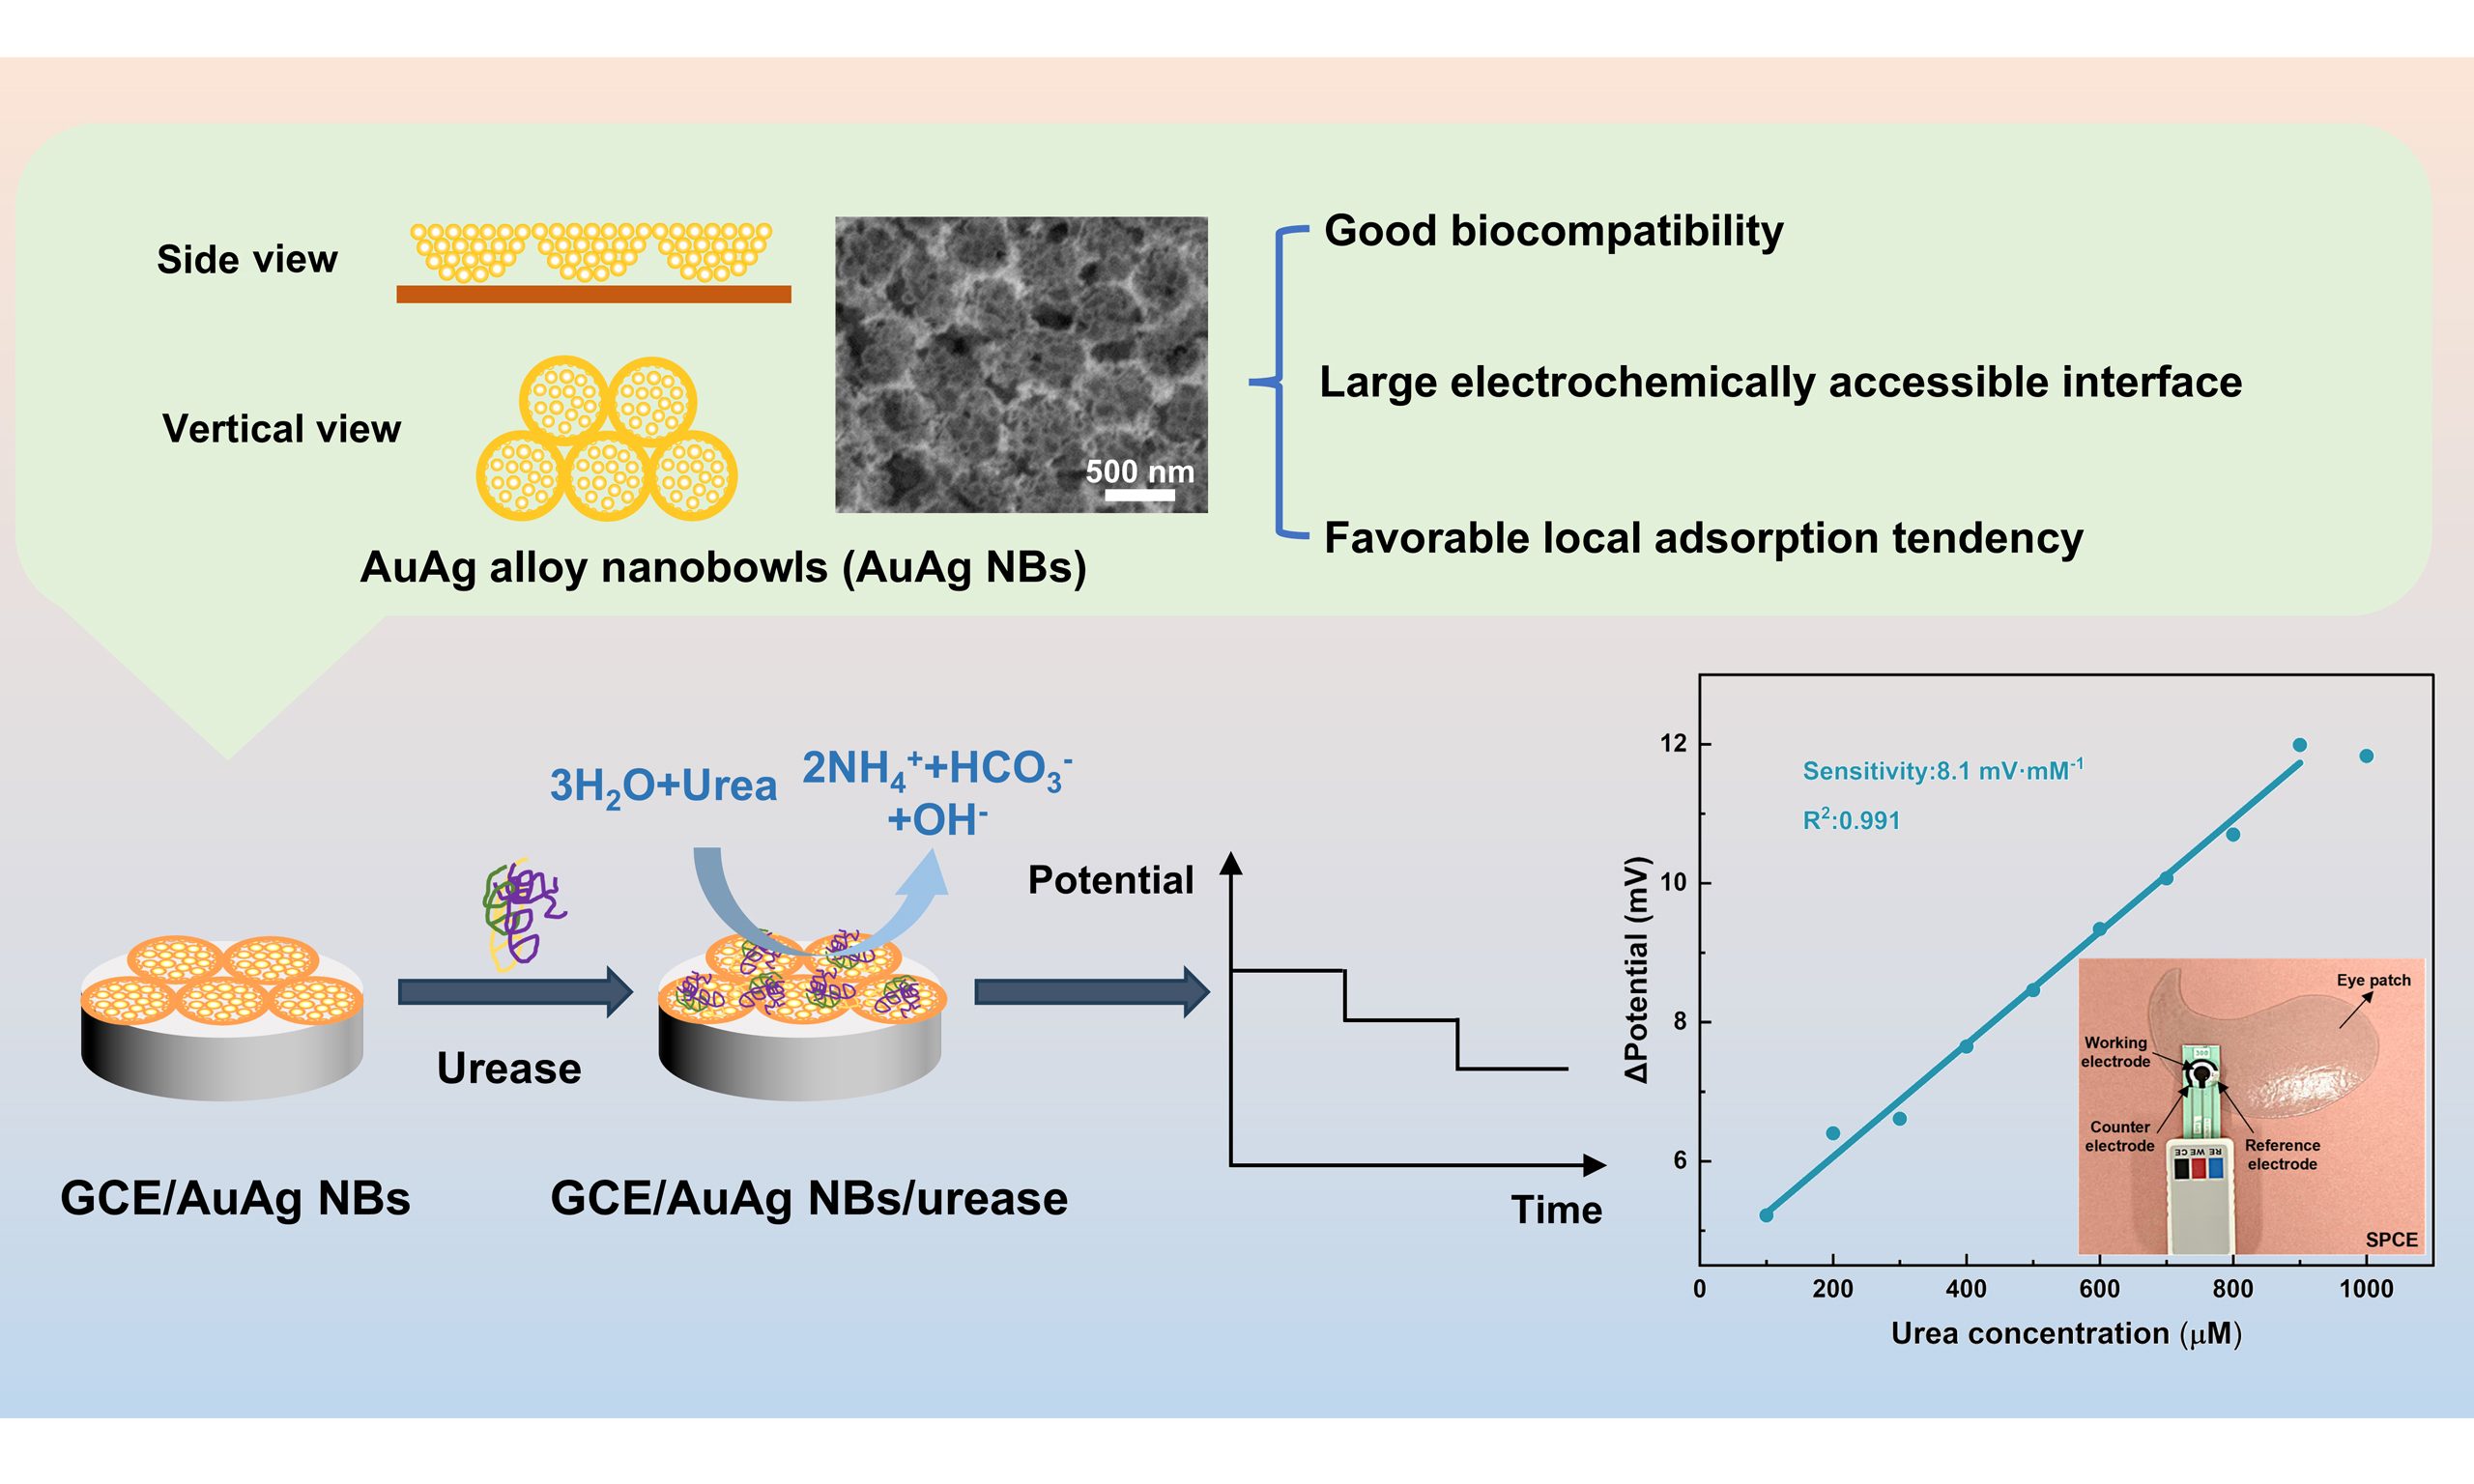
AuAg alloys possess excellent electrical conductivity and biocompatibility. AuAg alloy nanobowls (AuAg NBs) were fabricated using a self-assembled polystyrene microsphere film as the template via an in situ galvanic replacement reaction between Ag and HAuCl4. The AuAg NBs exhibited a hierarchical hollow architecture consisting of large bowl-like structures containing smaller bowls. By employing the AuAg NBs as an electrode-modifying material and integrating them with urease, we constructed a glassy carbon electrode (GCE)/AuAg NBs/urease electrochemical sensor for the detection of urea. The unique hierarchical nanobowl structure provides a large electrochemically accessible surface area for urease immobilization, while density functional theory (DFT) calculations using a simplified Gly-His model indicate a favorable local adsorption tendency on
Keywords


 Download PDF
INTRODUCTION
Owing to the synergistic effect between gold and silver, AuAg alloys exhibit excellent electrical conductivity, structural stability, and biocompatibility. Au-Ag bimetallic nanomaterials with diverse morphologies, such as nanoparticles, nanoclusters, and nanorods, have been successfully prepared and widely applied in electrocatalysis, surface-enhanced Raman scattering detection, and related fields[1-4]. In comparison, hollow porous AuAg alloys possess unique advantages. Their large specific surface area provides abundant active sites and sufficient interfaces for biomolecule immobilization and electron transfer[5,6]. Therefore, employing hollow porous AuAg alloys as electrode-modifying materials and combining them with enzymes to construct electrochemical biosensors offer significant advantages.
Urea, as the end product of human protein metabolism, exhibits concentration variations that can be used to diagnose various diseases such as renal failure and dry eye disease (DED), holding great significance in clinical research[7,8]. The urea levels in DED patients were 26.78 ± 5.70 mg·dL-1, significantly lower than those in healthy individuals (41.72 ± 6.86 mg·dL-1)[8]. These findings suggest that tear urea may serve as a potential biomarker for DED. Currently, urea detection methods mainly include colorimetry, chromatography, non-enzymatic detection, and enzymatic detection[9-13]. Notably, electrochemical methods offer advantages such as high sensitivity, excellent stability, and ease of operation, and have therefore become an active area of research in biosensing[14,15].
Hierarchical and hollow Au/Ag-based nanostructures have been developed using various synthetic strategies. Choi et al. and Liu et al. prepared hollow Au-Ag nanospheres and porous nanoshells using Ag sacrificial templates, while Hou et al. obtained hierarchical nanoporous AuAg alloys through dealloying and thermal annealing[16-18]. In contrast, AuAg alloy nanobowls (AuAg NBs) were fabricated using self-assembled polystyrene (PS) microsphere films as templates[19,20], followed by an in situ galvanic replacement reaction between Ag and HAuCl4 at room temperature. This approach enables the formation of a distinct structure combining long-range two-dimensional periodic ordering with a hierarchical configuration of smaller hollow bowls nested within larger bowls.
In this work, AuAg NBs exhibit superior urease immobilization capability compared with Ag film, AuAg alloy nanoparticles (AuAg NPs), and polypyrrole (PPy). A potentiometric biosensor constructed with AuAg NBs and urease shows a good linear response. We integrated miniaturized, flexible screen-printed electrodes with AuAg NBs into eye patches. This integration demonstrates the potential of the sensing platform for tear-based urea analysis and future point-of-care applications related to DED screening.
MATERIALS AND METHODS
Materials
Chloroauric acid, tetrahydrofuran (THF), nitric acid, sodium chloride, disodium hydrogen phosphate dodecahydrate, sodium dihydrogen phosphate, urea, Nafion solution, sodium hydroxide (NaOH), potassium ferricyanide, potassium ferrocyanide trihydrate, and potassium chloride were purchased from Aladdin Biological Technology Co., Ltd., China. Silver nitrate, sodium dodecyl sulfate (SDS), and 0.05 μm alumina suspension were purchased from Alfa Aesar. Dimethylamine borane complex (DMAB) and carboxylated PS microspheres were purchased from Energy Chemical. Urease from jack bean (200-300 U/mg) was purchased from Shanghai Macklin Biochemical Co., Ltd. Ethanol was purchased from Sinopharm Chemical Reagent Co., Ltd., China. Glassy carbon electrodes (GCE, 3 mm diameter) were purchased from Yueci Electronics, China. Screen-printed carbon electrodes (SPCE, 4 mm diameter) were purchased from Changsha Sanjun Electronics Co., Ltd., China. Artificial tear solution was purchased from Dongguan Chuangfeng Automation Co., Ltd., China. Deionized water was used throughout all experiments.
Preparation of PS@Ag film
In a clean Petri dish, add 10 mM AgNO3 solution, then slowly add an appropriate amount of 1 wt% PS sphere solution (deionized water:ethanol = 1:1). After 5 min to allow complete assembly of the PS spheres, add 1 drop of 2 wt% SDS solution. The Petri dish was sealed with plastic wrap and punctured with small holes. Subsequently, 2 g of finely ground DMAB powder and 2 mL of 6 M HNO3 solution were placed in the lower compartment of a desiccator. The Petri dish containing the PS self-assembled film was carefully placed on the upper stage of the desiccator. After 24 h of reaction, PS@Ag nanonet films were obtained[20].
Preparation of AuAg NBs
A mixed solution of 3 mM HAuCl4 and 150 mM Na2HPO4 was prepared as the reaction solution. The as-prepared PS@Ag film was transferred to this reaction solution using a hydrophilic glass slide and left to react at room temperature for 30 min. Subsequently, the film was loaded onto a glass slide or a pre-cleaned glassy carbon electrode and dried. The film was then immersed in THF for approximately 1 h to remove the PS spheres and subsequently soaked in saturated NaCl solution to dissolve AgCl, yielding the AuAg NBs.
Preparation of bioelectrodes
The GCE electrodes were polished with 0.05 μm alumina suspension and rinsed alternately with deionized water and ethanol 2-3 times. For comparison, a 10 μL aliquot of the prepared AuAg NPs dispersion was drop-cast onto the GCE surface, followed by urease immobilization[21]. The loadings of AuAg NBs and
Different volumes of urease solution (5, 7.5, 10, and 15 μL; 10 mg mL-1) were dropped onto the electrode surface to optimize the urease loading. After the immobilized urease had fully dried, 2 μL of 0.5 wt% Nafion solution was cast onto the modified electrode to protect the electrode surface and eliminate potential interferences. The electrode was rinsed with 0.01 M phosphate buffer solution (PBS) at each step to remove excess enzyme and Nafion.
Characterizations
Scanning electron microscopy (SEM) was performed using a Hitachi S-4800 microscope (Hitachi High-Technologies Corporation, Japan) at 3 kV. Transmission electron microscopy (TEM) was performed on a JEM 2100 microscope (JEOL Ltd., Japan) at 200 kV. X-ray diffraction (XRD) patterns were collected using a D8 FOCUS diffractometer (Bruker AXS GmbH, Germany). Ultraviolet-visible (UV-vis) spectra were recorded on a Cary 500 spectrophotometer (Varian Australia Pty Ltd., Australia). The Fourier-transform infrared (FTIR) spectra of the materials were recorded using a Nicolet iS10 FTIR spectrometer (Thermo Fisher Scientific, USA). X-ray photoelectron spectroscopy (XPS) measurements were performed using a K-Alpha X-ray photoelectron spectrometer (Thermo Fisher Scientific, USA) with Al Kα radiation and the C 1s peak at 284.8 eV as an internal standard.
Electrochemical measurements
All electrochemical measurements were performed using the Bio-Logic electrochemical workstation (SP-50e, BioLogic Science Instruments SAS, France), with an Ag/AgCl electrode as the reference electrode and a Pt plate as the counter electrode. Cyclic voltammetry (CV) curves were recorded in 0.01 M PBS containing
Adsorption energy calculation
Density functional theory (DFT) calculations were carried out using the Vienna Ab Initio Simulation Package (VASP)[22]. The exchange-correlation interactions were described within the generalized gradient approximation (GGA) using the Perdew-Burke-Ernzerhof (PBE) functional. The interactions between the ionic cores and valence electrons were treated using the projected augmented wave (PAW) method[23], with a plane-wave kinetic energy cutoff of 450 eV. Partial occupancies of the Kohn-Sham orbitals were treated using the Gaussian smearing method with a smearing width of 0.05 eV. The electronic self-consistent field (SCF) calculations were considered converged when the total energy change was less than 1 × 10⁻⁵ eV, while the structural optimization was terminated when the residual force on each atom was below 0.02 eV Å-1. A vacuum layer of 18 Å was introduced perpendicular to the slab surface to eliminate interactions between periodic images. For geometry optimization, Brillouin-zone integrations were performed using Γ-centered k-point meshes of 2 × 2 × 1 for the AuAg NPs and 1 × 2 × 1 for all other models. Long-range van der Waals interactions were taken into account using Grimme’s D3 dispersion correction scheme[24]. The adsorption energy (Eads) was calculated according to Equation (1):
where Etot, Eslab, and Emol represent the total energy of the adsorption structure, the energy of the substrate (AuAg NPs, AuAg NBs, or PPy with a degree of polymerization of 2), and the energy of the molecule (deprotonated Gly-His dipeptide), respectively. The simplified Gly-His dipeptide model cannot fully capture the complex three-dimensional structure, adsorption orientation, and solvent effects of intact urease. Therefore, the calculated adsorption energies are used primarily to compare relative local adsorption tendencies on different substrates.
RESULTS AND DISCUSSION
Synthetic strategy and material characterizations
The overall schematic diagram of the synthesis of AuAg NBs is shown in Figure 1. In step I, the PS sphere self-assembled film was immersed in the AgNO3 solution, and Ag+ was slowly reduced by BH3 gas for 24 h to form elemental Ag, yielding a long-range-ordered PS@Ag film [reaction Equation (2)]. In step II, the PS@Ag film was placed on the surface of the mixed reaction solution of HAuCl4 and Na2HPO4, where a galvanic replacement reaction occurred. During the reaction, most of the metallic Ag was replaced by Au, while a small amount of AgCl formed as a by-product [reaction Equation (3)]. In step III, following the principle of like dissolves like, PS@AuAg was immersed in THF to remove the PS spheres. The AgCl by-product can be removed by soaking the film in saturated NaCl solution[25]. Finally, AuAg NBs were obtained.
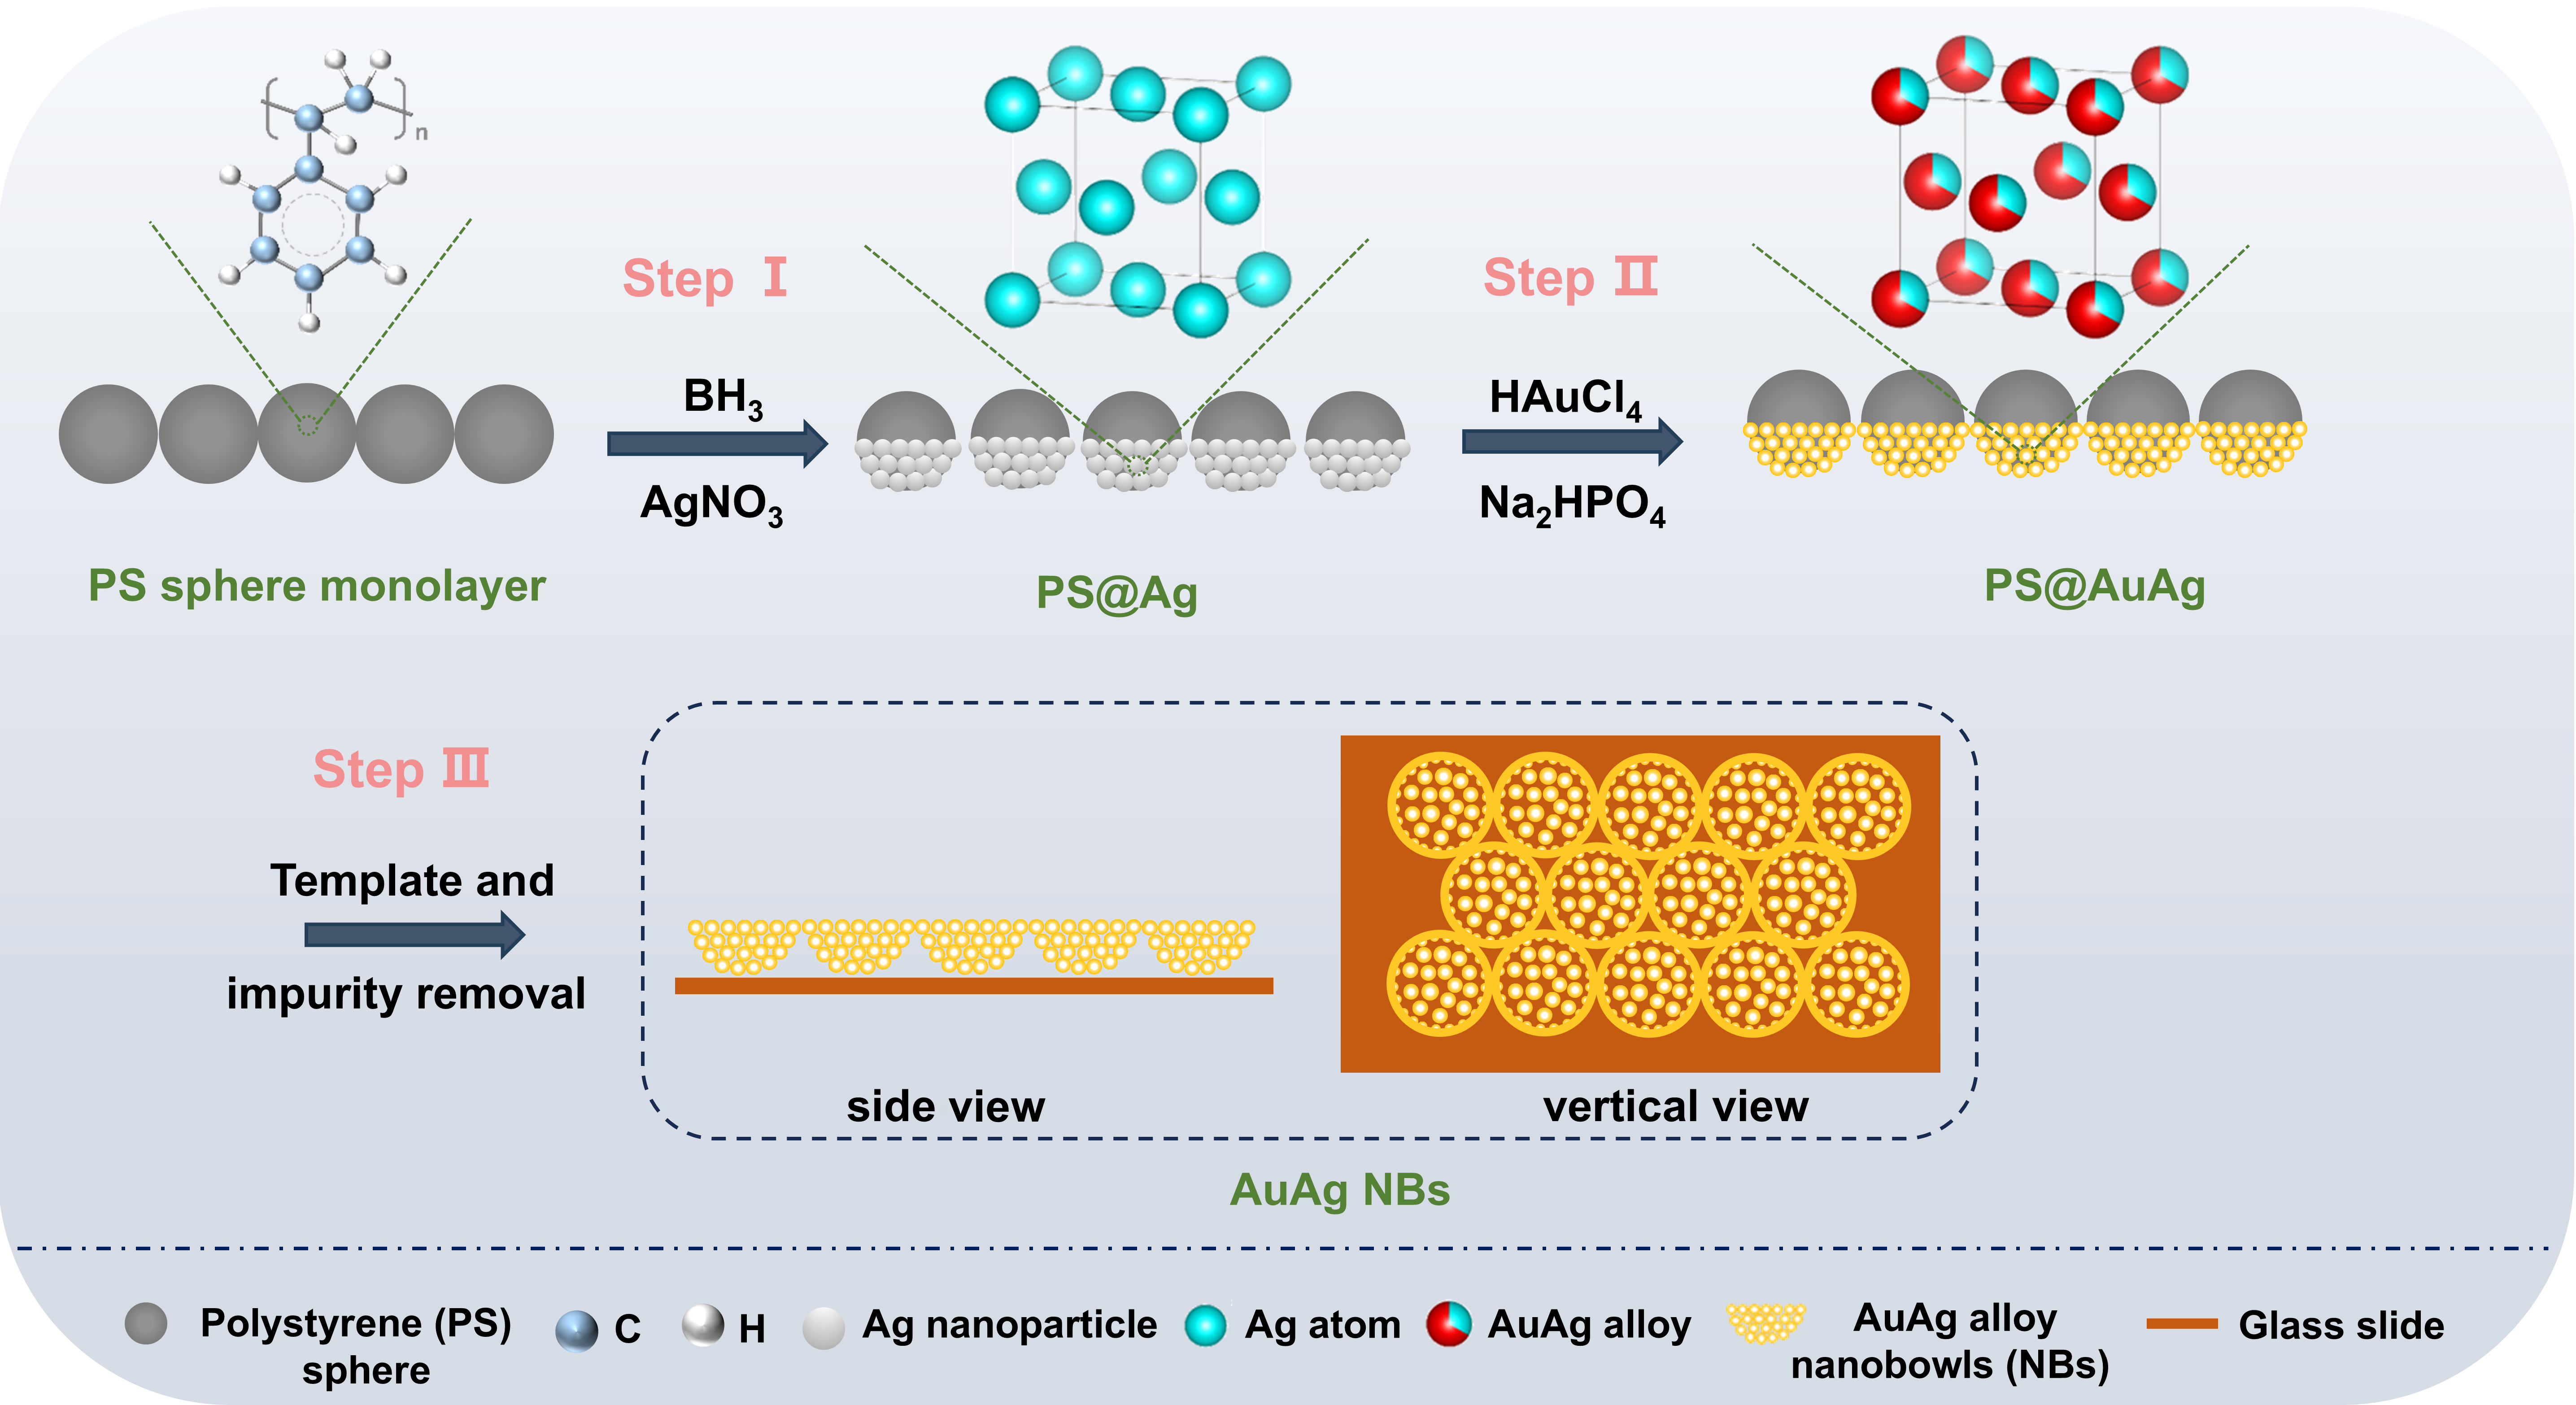
Figure 1. Schematic illustration of the fabrication process of AuAg NBs.
Figure 2A shows an SEM image of a self-assembled PS-sphere monolayer, with the spheres measuring approximately 300 nm in diameter. Figure 2B shows the PS@Ag film, which has a large-area, long-range-ordered honeycomb structure. The Ag particles (approximately 5 nm) are densely arranged, providing a suitable template for the subsequent galvanic replacement of Ag at the original sites. Figure 2C shows the morphological characterization of the AuAg NBs, presenting an ordered periodic arrangement with large nanobowls as the repeating units. Particle size distribution analysis shows an average large-nanobowl diameter of 303 nm and a uniform size distribution. The base of each large nanobowl consists of loosely arranged small particles that form a hollow bowl-like structure. We refer to these structures as small nanobowls. Therefore, AuAg NBs exhibit a hierarchical structure where small nanobowls are nested within large nanobowls. Figure 2D indicates that the content of Au is significantly higher than that of Ag, which is consistent with the energy-dispersive X-ray spectroscopy (EDS) results [Supplementary Figure 1]. As shown in Figure 2E, an EDS linear scan on a single small AuAg nanobowl showed similar periodic variations in the Au and Ag signals. The peaks and valleys indicate the hollow structure of a single small nanobowl. Judging from the intensity, the peak of Au is stronger than that of Ag, indicating a relatively higher content. Figure 2F presents an EDS line scan across three adjacent large nanobowls, and it is found that the curves of Au and Ag elements show periodic variations similar to those of the small nanobowls. These results indicate that Au and Ag are spatially co-distributed throughout both the small and large nanobowl structures at the spatial resolution of EDS, supporting the formation of the hierarchical bimetallic nanobowl architecture. It should be noted, however, that EDS provides information on elemental distribution but cannot alone confirm atomic-scale alloy formation. Therefore, the formation of the AuAg alloy is further corroborated below by complementary characterization techniques.
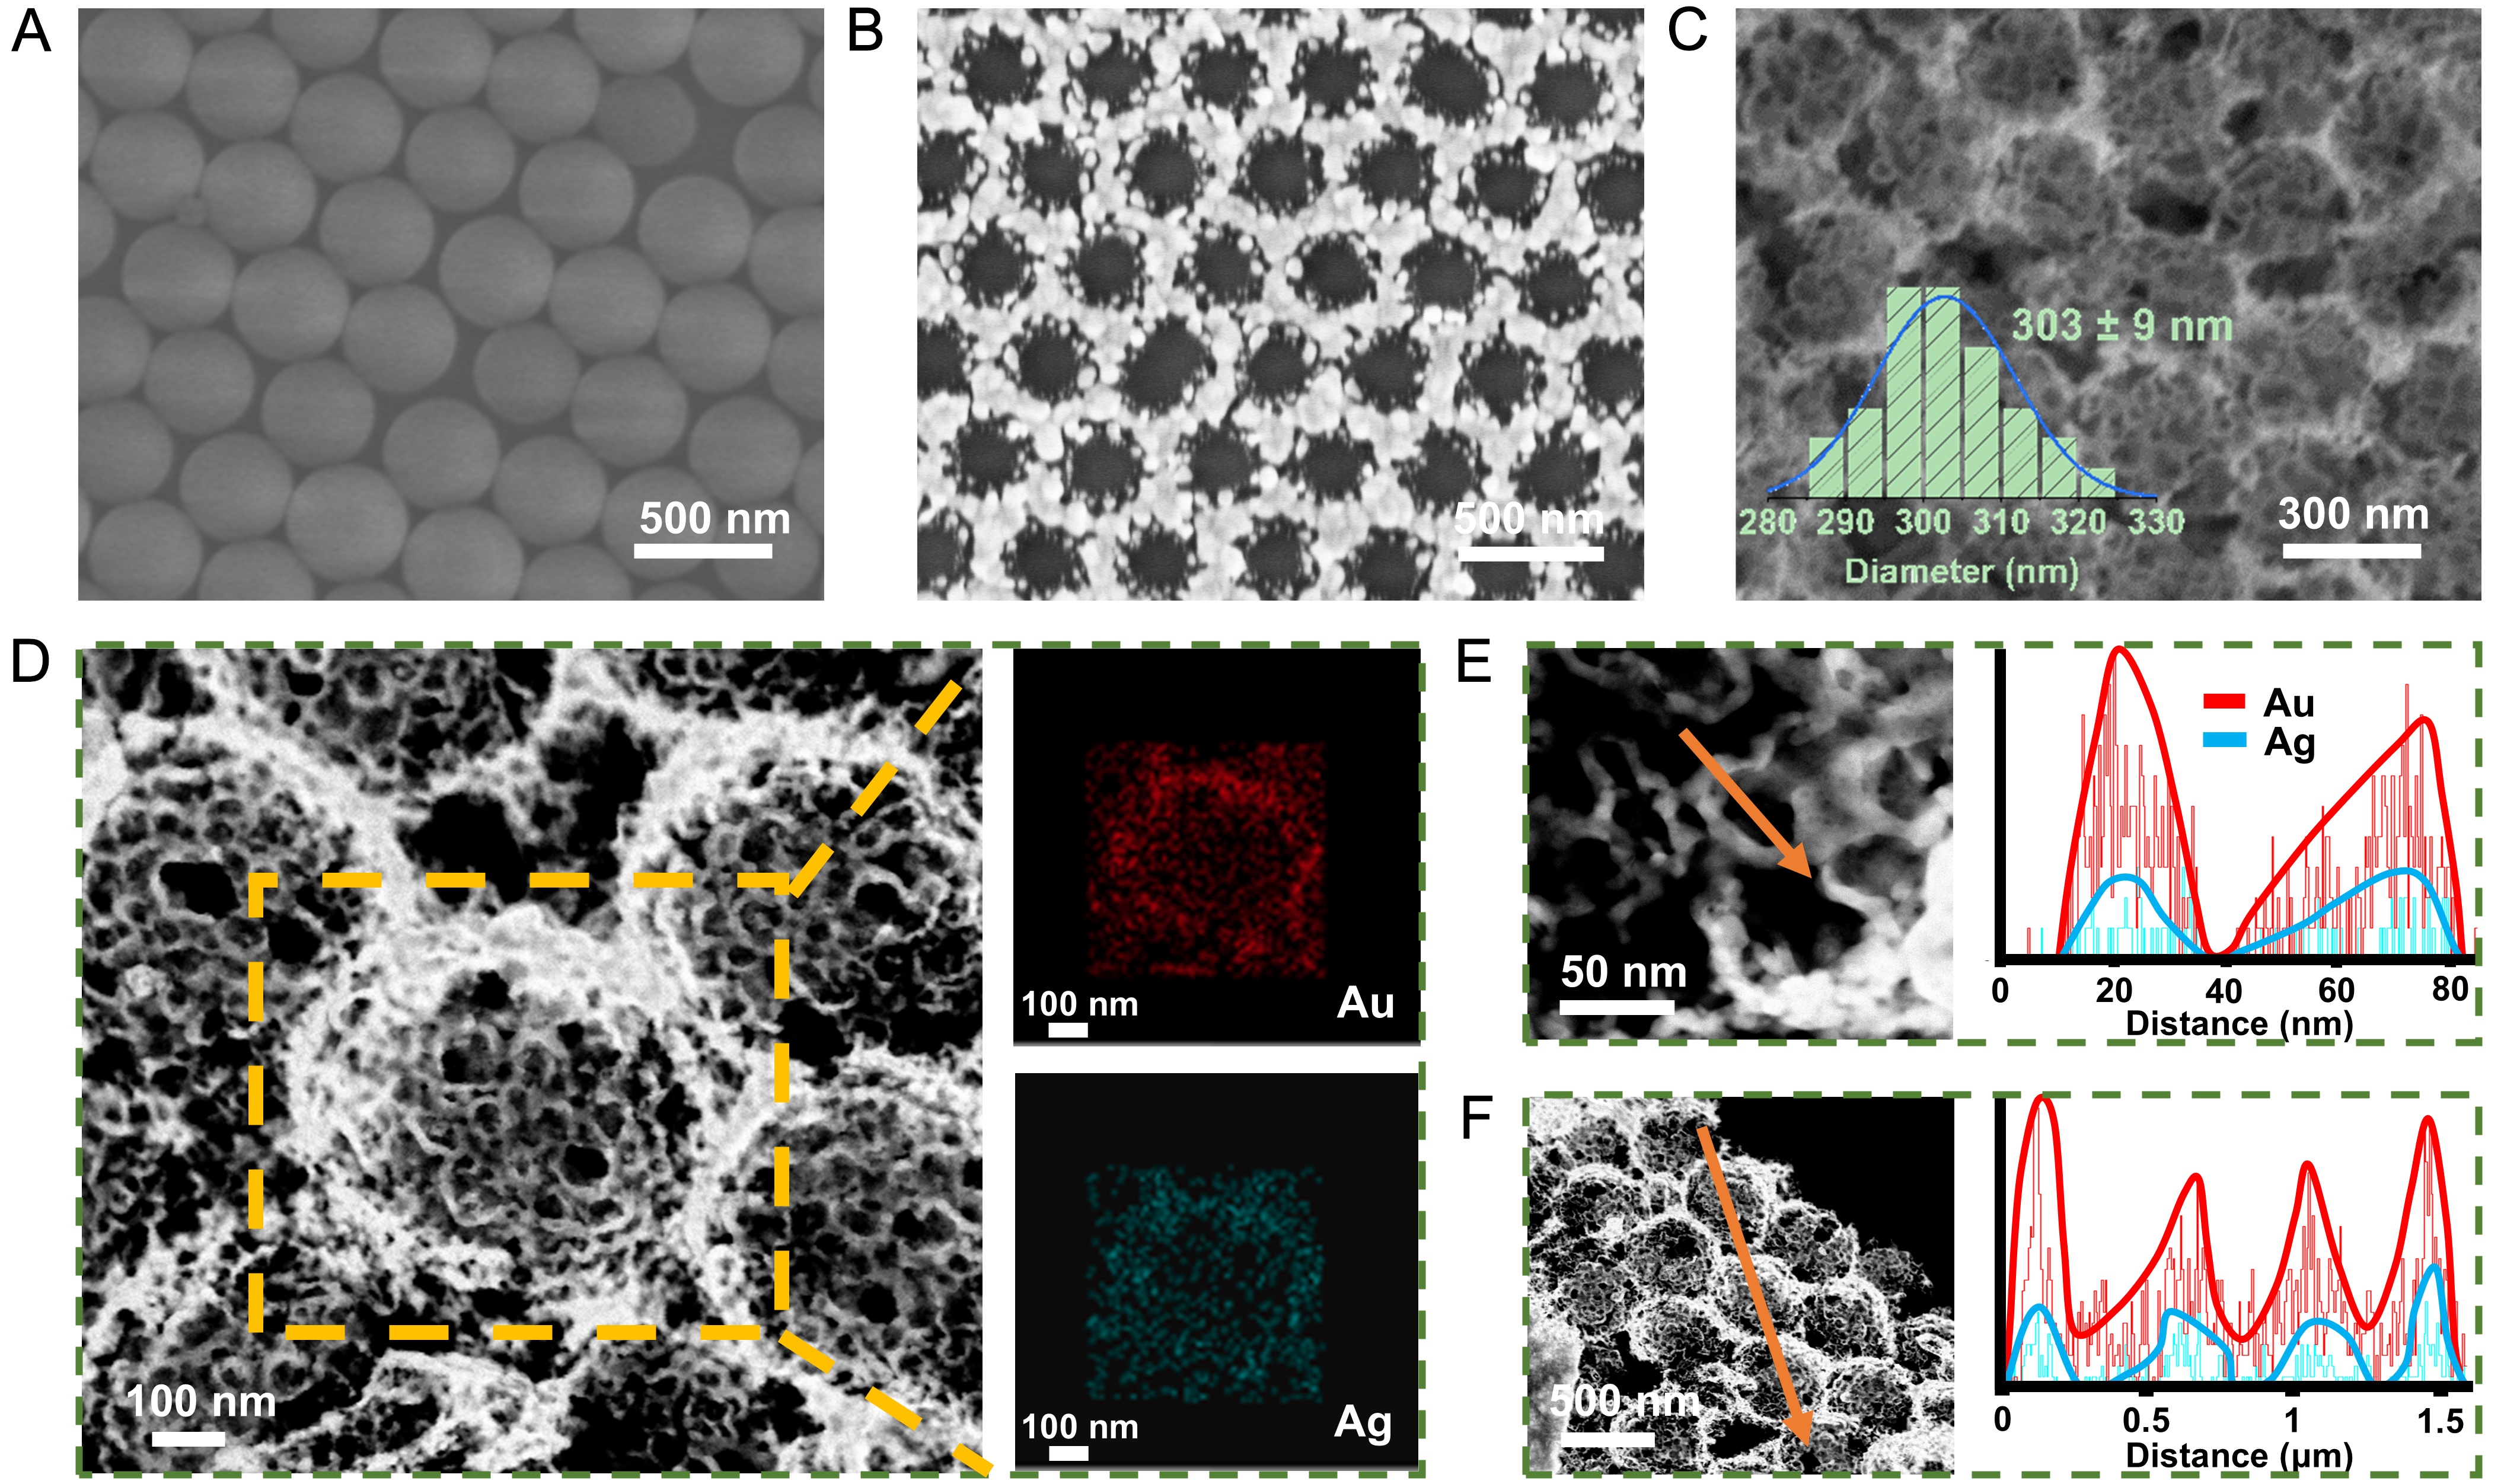
Figure 2. SEM images of (A) PS sphere monolayer, (B) PS@Ag film and (C) AuAg NBs; The inset in panel (C) shows the particle size distribution histogram of large nanobowls (n = 50); (D) Elemental analysis of AuAg NBs; EDS line scans of a single small AuAg nanobowl (E) and three large AuAg NBs (F). SEM: Scanning electron microscopy; PS: polystyrene; AuAg NBs: AuAg alloy nanobowls; EDS: energy-dispersive X-ray spectroscopy.
In the experiments shown in Supplementary Figure 2, the HAuCl4 concentration was maintained at 3 mM while the Na2HPO4 concentration was varied to observe its effect on the morphology of the product. Supplementary Figure 2A and B show SEM images of AuAg NBs at different magnifications when the concentration of Na2HPO4 is 10 mM. The small nanobowls are randomly arranged on the substrate without forming large nanobowl structures. When the concentration of Na2HPO4 is 50 mM, Supplementary Figure 2C reveals that the overall AuAg NBs are more ordered than those prepared at 10 mM Na2HPO4, and Supplementary Figure 2D displays the presence of large nanobowl contours, but the bowl walls are damaged. At 75 mM Na2HPO4, Supplementary Figure 2E shows an overall ordered arrangement, and Supplementary Figure 2F shows a few defects in the large nanobowl contours, but the bowl walls are intact. When the concentration of Na2HPO4 is 150 mM, Supplementary Figure 2G presents a large area of ordered arrangement structure, and in Supplementary Figure 2H, the edges of the large nanobowls are clearly visible. This indicates that the concentration of Na2HPO4 plays an important role in the preparation of the ordered arrangement structure of AuAg NBs. In the experiments shown in Supplementary Figure 3, the HAuCl4 concentration was reduced to 0.3 mM to decrease the rate of the substitution reaction. By changing the concentration of Na2HPO4, the regulatory effect on the product structure can be more clearly revealed. At a low HAuCl4 concentration, Na2HPO4 concentrations of 1 mM, 2.5 mM, 5 mM, and 7.5 mM each produced periodically arranged AuAg NBs, but the structures at the bases of the large nanobowls differed markedly. Supplementary Figure 3A shows that the contours of the small nanobowls at the base of the bowl are indistinct; only the overall large-nanobowl structure can be observed. Supplementary Figure 3B shows the initial appearance of the small-nanobowl contours, Supplementary Figure 3C shows clear small-nanobowl contours, and Supplementary Figure 3D shows distinct small-nanobowl contours at the bottom with large gaps between them.
Na2HPO4 regulates the hierarchical morphology of AuAg NBs mainly by increasing the solution pH and modulating the replacement kinetics [Supplementary Table 1 and Supplementary Figure 4]. Both excessively slow and rapid reactions were unfavorable for the formation of the ordered hierarchical structure, while the NaOH control confirmed that the effect of Na2HPO4 was mainly related to pH regulation. Based on these observations, 3 mM HAuCl4 and 150 mM Na2HPO4 at room temperature were selected as the optimized reaction conditions for the subsequent experiments.
Supplementary Figure 5 shows TEM images of AuAg NBs at different magnifications. Supplementary Figure 5A and B reveal that the large nanobowls are closely connected over a large area. Supplementary Figure 5C shows that the bottom of each large nanobowl is composed of interconnected small nanobowls. Figure 3A shows that the small nanobowls are approximately 30 nm in diameter. The contrast between the outer contour and the interior is consistent with a hollow structure of the small nanobowl. In the EDS elemental analysis of Supplementary Figure 1, the atomic percentage of Ag is 37.2%. According to Vegard’s law:
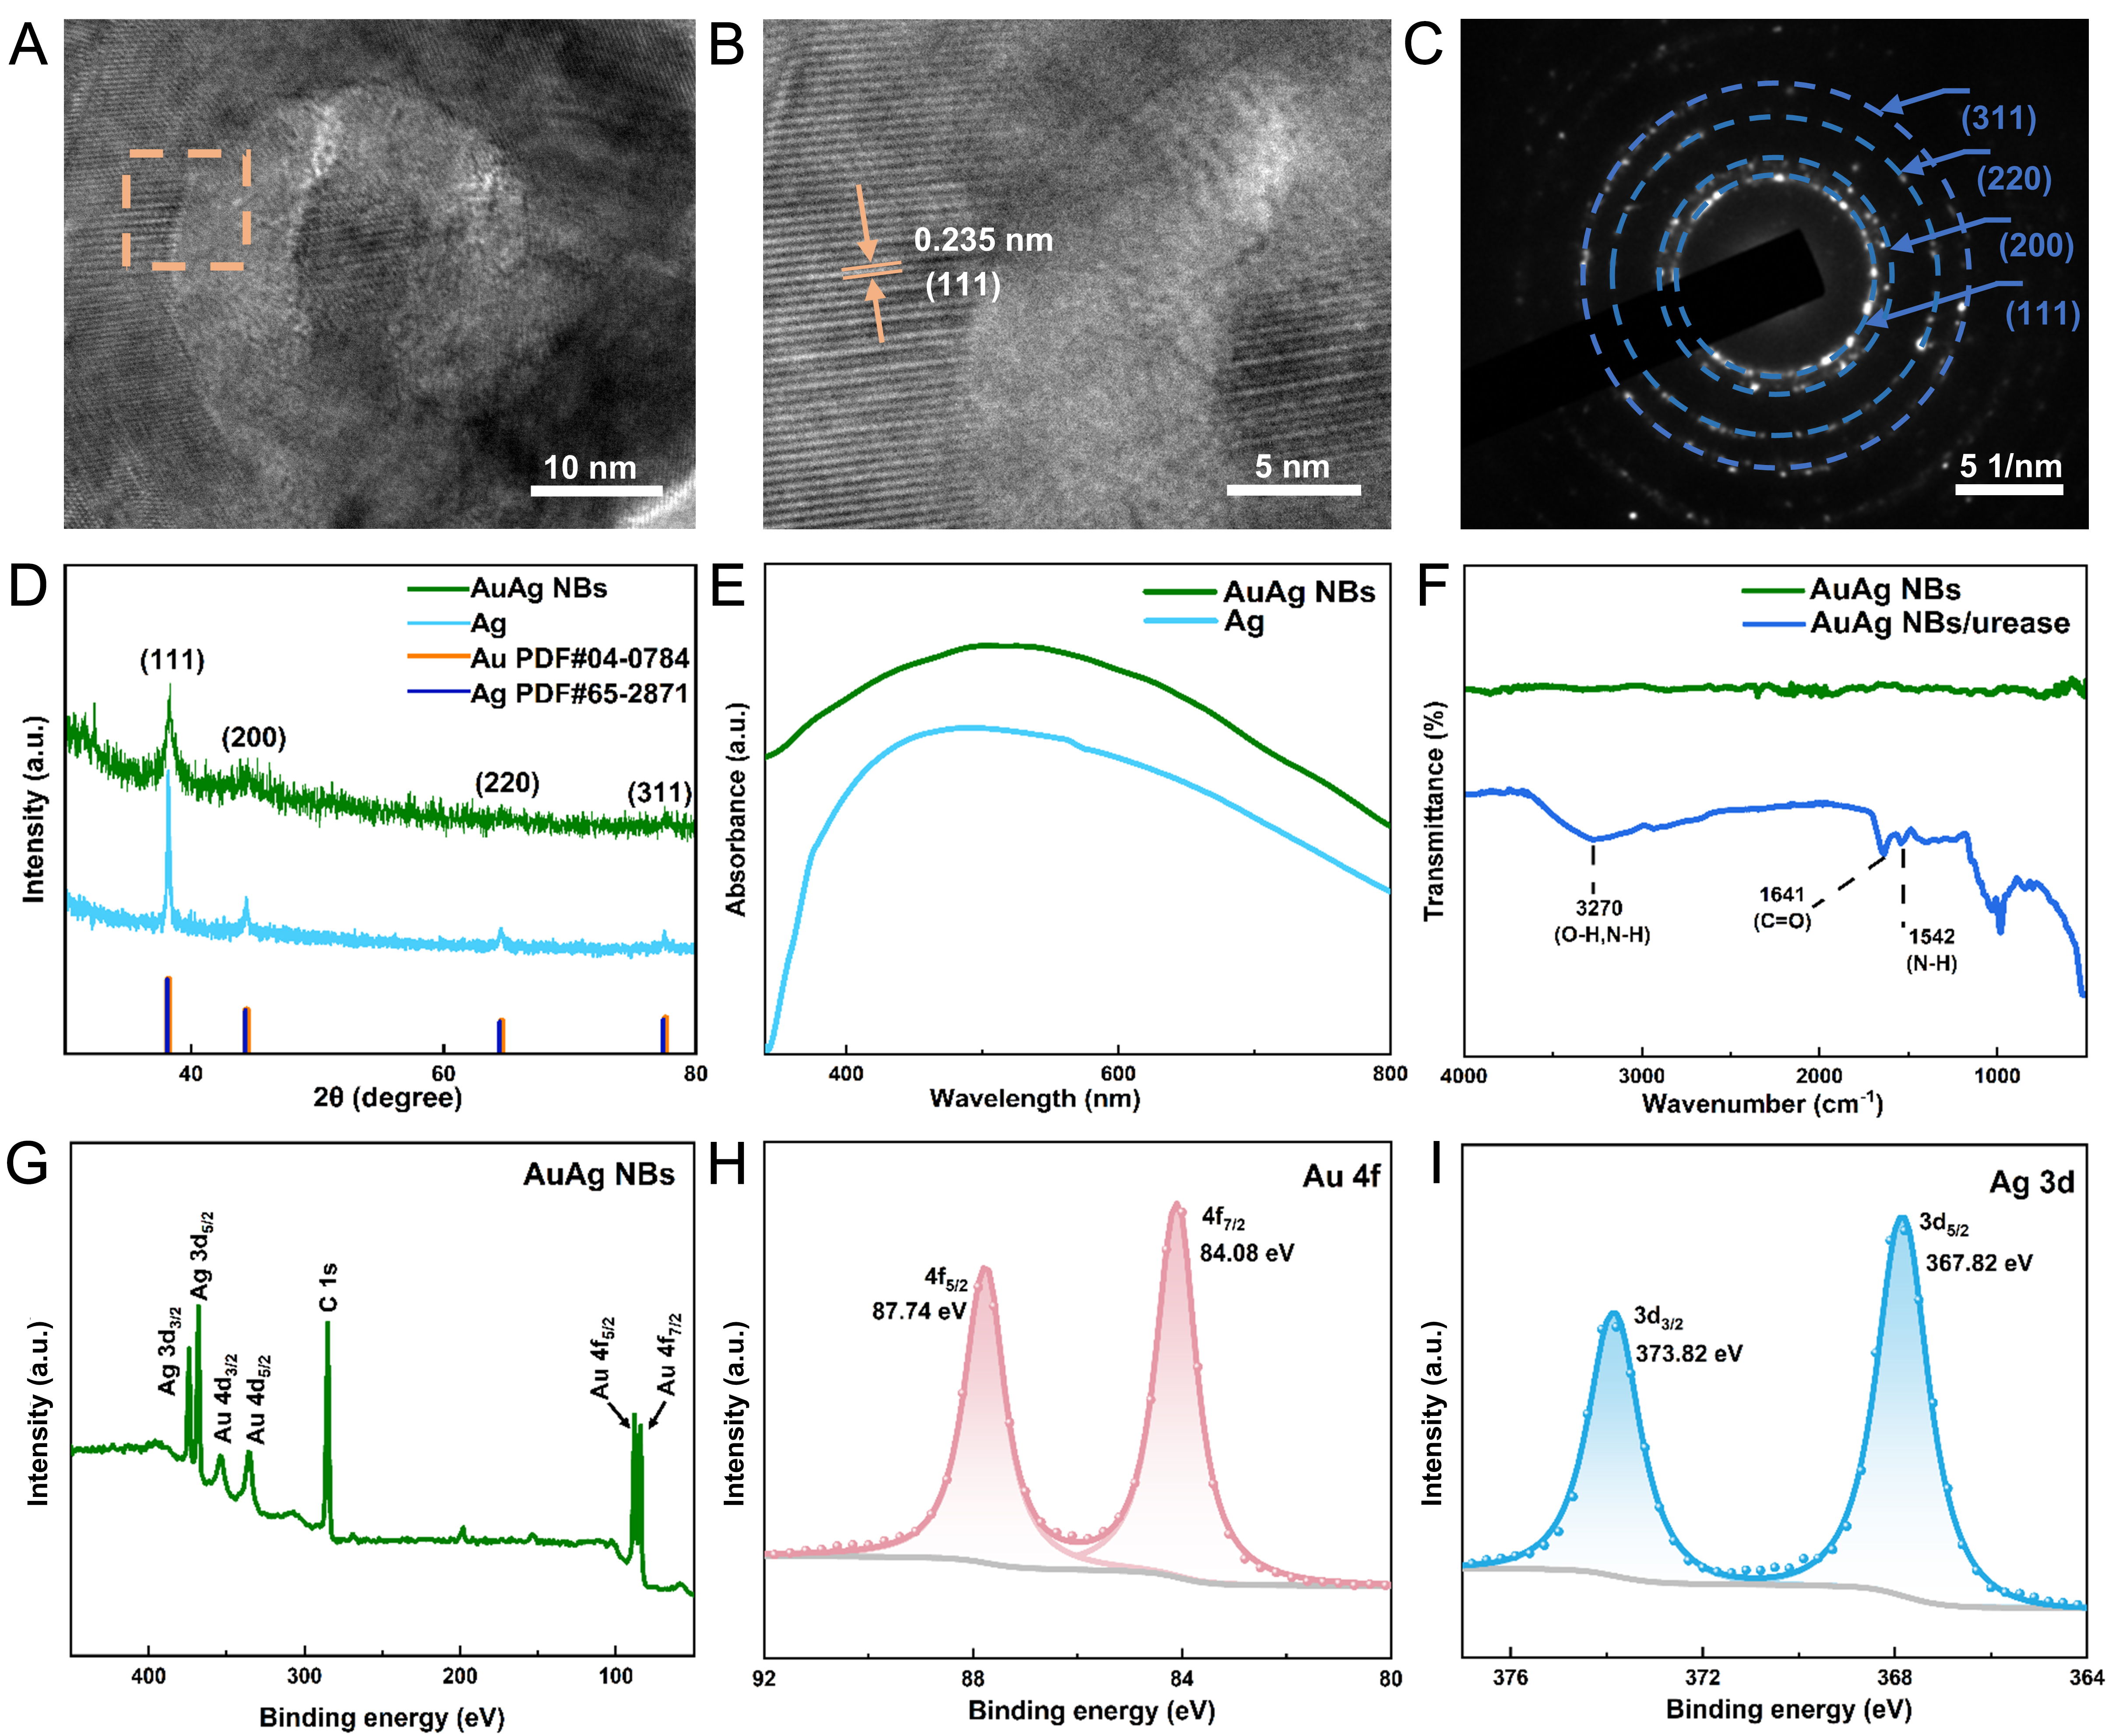
Figure 3. (A) TEM image of a small AuAg nanobowl, (B) crystal lattice spacing within the dashed box of panel (A), (C) SAED pattern; (D) XRD patterns, (E) UV-vis spectra of AuAg NBs and Ag; (F) FTIR spectra of AuAg NBs and AuAg NBs/urease; (G-I) XPS spectra of AuAg NBs. TEM: Transmission electron microscopy; SAED: selected area electron diffraction; XRD: X-ray diffraction; FTIR: Fourier-transform infrared; UV-vis: ultraviolet-visible; AuAg NBs: AuAg alloy nanobowls; XPS: X-ray photoelectron spectroscopy.
where n denotes the Ag atomic fraction in the alloy, and aAu and aAg refer to the lattice spacings of the pure Au (111) and Ag (111) planes, respectively[26]. We can estimate the lattice spacing of the small AuAg nanobowl to be 0.235 nm. Figure 3B shows a high-resolution transmission electron microscope image of the dashed-box region in Figure 3A, where the lattice spacing is 0.235 nm, and the measurement results are consistent with Vegard’s law. Figure 3C shows multiple concentric diffraction rings corresponding to the (111), (200), (220), and (311) planes of the AuAg NBs. The XRD pattern of AuAg NBs is consistent with a face-centered cubic (fcc) crystal structure [Figure 3D], which is consistent with the selected area electron diffraction (SAED) results. This set of XRD peaks is consistent with the formation of a single-phase AuAg alloy. Compared with the Ag film, AuAg NBs show broader diffraction peaks. On the one hand, this is because the AuAg alloy nanobowls are composed of two substances with similar crystal structures, which broadens the diffraction peaks of the alloy. On the other hand, the small particle size of AuAg NBs also leads to peak broadening[27].
Figure 3E shows the UV-vis spectra of the Ag film and the AuAg NBs. Both samples show broad absorption peaks, resulting from intense plasmon resonance in the aggregated nanoparticles. The AuAg alloy has only one strong absorption peak. Different ratios of Au and Ag will cause changes in the position of the absorption peak[28]. The AuAg NBs have a higher Au content than Ag content; therefore, the absorption peak is around 500 nm. Figure 3F shows the FTIR spectra of AuAg NBs and AuAg NBs/urease. The AuAg NBs do not have a distinct absorption peak. The AuAg NBs/urease sample shows a strong, broad absorption band at 3,270 cm-1, indicating the presence of O-H and NH2 groups in the urease. The peak at 1,641 cm-1 is attributed to the stretching vibration of C=O. The spectral band at 1,542 cm-1 indicates the bending vibration of the N-H group. These results indicate that urease was successfully immobilized on the surface of the AuAg NBs.
Figure 3G shows the XPS survey spectrum of AuAg NBs. Figure 3H and I indicate that the main elemental components of the AuAg NBs are Ag and Au. After the formation of the AuAg alloy, both Ag 3d peaks shift toward lower binding energies [Supplementary Figure 6], whereas the Au 4f7/2 peak shifts to a higher binding energy relative to pure Au (83.96 eV)[29]. This phenomenon arises from the charge compensation mechanism associated with d-electron transfer from Au to Ag in the AuAg alloy, further supporting the formation of the AuAg alloy[30,31].
Based on the combined evidence, the homogeneous spatial distribution of Au and Ag revealed by EDS, the single set of fcc diffraction features, the lattice spacing consistent with the expected AuAg solid solution observed by high-resolution transmission electron microscopy (HRTEM), and the opposite binding-energy shifts of Au 4f and Ag 3d in XPS collectively support alloy formation rather than a phase-separated physical mixture of Au and Ag.
Urea detection mechanism and screen-printed electrode application
Figure 4A illustrates the mechanism for detecting urea using AuAg NBs. Urease is immobilized on the AuAg NBs and catalyzes urea hydrolysis into NH4+, HCO3-, and OH-, thereby changing the OCP. Supplementary Figure 7 shows that urease is mainly distributed on the outer surface and inside the large AuAg nanobowls, and is also observed on the smaller nanobowls. This open structure facilitates urea transport in the electrolyte to the immobilized urease.
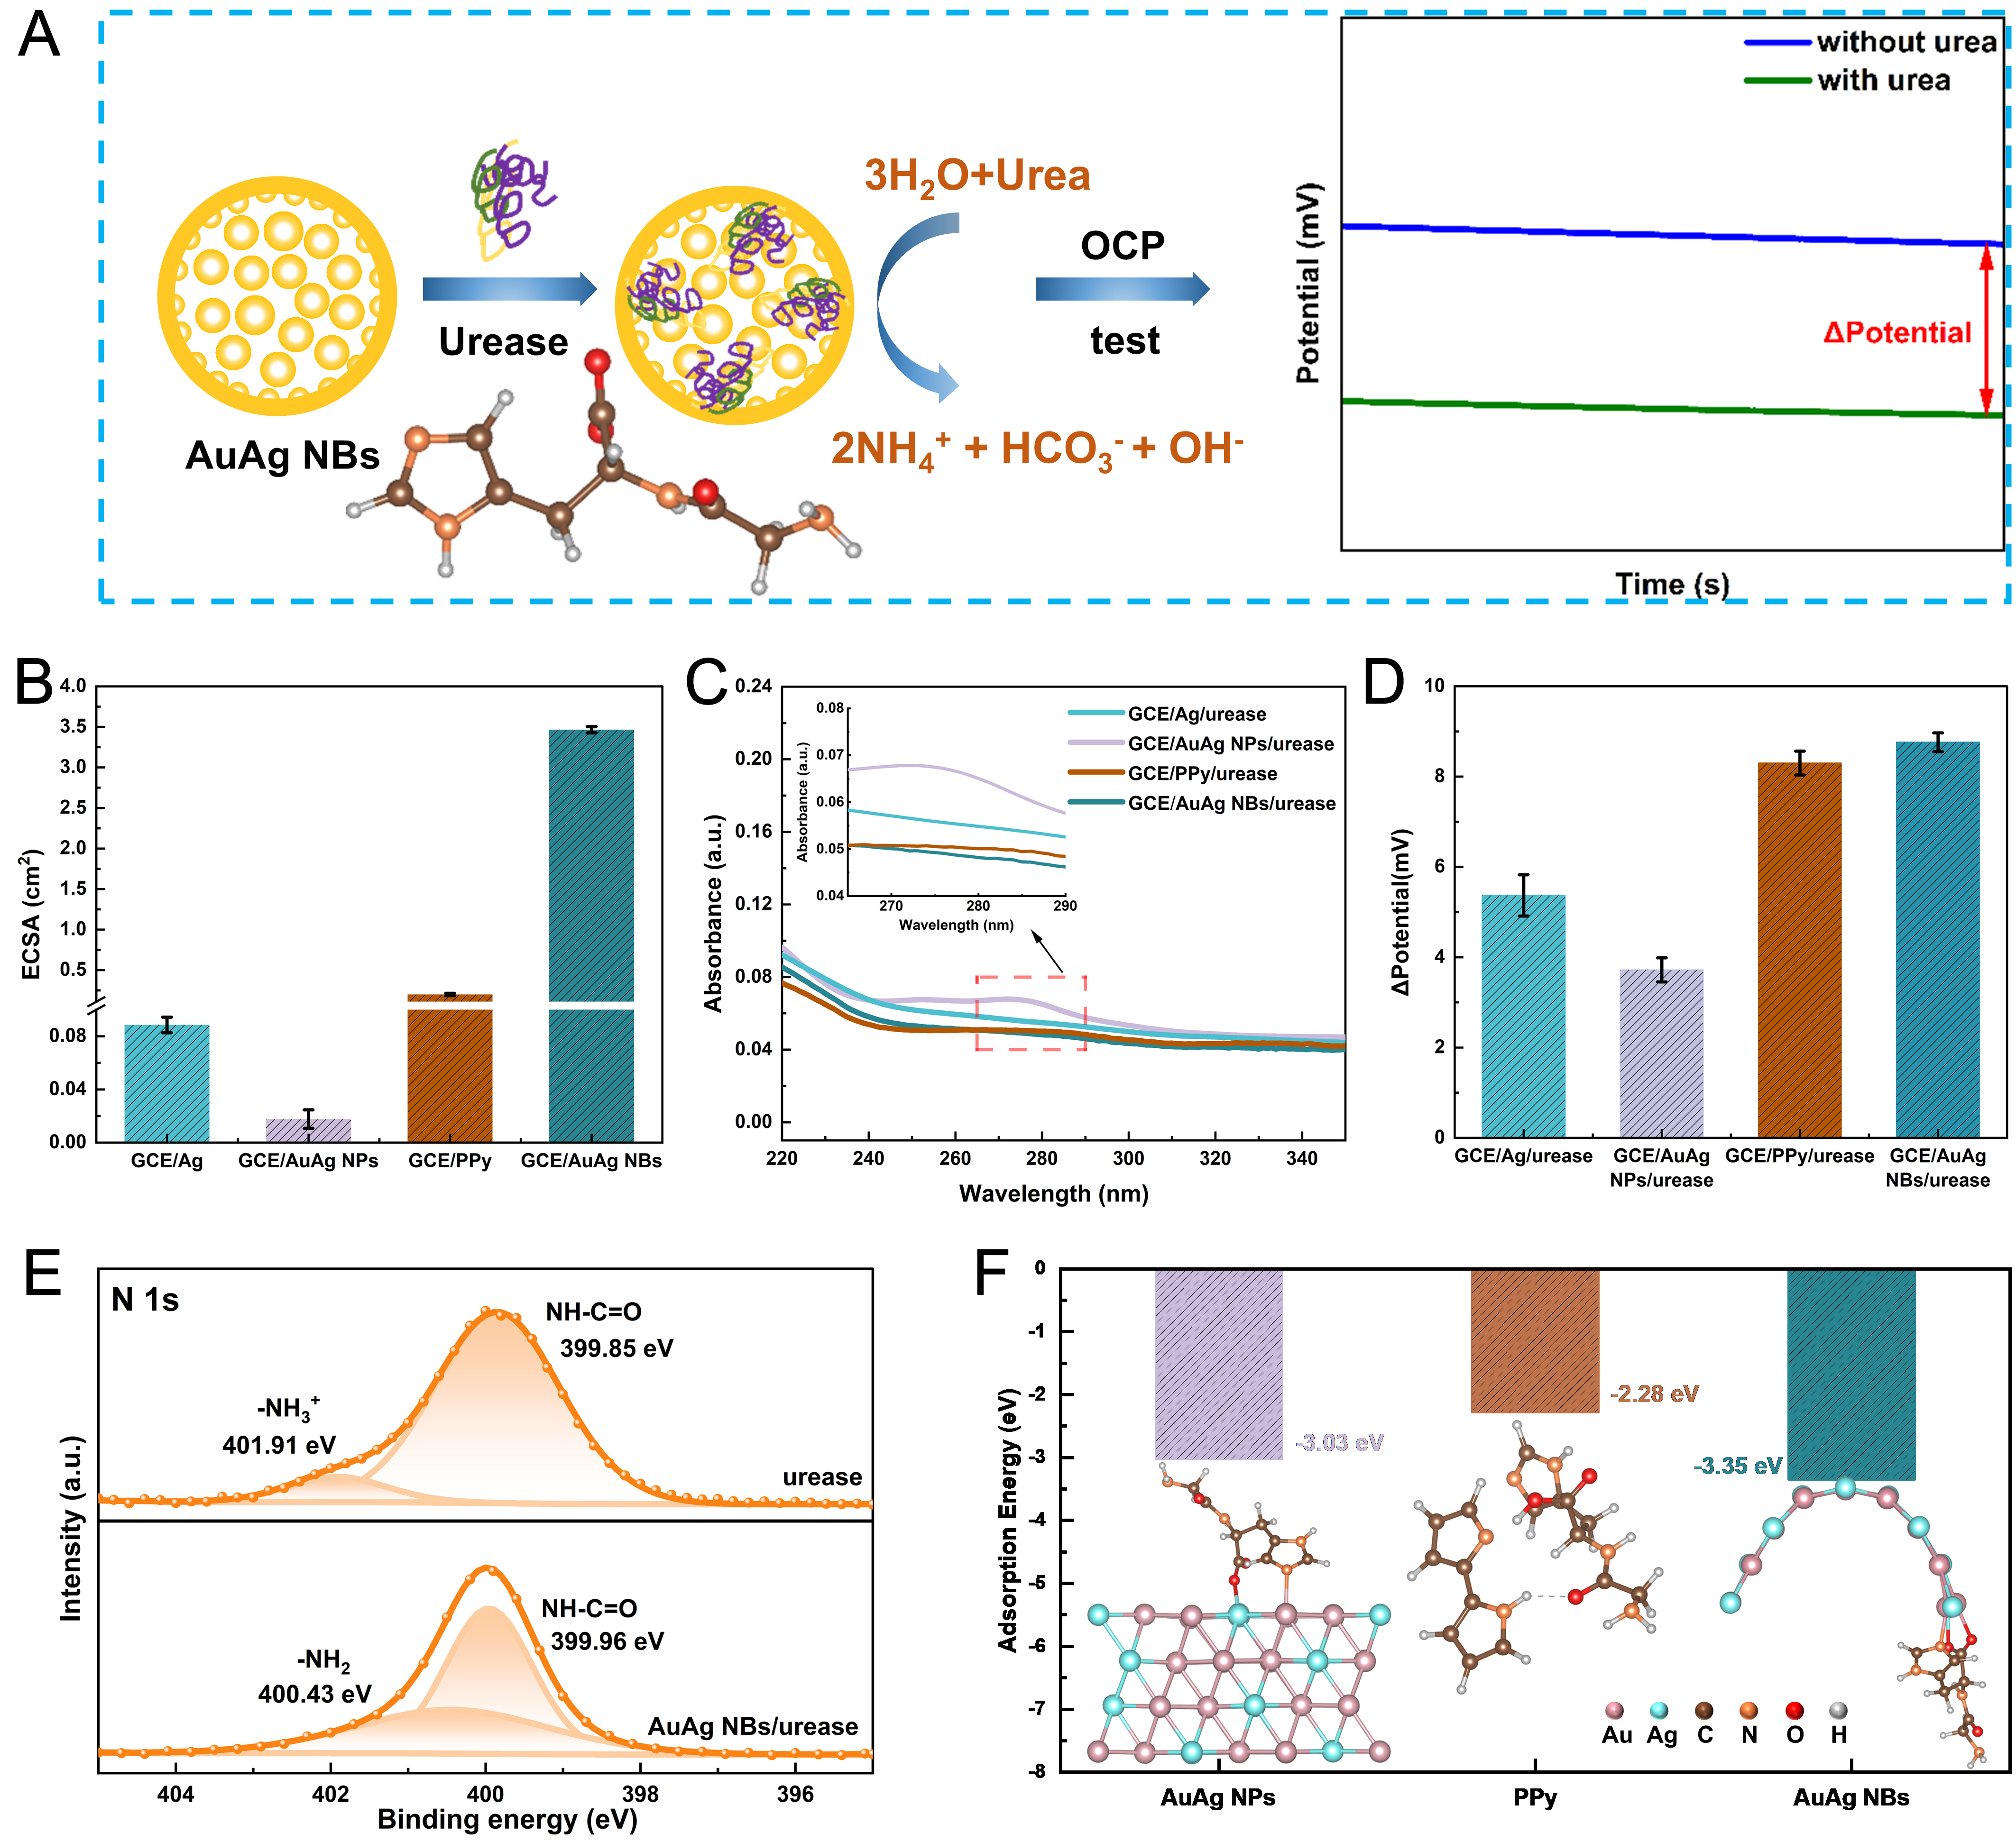
Figure 4. (A) Schematic illustration of the urea detection mechanism. The inset in panel (A) illustrates the structure of the Gly-His dipeptide; (B) ECSA values of different electrodes (SD of n = 3); (C) UV-vis spectra of eluents collected by rinsing enzyme-modified electrodes with 5 mL of PBS solution; (D) Potentiometric responses of different electrodes to 800 μM urea (SD of n = 3). (E) High-resolution N 1s spectra of urease and AuAg NBs/urease; (F) Comparison of adsorption energies of the Gly-His model on AuAg NPs, PPy, and AuAg NBs. AuAg NPs: AuAg alloy nanoparticles; PPy: polypyrrole; AuAg NBs: AuAg alloy nanobowls; UV-vis: ultraviolet-visible; ECSA: electrochemically active surface area; PBS: phosphate buffer solution; GCE: glassy carbon electrodes; OCP: open-circuit potential; SD: standard deviation.
The potential response is affected by factors such as enzyme concentration, pH, and electrode type[13,32]. In Supplementary Figure 8A, the redox peak potentials of [Fe(CN)6]3-/4- are around 0.29 V and 0.16 V. Following urease immobilization, the peak current decreases, owing to the electron-insulating biomacromolecular layer that obstructs interfacial charge transfer. Consequently, the charge transfer resistance (Rct) value experiences a pronounced increase to 1,155 Ω [Supplementary Figure 8B], which further indicates the successful fabrication of the GCE/AuAg NBs/urease electrode [Supplementary Table 2]. We investigated the effects of enzyme loading and PBS pH. As shown in Supplementary Figure 9A, the potential response of the GCE/AuAg NBs electrode significantly increases after loading 10 μL of urease. Further increasing the loading volume to 15 μL only yields a marginal improvement. Considering both sensing performance and cost efficiency, loading 10 μL of urease is optimal. Supplementary Figure 9B indicates that the potential response is the greatest at pH 7.4. Either excessively acidic or alkaline conditions will decrease enzyme activity, resulting in a reduction in the potential change. In conclusion, the optimal test conditions for the GCE/AuAg NBs/urease electrode are a urease loading of 10 μL and a PBS pH value of 7.4, and subsequent tests were conducted under these conditions. The GCE/AuAg NBs electrode without urease showed only a negligible ~1 mV response to 800 μM urea [Supplementary Figure 10], indicating that AuAg NBs themselves do not catalyze urea hydrolysis to generate a potentiometric response.
AuAg NPs were synthesized by the NaBH4 reduction method[21], with an average particle size of ~30 nm [Supplementary Figure 11]. They exhibited optical properties similar to those of AuAg NBs [Supplementary Figure 12]. To evaluate the enzyme-immobilization performance of the AuAg NBs, we also modified the GCE with a PPy layer for comparison[33]. Supplementary Figure 13 shows the CV curves of different electrodes measured for electrochemically active surface area (ECSA) evaluation in the non-Faradaic region. The calculation method of ECSA is as follows:
where the double-layer capacitance (Cdl) is defined as the ratio of the capacitive current ΔI to the scan rate, namely the slope of the straight line in Supplementary Figure 14. Cs represents the specific areal capacitance of the sample catalyst. Figure 4B compares the ECSA values of GCE/Ag, GCE/AuAg NPs, GCE/PPy and GCE/AuAg NBs. The larger ECSA of AuAg NBs indicates a greater electrochemically accessible surface area, which may increase the amount of immobilized urease and contribute to the enhanced potentiometric response. Figure 4C compares the UV-vis absorption spectra of rinsing solutions collected from different electrodes after washing. Urease exhibits a characteristic absorption peak at approximately 278.5 nm, with its absorbance being directly proportional to the concentration[34]. Therefore, a lower absorbance signifies a lower urease content in the rinsing solution. The GCE/AuAg NBs/urease electrode exhibits the lowest absorbance, demonstrating its outstanding enzyme immobilization efficiency. Figure 4D compares the responses of different electrodes to 800 μM urea. The GCE/AuAg NBs/urease electrode delivers the most significant potential change, with its potential response enhanced by 135.5% compared with the GCE/AuAg NPs/urease electrode.
Supplementary Figure 15 shows the XPS survey spectra of urease and AuAg NBs/urease. As shown in Figure 4E, the high-resolution N 1s spectra of urease exhibited two characteristic peaks at approximately 399.85 eV and 401.91 eV, corresponding to amide nitrogen (NH-C=O) and protonated amino groups (-NH3+), respectively. After immobilization on the AuAg nanobowls, the amide nitrogen peak shifted to a higher binding energy of 399.96 eV, and a new -NH2 component emerged at 400.43 eV, indicating that the immobilization process altered the chemical environment of nitrogen atoms[35-37]. Meanwhile, compared with the pristine AuAg alloy, the Au 4f7/2 and 4f5/2 peaks in AuAg NBs/urease both shifted toward lower binding energy [Supplementary Figure 16]. These coordination interactions enable stable immobilization of urease on the AuAg alloy.
To further elucidate the adsorption behavior of urease on AuAg alloy nanobowls, DFT calculations were performed to evaluate the adsorption energies of a simplified Gly-His model on AuAg NPs, PPy, and AuAg NBs [Figure 4F]. A Gly-His dipeptide was employed as a simplified model to represent the local interaction of urease with different substrates[38]. The calculated adsorption energies indicate that the Gly-His model exhibits the most favorable adsorption tendency on
Notably, the DFT calculations predict stronger adsorption on AuAg NPs than on PPy, whereas PPy experimentally exhibits greater urease retention [Figure 4C] and a larger potential response [Figure 4D]. This discrepancy mainly arises from the simplified computational model and the difference between local adsorption and whole-enzyme immobilization. The two-monomer PPy model may underestimate the adsorption capability of the experimental three-dimensional PPy network[39]. In addition, urease immobilization is also influenced by interfacial accessibility, steric effects, surface morphology, and protein conformation and orientation. In this regard, the larger ECSA of PPy compared with that of AuAg NPs [Figure 4B] may provide more opportunities for urease immobilization.
Taken together, the hierarchical structure increases the electrochemically accessible surface area and facilitates urease loading, whereas the AuAg surface provides favorable interfacial interactions for urease immobilization. These coupled effects contribute to the enhanced potentiometric response of AuAg NBs.
Figure 5A shows the potential response of the GCE/AuAg NBs/urease electrode upon successive increases in urea concentration. Figure 5B indicates that the biosensor shows a clear linear response over 0.1-1 mM. The sensor exhibited a sensitivity of 10.6 mV·mM-1 and a LOD of 6.7 μM. To further extend the working range toward higher urea concentrations, the potentiometric response was additionally evaluated over the range of 1-6 mM [Supplementary Figure 17A]. A second linear response region was observed from 1 to 6 mM, with a sensitivity of 2.27 mV·mM-1 [Supplementary Figure 17B]. At 2 mM urea, the GCE/AuAg NBs/urease electrode exhibited a larger potential response than the GCE/Ag/urease and GCE/AuAg NPs/urease electrodes [Supplementary Figure 17C], further demonstrating the GCE/AuAg NBs/urease advantage at higher concentrations.
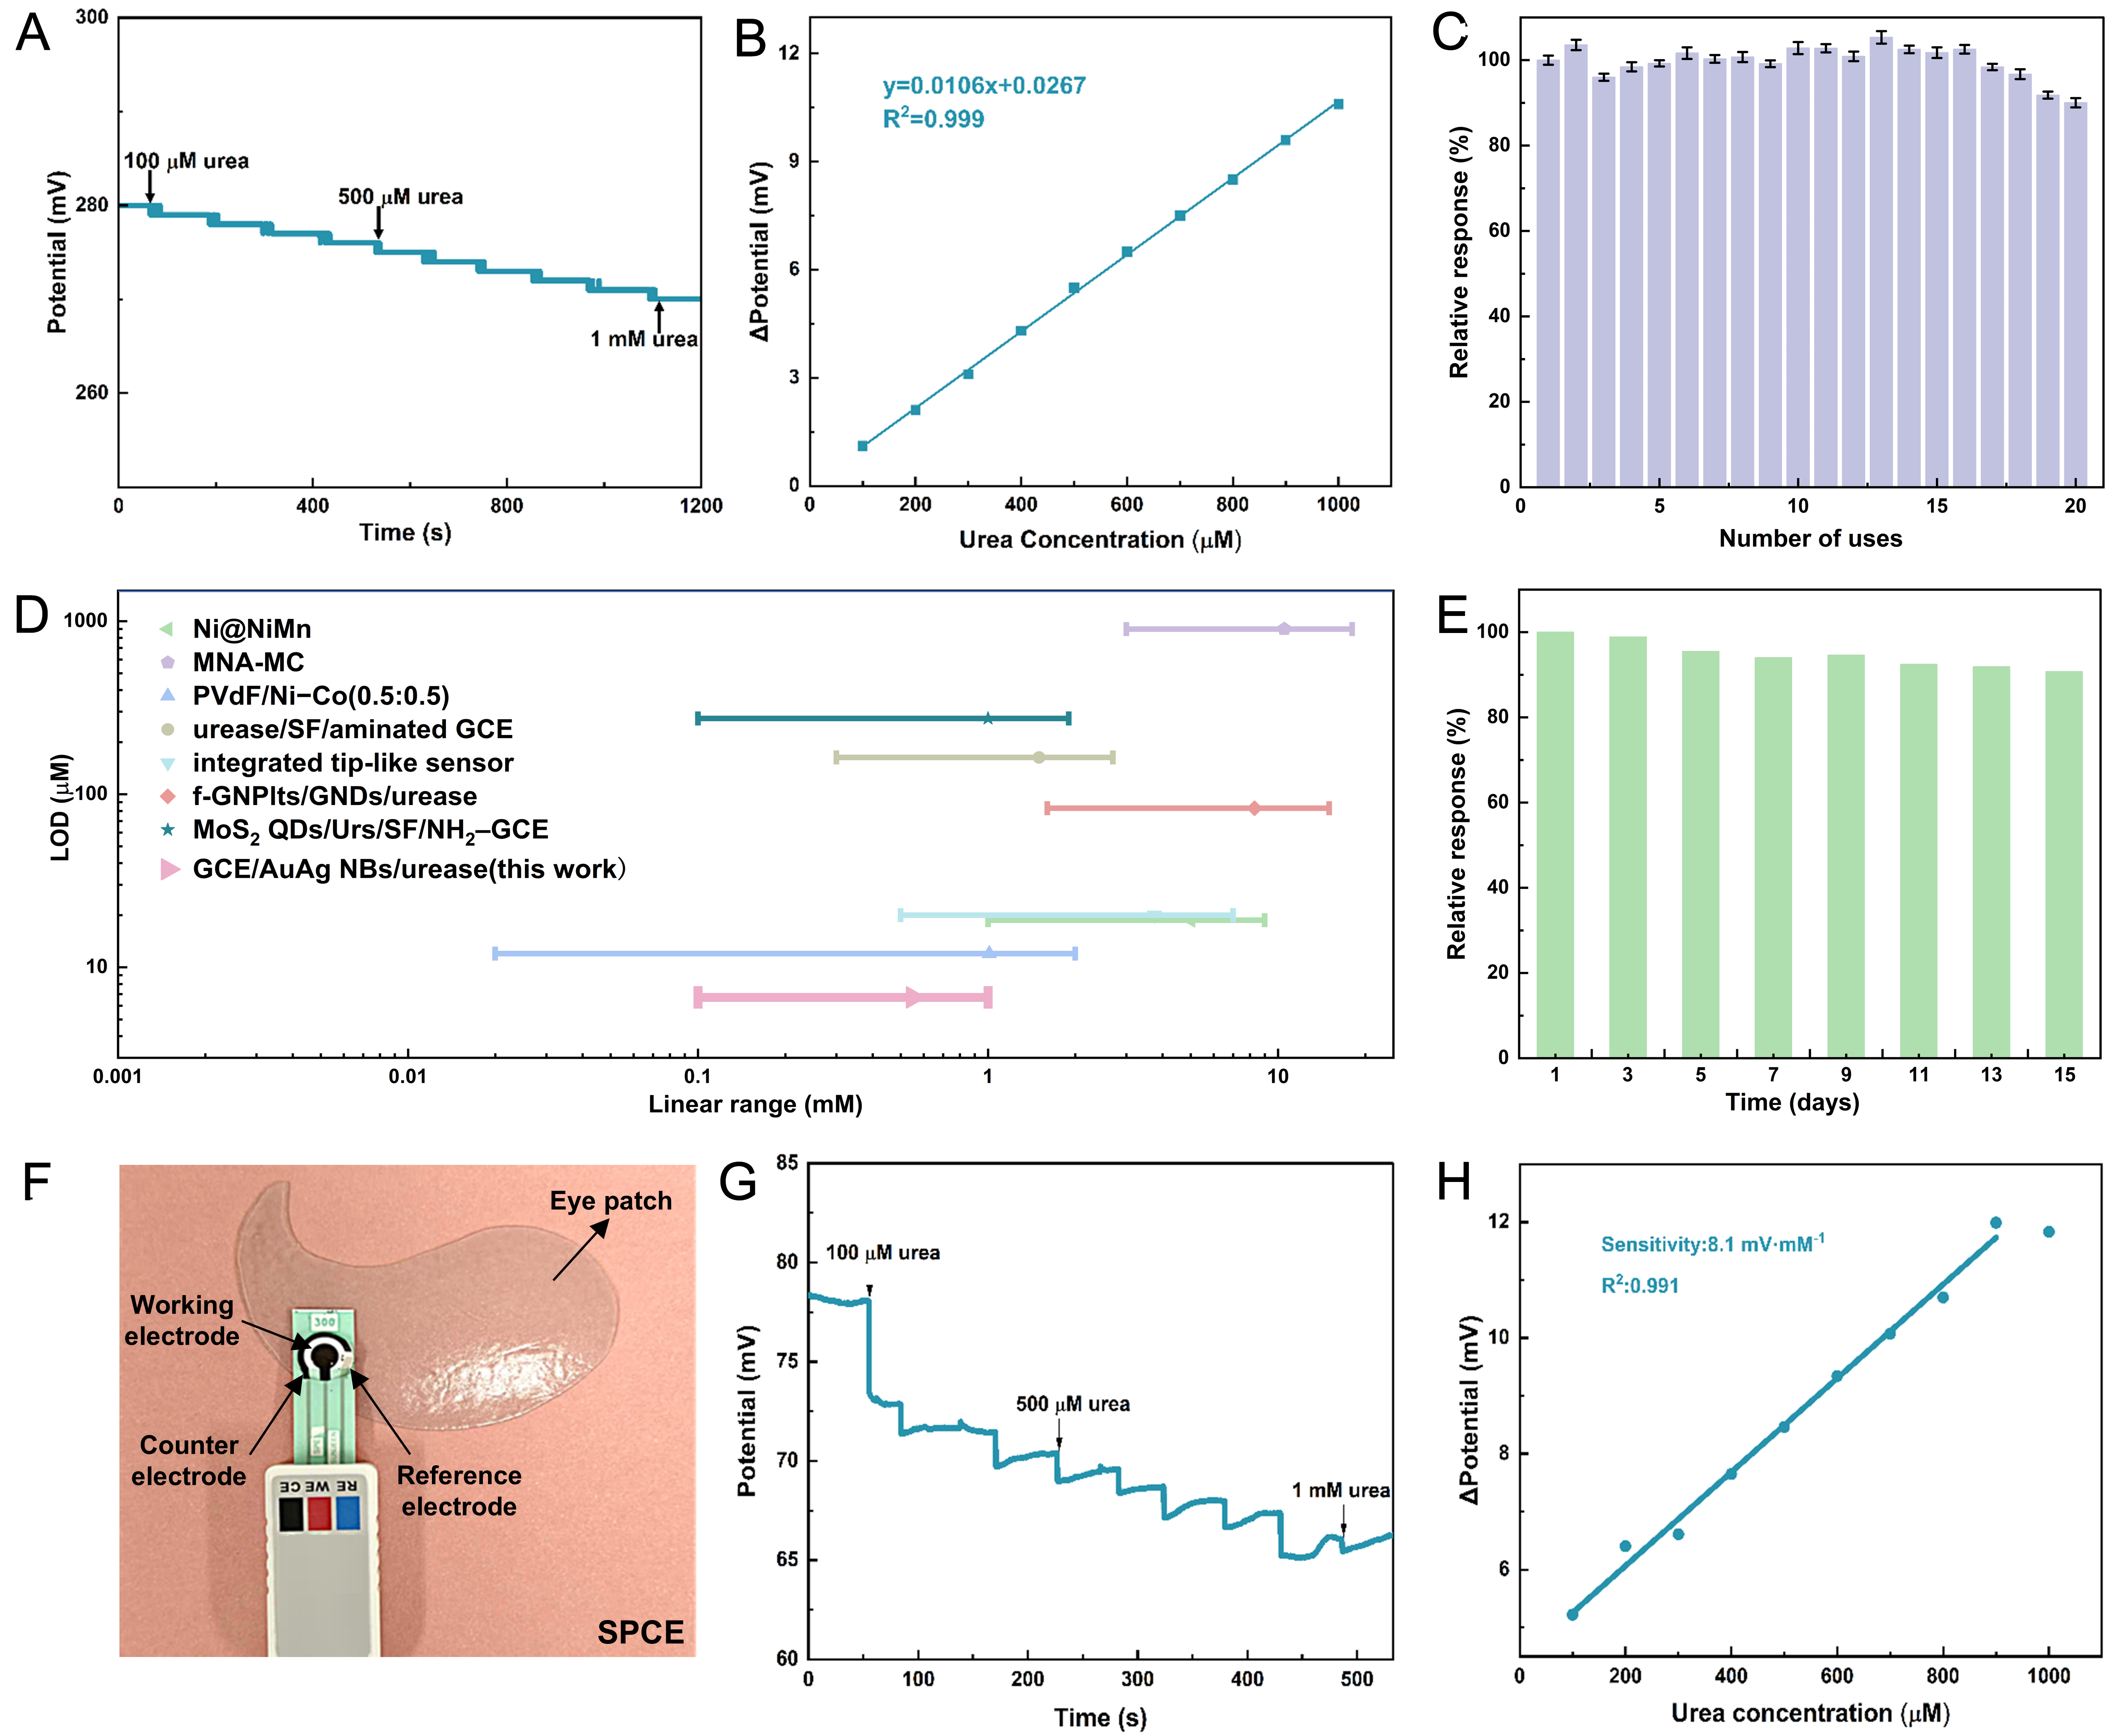
Figure 5. (A) Potentiometric response of the GCE/AuAg NBs/urease electrode with increasing urea concentration; (B) Calibration curve derived from panel (A); (C) Repeatability over 20 consecutive measurements (SD of n = 3); (D) Comparison of urea detection performance with previously reported sensing systems based on the present sensor’s low-concentration linear range of 0.1-1 mM; (E) Storage stability of the biosensor over 15 days; (F) Image of the SPCE integrated into an eye patch. The photograph was taken by the authors; (G) Potentiometric response of the SPCE to increasing urea concentration; (H) Calibration curve derived from panel (G). GCE: Glassy carbon electrodes; AuAg NBs: AuAg alloy nanobowls; SPCE: screen-printed carbon electrodes; MNA-MC: microneedle array-microcavities; PVdF: polyvinylidene fluoride; SF: silk fibroin; GNDs: graphitized nanodiamonds; f-GNPlts: functionalized graphene nanoplatelets; QDs: quantum dots; Urs: urease; SD: standard deviation.
The sensor response time was further evaluated using t90, defined as the time required to reach 90% of the steady-state potential response. The t90 values under different urease loadings, pH values, and measurement conditions are summarized in Supplementary Table 3. Under the optimized conditions of a 10 μL urease loading and pH 7.4, the GCE/AuAg NBs/urease electrode exhibited a t90 of approximately 207.5 s, which was further reduced to 136.0 s by stirring at 500 rpm due to enhanced mass transport.
To evaluate the repeatability of the electrode, 20 consecutive uses were performed. The relative standard deviation (RSD) was calculated according to the following equation:
where SD and mean represent the standard deviation and arithmetic mean, respectively, of the 20 mean response values. As shown in Figure 5C, the electrode exhibited good repeatability, with an RSD of 3.8%, and ~90% of the initial response was retained after the 20th measurement. Figure 5D compares the linear range and LOD of the proposed sensor with those of previously reported urea-sensing systems, showing that the present sensor has a comparatively low LOD. The storage stability was further evaluated over 15 days. After 15 days, the sensor response decreased by only 9.3% [Figure 5E]. Batch-to-batch reproducibility was assessed using three independently prepared GCE/AuAg NBs/urease electrodes at a fixed urea concentration of
The GCE/AuAg NBs/urease electrode was tested on artificial tears to verify its urea detection capability in complex matrices [Supplementary Figure 20A and B]. Artificial tears were diluted 1:40 with PBS solution. The potentiometric responses of diluted and undiluted artificial tear samples were compared
We integrated an SPCE into eye patches [Figure 5F], proposing a potential strategy for the application of AuAg NBs in DED diagnosis. Figure 5G displays the potential response of the modified SPCE with increasing urea concentration. A well-defined linear relationship was obtained over the urea concentration range of 100-900 μM [Figure 5H], with a sensitivity of 8.1 mV·mM-1 and an LOD of 8.7 μM. These results demonstrate the feasibility of integrating the sensing system with SPCE for miniaturized urea sensing. However, for practical wearable applications, challenges such as reliable tear collection, appropriate sensor positioning, mechanical stability, and wearing comfort still need to be addressed.
CONCLUSIONS
In summary, AuAg NBs were fabricated via the template method and an in situ galvanic replacement reaction. The AuAg NBs have a hierarchical structure in which small nanobowls are nested within large ones. This structure provides a large electrochemically accessible surface area, while the material exhibits excellent conductivity and favorable biocompatibility. A GCE/AuAg NBs/urease electrochemical sensor was constructed for the quantitative detection of urea, using AuAg NBs as the electrode-modifying material. The sensor exhibited good linear responses in the urea concentration ranges of 0.1-1 mM and 1-6 mM. The LOD was 6.7 μM, which is comparatively low among the sensing systems. The sensor showed good repeatability over 20 consecutive measurements and satisfactory storage stability over 15 days. In addition, when an SPCE was modified with AuAg NBs, the sensor also exhibited a favorable linear response with a detection limit of 8.7 μM.
DECLARATIONS
Authors’ contributions
Writing - original draft, visualization, validation: Zhang, T.
Validation, supervision: Zou, Z.
Writing - review & editing, supervision, funding acquisition, conceptualization: Meng, R.
Writing - review & editing, supervision: Luo, S.
Supervision: Shen, Z.; Zhu, X.; Li, Z.; Zhang, Y.
Investigation: Lin, Q.
Validation: Ma, J.
Methodology: Jin, C.
Supervision, funding acquisition, conceptualization: Yang, J.
Supervision, funding acquisition: Xu, W.
Availability of data and materials
The data supporting the findings of this study are available within this Article and its Supplementary Materials. Further data are available from the corresponding authors upon request.
AI and AI-assisted tools statement
During the preparation of this manuscript, the AI tool ChatGPT (version 5.6 Sol, released 2026-07-09) was used solely for language editing. The tool did not influence the study design, data collection, analysis, interpretation, or the scientific content of the work. All authors take full responsibility for the accuracy, integrity, and final content of the manuscript.
Financial support and sponsorship
This work was supported by the National Natural Science Foundation (22379114, 22679146), Innovation Program of Shanghai Municipal Education Commission (2023ZKZD32), Shanghai Pujiang Program (24PJA130), the Fundamental Research Funds for the Central Universities (22120260448), and Interdisciplinary Research Project of Tongji University (2025-0255-YB-02).
Conflicts of interest
All authors declared that there are no conflicts of interest.
Ethical approval and consent to participate
Not applicable.
Consent for publication
Not applicable.
Copyright
© The Author(s) 2026.
Supplementary Materials
REFERENCES
1. Hussain, N.; Pu, H.; Sun, D. W. Core size optimized silver coated gold nanoparticles for rapid screening of tricyclazole and thiram residues in pear extracts using SERS. Food. Chem. 2021, 350, 129025.
2. Zhang, J.; Zhang, Y.; Qin, Z.; et al. How carbene ligands transform AuAg alloy nanoclusters for electrocatalytic urea synthesis. Angew. Chem. Int. Ed. 2025, 64, e202420993.
3. Zhang, R.; Xie, S.; Yang, X.; et al. Au-Ag alloy nanourchins as a highly efficient SERS tag synergistically with MOF@Au for the ultrasensitive detection of oxytetracycline. J. Colloid. Interface. Sci. 2025, 695, 137840.
4. Li, X.; Lin, X.; Fang, G.; et al. Interfacial layer-by-layer self-assembly of PS nanospheres and Au@Ag nanorods for fabrication of broadband and sensitive SERS substrates. J. Colloid. Interface. Sci. 2022, 620, 388-98.
5. Li, M.; Liu, X.; Sun, C.; et al. Ultra-sensitive simultaneous detection of dopamine and acetaminophen over hollow porous AuAg alloy nanospheres. Nanomaterials 2024, 14, 1131.
6. Xiao, S.; Wang, S.; Wang, X.; Xu, P. Nanoporous gold: a review and potentials in biotechnological and biomedical applications. Nano. Select. 2021, 2, 1437-58.
7. Pundir, C. S.; Jakhar, S.; Narwal, V. Determination of urea with special emphasis on biosensors: a review. Biosens. Bioelectron. 2019, 123, 36-50.
8. Velamakanni, G. S.; Sharma, A.; Batra, H. S.; Velamakanni, S. M.; Khan, M.; Gupta, S. Evaluation of tear film urea level as a diagnostic marker of dry eye disease: a pilot study. J. Lab. Physicians. 2022, 14, 43-6.
9. Shurbaji, S.; Khan, A.; Hassan, M. K.; et al. Advances in electrochemical urea biosensors: trends and future prospects. Adv. Sens. Res. 2026, 5, e00117.
10. Shalileh, F.; Sabahi, H.; Golbashy, M.; Dadmehr, M.; Hosseini, M. A simple smartphone-assisted paper-based colorimetric biosensor for the detection of urea adulteration in milk based on an environment-friendly pH-sensitive nanocomposite. Anal. Chim. Acta. 2023, 1284, 341935.
11. Woldemariam, G.; Kyad, A.; Moore, S.; et al. Development and validation of a HPLC-UV method for urea and related impurities. PDA. J. Pharm. Sci. Technol. 2020, 74, 2-14.
12. Khataee, S.; Dehghan, G.; Shaghaghi, Z.; Khataee, A. An enzyme-free sensor based on La-doped CoFe-layered double hydroxide decorated on reduced graphene oxide for sensitive electrochemical detection of urea. Mikrochim. Acta. 2024, 191, 152.
13. Ferlazzo, A.; Chelly, M.; Gulino, A.; Neri, G. Biosensing of urea with a functionalized gold electrode for health and food monitoring. J. Agric. Food. Chem. 2025, 73, 25628-35.
14. Thiyyadi, D.; Ramakrishnan, V.; Shankar, B.; Vijayan, L. Electrochemical biosensors for urea detection: recent trends and future perspectives. Microchem. J. 2025, 219, 115805.
15. Quadrini, L.; Laschi, S.; Ciccone, C.; Catelani, F.; Palchetti, I. Electrochemical methods for the determination of urea: current trends and future perspective. TrAC. Trends. Anal. Chem. 2023, 168, 117345.
16. Choi, Y.; Hong, S.; Liu, L.; Kim, S. K.; Park, S. Galvanically replaced hollow Au-Ag nanospheres: study of their surface plasmon resonance. Langmuir 2012, 28, 6670-6.
17. Liu, R.; Guo, J.; Ma, G.; et al. Alloyed crystalline Au-Ag hollow nanostructures with high chemical stability and catalytic performance. ACS. Appl. Mater. Interfaces. 2016, 8, 16833-44.
18. Hou, J.; Xu, C.; Zhao, D.; Zhou, J. Facile fabrication of hierarchical nanoporous AuAg alloy and its highly sensitive detection towards dopamine and uric acid. Sens. Actuators. B. Chem. 2016, 225, 241-8.
19. Johnson, L.; Walsh, D. A. Deposition of silver nanobowl arrays using polystyrene nanospheres both as reagents and as the templating material. J. Mater. Chem. 2011, 21, 7555.
20. Hong, G.; Li, C.; Limin, Qi. Facile fabrication of two-dimensionally ordered macroporous silver thin films and their application in molecular sensing. Adv. Funct. Mater. 2010, 20, 3774-83.
21. Liu, X.; Liu, F. Bimetallic (AuAg, AuPd and AgPd) nanoparticles supported on cellulose-based hydrogel for reusable catalysis. Carbohydr. Polym. 2023, 310, 120726.
22. Kresse, G.; Furthmüller, J. Efficiency of ab-initio total energy calculations for metals and semiconductors using a plane-wave basis set. Comput. Mater. Sci. 1996, 6, 15-50.
24. Grimme, S.; Antony, J.; Ehrlich, S.; Krieg, H. A consistent and accurate ab initio parametrization of density functional dispersion correction (DFT-D) for the 94 elements H-Pu. J. Chem. Phys. 2010, 132, 154104.
25. Sun, Y.; Xia, Y. Mechanistic study on the replacement reaction between silver nanostructures and chloroauric acid in aqueous medium. J. Am. Chem. Soc. 2004, 126, 3892-901.
26. Ha Pham, T. T.; Vu, X. H.; Dien, N. D.; et al. The structural transition of bimetallic Ag-Au from core/shell to alloy and SERS application. RSC. Adv. 2020, 10, 24577-94.
27. Hassanzadeh-Tabrizi, S. Precise calculation of crystallite size of nanomaterials: a review. J. Alloys. Compd. 2023, 968, 171914.
28. Mallin, M. P.; Murphy, C. J. Solution-phase synthesis of sub-10 nm Au-Ag alloy nanoparticles. Nano. Lett. 2002, 2, 1235-7.
29. Seah, M.; Gilmore, I.; Spencer, S. Measurement of data for and the development of an ISO standard for the energy calibration of X-ray photoelectron spectrometers. Appl. Surf. Sci. 1999, 144-145, 178-82.
30. Sham, T. K.; Yiu, Y. M.; Kuhn, M.; Tan, K. H. Electronic structure of ordered and disordered Cu3Au: the behavior of the Au 5d bands. Phys. Rev. B. 1990, 41, 11881-6.
31. Nishimura, S.; Dao, A. T. N.; Mott, D.; Ebitani, K.; Maenosono, S. X-ray absorption near-edge structure and X-ray photoelectron spectroscopy studies of interfacial charge transfer in gold-silver-gold double-shell nanoparticles. J. Phys. Chem. C. 2012, 116, 4511-6.
32. Ibáñez-Redín, G.; Rosso Cagnani, G.; O, Gomes. N.; et al. Wearable potentiometric biosensor for analysis of urea in sweat. Biosens. Bioelectron. 2023, 223, 114994.
33. Seelajaroen, H.; Mayr, F.; Wielend, D.; et al. Sustainable one-pot electrochemical approach for entrapment of multi-enzymes and biocompatible redox mediator. Chempluschem 2025, 90, e202400577.
34. Wang, J.; Xu, J.; Cheng, S.; Zhao, G.; Jiang, J. The effects and mechanisms of three typical veterinary antimicrobials on the activity of urease studied by spectroscopic and molecular docking methods. J. Nanjing. Agric. Univ. 2020, 43, 690-7. (in Chinese). https://html.rhhz.net/njnydxxb/202004015.htm (accessed 2026-11-09).
35. Canepa, P.; Gregurec, D.; Liessi, N.; et al. Biofunctionalization of porous titanium oxide through amino acid coupling for biomaterial design. Materials 2023, 16, 784.
36. Secchi, V.; Franchi, S.; Dettin, M.; et al. Hydroxyapatite surfaces functionalized with a self-assembling peptide: XPS, RAIRS and NEXAFS study. Nanomaterials 2020, 10, 1151.
37. Blanco Garcia, M.; Perilli, D.; Daldossi, C.; et al. Unraveling the role of the multifunctional groups in the adsorption of L-cysteine on rutile TiO2(110). J. Am. Chem. Soc. 2025, 147, 40158-70.
38. Xu, Z.; Yuan, S.; Yan, H.; Liu, C. Adsorption of histidine and histidine-containing peptides on Au(111): a molecular dynamics study. Colloids. Surf. A. Physicochem. Eng. Asp. 2011, 380, 135-42.
39. Madaninasab, P.; Labbaf, S.; Salehi, H. Tailored GelMA-chitosan-polypyrrole- CNT conductive scaffold for potential application in neural tissue regeneration. Macromol. Mater. Eng. 2026, 311, e00452.
40. Ezzat, N.; Hefnawy, M. A.; Fadlallah, S. A.; El-Sherif, R. M.; Medany, S. S. Synthesis of nickel-sphere coated Ni-Mn layer for efficient electrochemical detection of urea. Sci. Rep. 2024, 14, 14818.
41. Dervisevic, M.; Jara Fornerod, M. J.; Harberts, J.; Zangabad, P. S.; Voelcker, N. H. Wearable microneedle patch for transdermal electrochemical monitoring of urea in interstitial fluid. ACS. Sens. 2024, 9, 932-41.
42. Babu, K. J.; Senthilkumar, N.; Kim, A. R.; kumar, G. G. Freestanding and binder free PVdF-HFP/Ni-Co nanofiber membrane as a versatile platform for the electrocatalytic oxidation and non-enzymatic detection of urea. Sens. Actuators. B. Chem. 2017, 241, 541-51.
43. Rafiq, K.; Mai, H. D.; Kim, J. K.; et al. Fabrication of a highly effective electrochemical urea sensing platform based on urease-immobilized silk fibroin scaffold and aminated glassy carbon electrode. Sens. Actuators. B. Chem. 2017, 251, 472-80.
44. Liu, J.; Lu, W.; Zhang, L.; et al. Integrated hand-held electrochemical sensor for multicomponent detection in urine. Biosens. Bioelectron. 2021, 193, 113534.
45. Kumar, V.; Kaur, I.; Arora, S.; Mehla, R.; Vellingiri, K.; Kim, K. H. Graphene nanoplatelet/graphitized nanodiamond-based nanocomposite for mediator-free electrochemical sensing of urea. Food. Chem. 2020, 303, 125375.
Cite This Article
 Open Access
How to Cite
Zhang, T.; Zou, Z.; Meng, R.; Luo, S.; Shen, Z.; Zhu, X.; Lin, Q.; Ma, J.; Jin, C.; Li, Z.; Zhang, Y.; Yang, J.; Xu, W. Microstructure regulation of hollow AuAg alloy nanobowls toward high-performance electrochemical urea biosensing. Microstructures 2026, 6, 20260142. https://dx.doi.org/10.20517/microstructures.2026.226
Download Citation
If you have the appropriate software installed, you can download article citation data to the citation manager of your choice. Simply select your manager software from the list below and click on download.
Export Citation File
Type of Import
Tips on Downloading Citation
Citation Manager File Format
Type of Import
Direct Import: When the Direct Import option is selected (the default state), a dialogue box will give you the option to Save or Open the downloaded citation data. Choosing Open will either launch your citation manager or give you a choice of applications with which to use the metadata. The Save option saves the file locally for later use.
Indirect Import: When the Indirect Import option is selected, the metadata is displayed and may be copied and pasted as needed.
About This Article
Copyright

Data & Comments
Data
0











Comments
Comments must be written in English. Spam, offensive content, impersonation, and private information will not be permitted. If any comment is reported and identified as inappropriate content by OAE staff, the comment will be removed without notice. If you have any queries or need any help, please contact us at [email protected].