
fig2
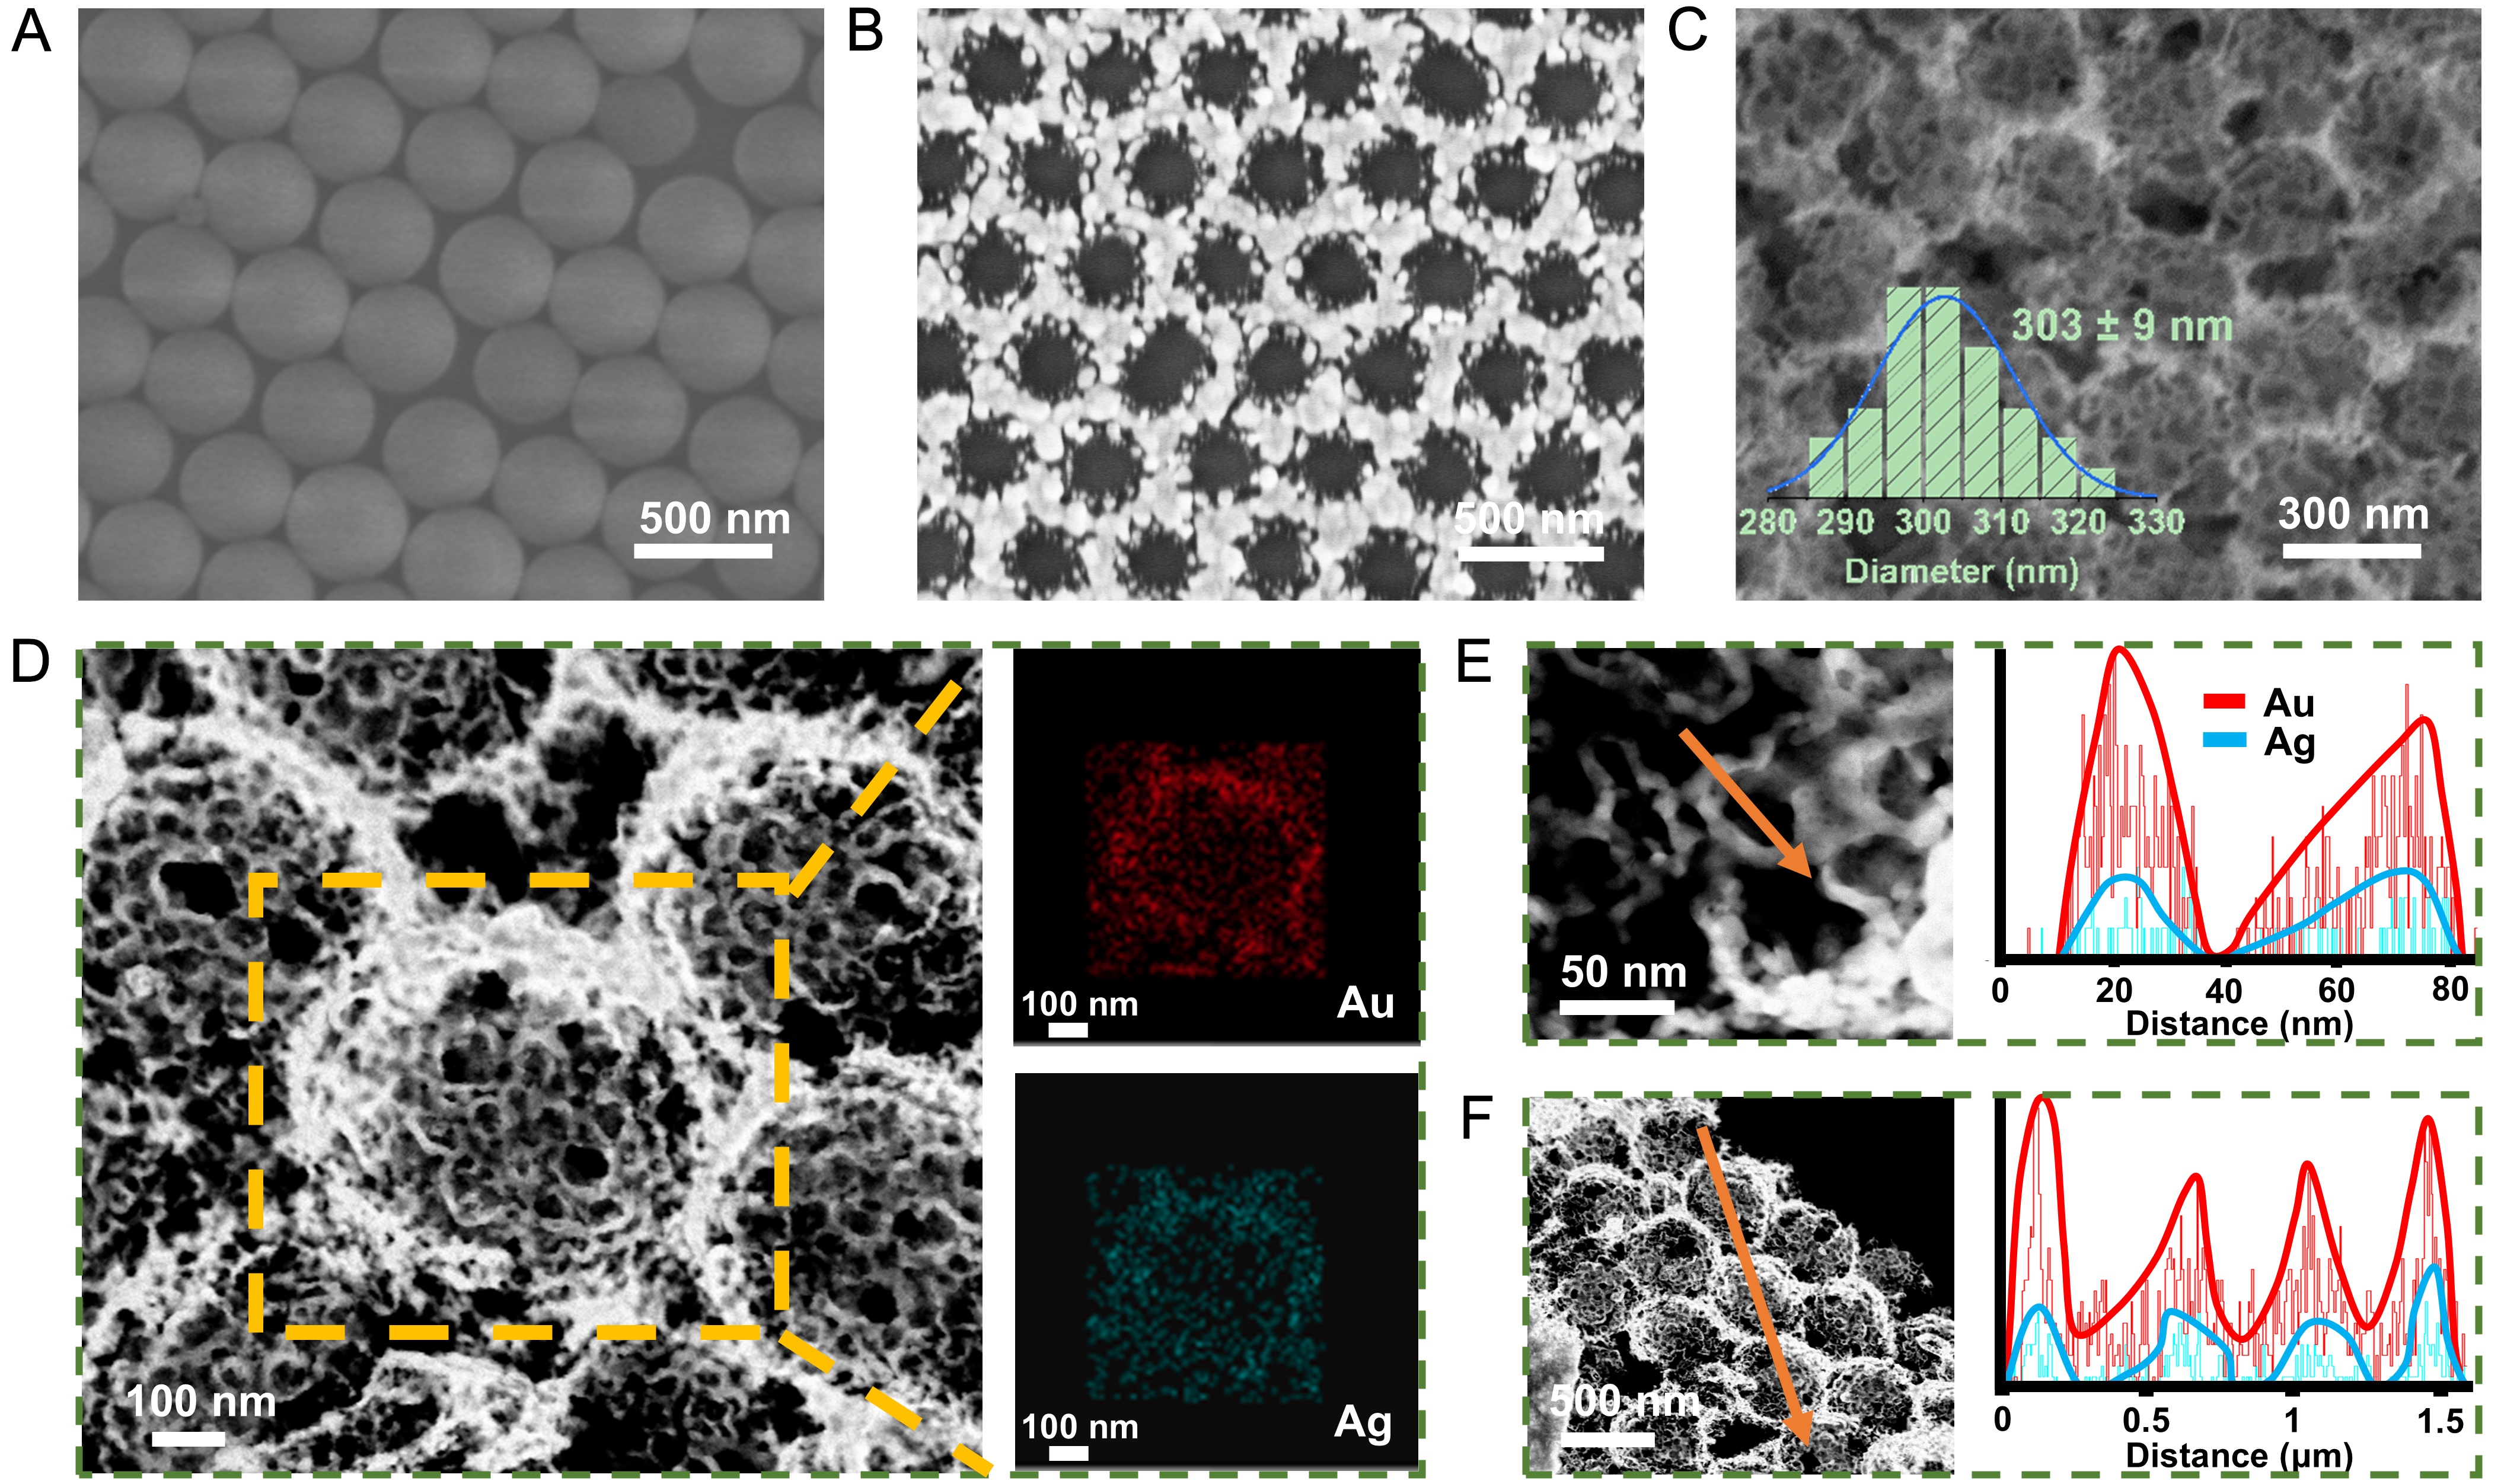
Figure 2. SEM images of (A) PS sphere monolayer, (B) PS@Ag film and (C) AuAg NBs; The inset in panel (C) shows the particle size distribution histogram of large nanobowls (n = 50); (D) Elemental analysis of AuAg NBs; EDS line scans of a single small AuAg nanobowl (E) and three large AuAg NBs (F). SEM: Scanning electron microscopy; PS: polystyrene; AuAg NBs: AuAg alloy nanobowls; EDS: energy-dispersive X-ray spectroscopy.