
fig5
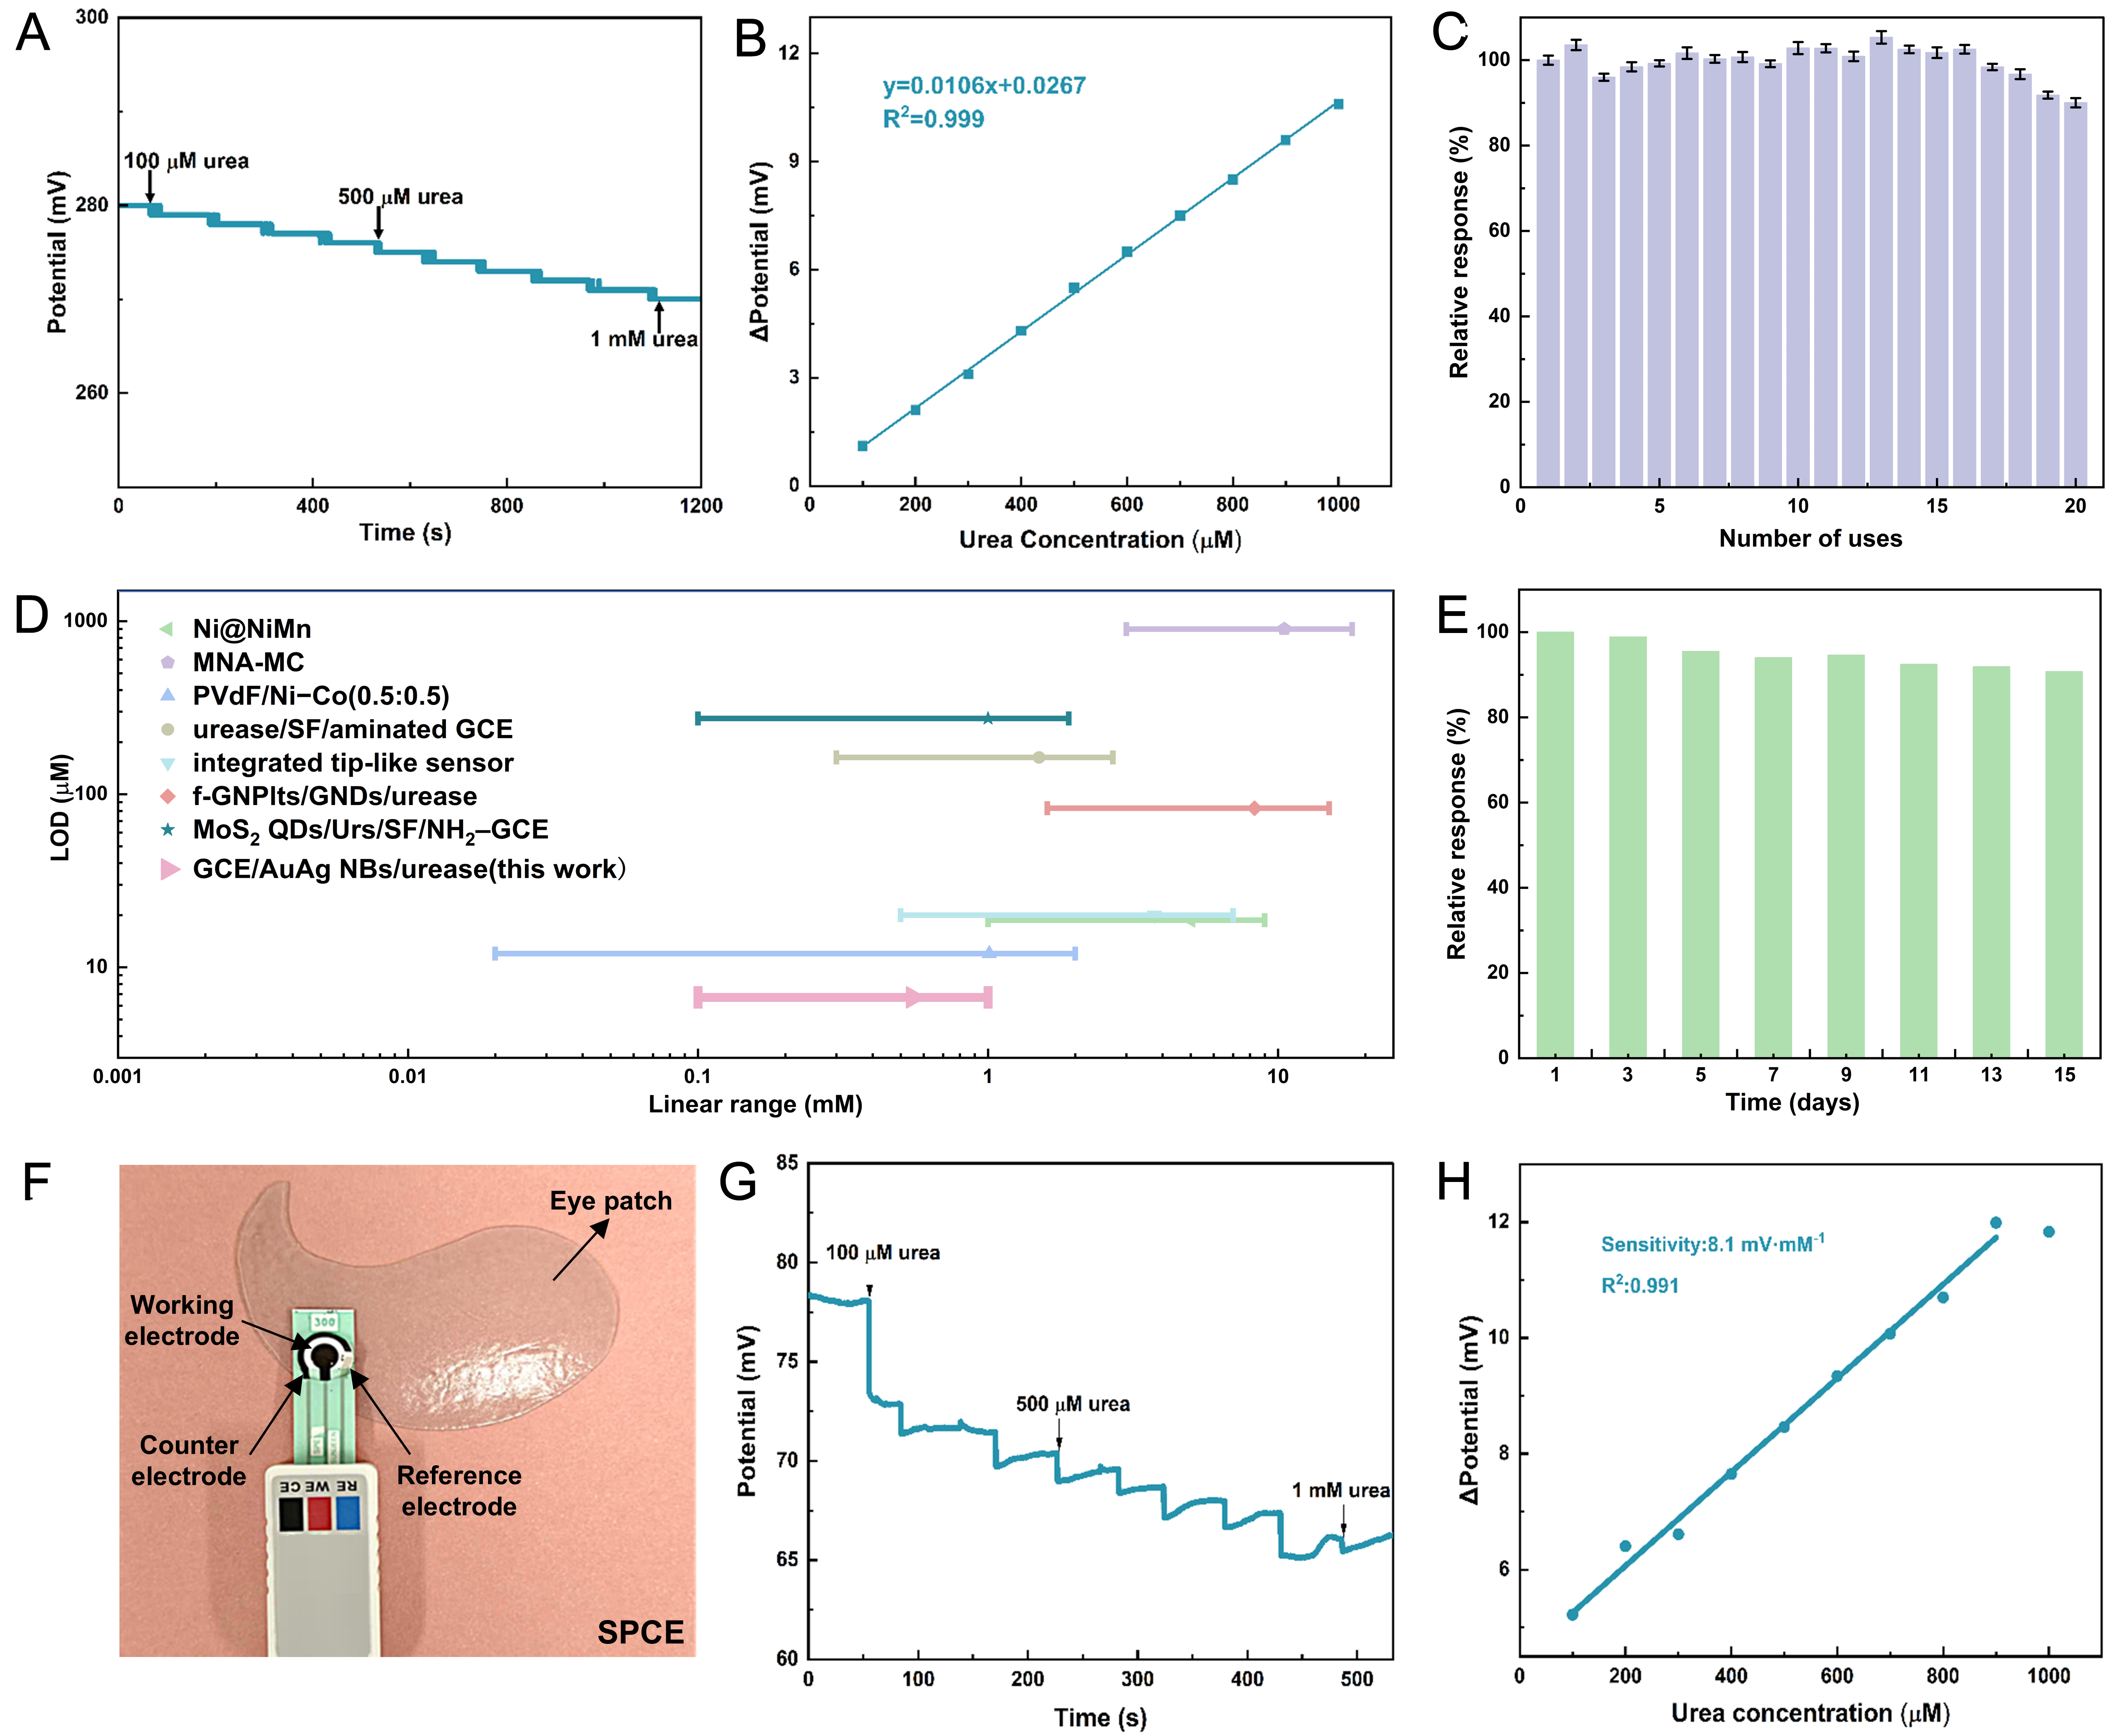
Figure 5. (A) Potentiometric response of the GCE/AuAg NBs/urease electrode with increasing urea concentration; (B) Calibration curve derived from panel (A); (C) Repeatability over 20 consecutive measurements (SD of n = 3); (D) Comparison of urea detection performance with previously reported sensing systems based on the present sensor’s low-concentration linear range of 0.1-1 mM; (E) Storage stability of the biosensor over 15 days; (F) Image of the SPCE integrated into an eye patch. The photograph was taken by the authors; (G) Potentiometric response of the SPCE to increasing urea concentration; (H) Calibration curve derived from panel (G). GCE: Glassy carbon electrodes; AuAg NBs: AuAg alloy nanobowls; SPCE: screen-printed carbon electrodes; MNA-MC: microneedle array-microcavities; PVdF: polyvinylidene fluoride; SF: silk fibroin; GNDs: graphitized nanodiamonds; f-GNPlts: functionalized graphene nanoplatelets; QDs: quantum dots; Urs: urease; SD: standard deviation.