

Design of metasurface uni-traveling-carrier photodetector with large area, high speed and high quantum efficiency
 0

Graphical Abstract
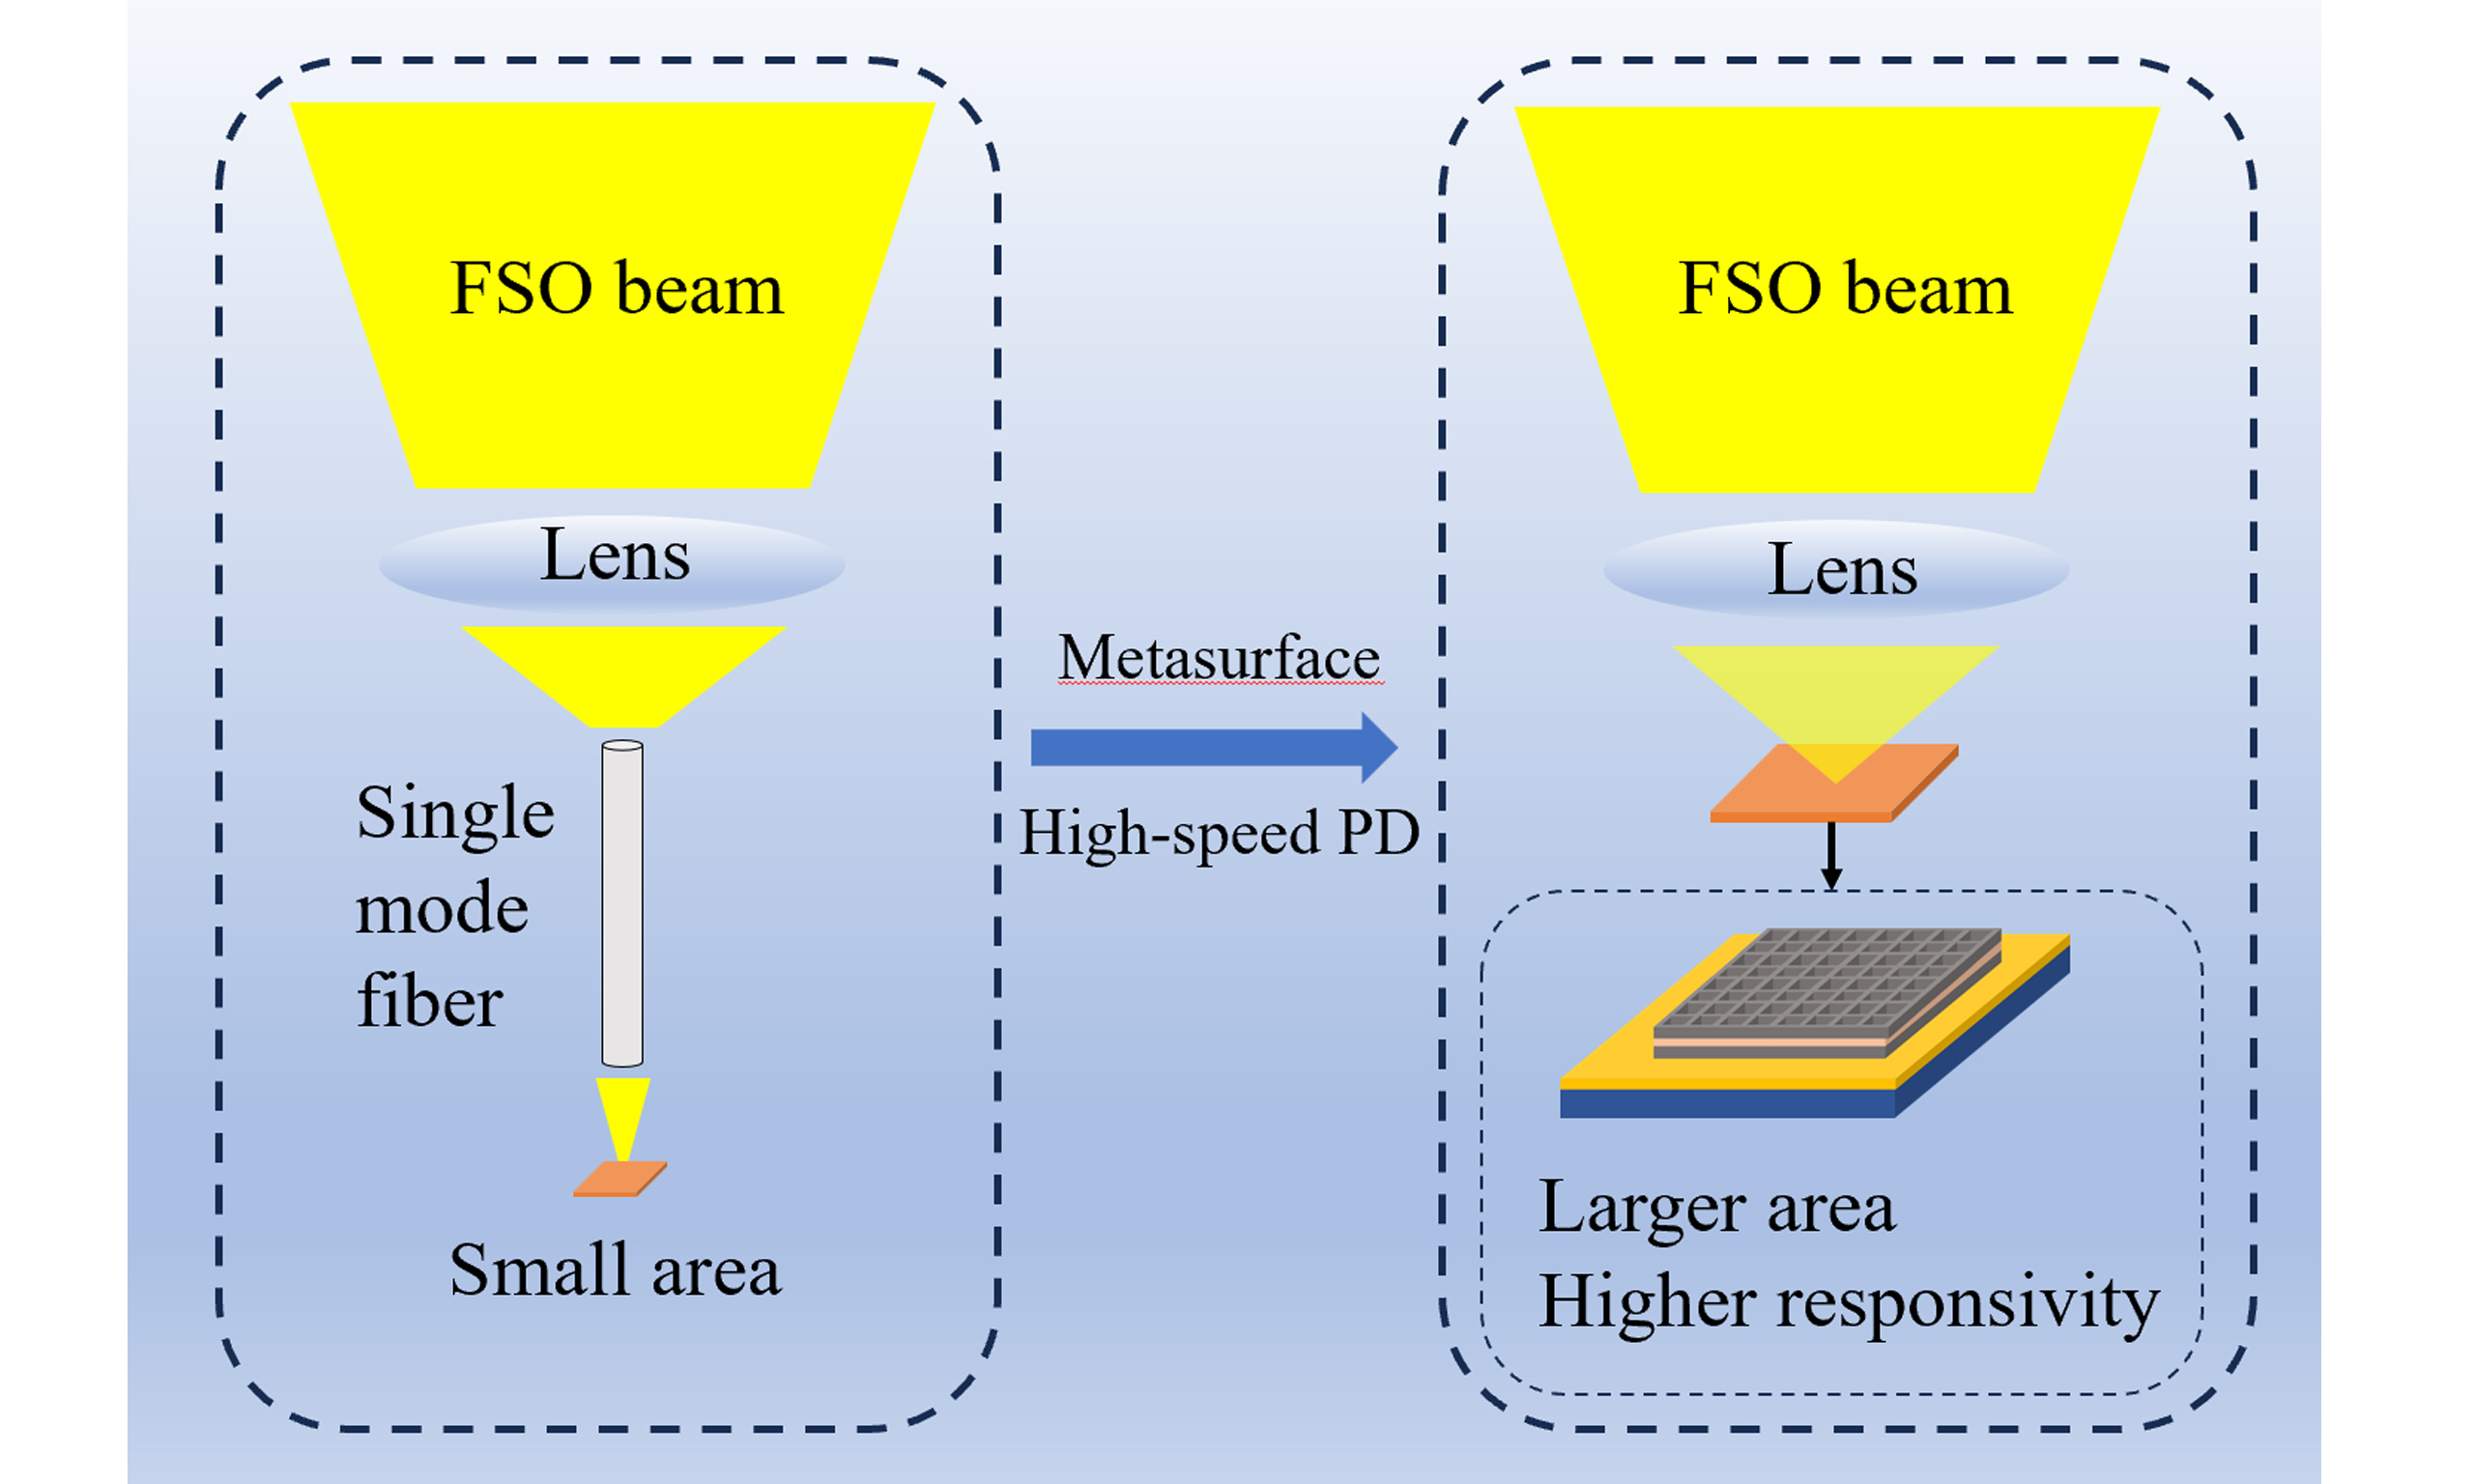
Abstract
Photodetectors (PDs) exhibit an inherent tradeoff among large active area, high responsivity and high-speed operation, posing great challenges for the design of optical wireless receivers. To satisfy the requirements of high-performance large-area PDs, innovative optical coupling and detection schemes are required. This work theoretically investigates a grid-structured uni-traveling-carrier PD (UTC-PD) operating at 1,550 nm. A metasurface microcavity is integrated in the device functional layer to confine incident light and enhance field localization. The proposed grid UTC-PD achieves an absorption efficiency of 92.7% with a 200-nm thin absorption layer, which is 5.65 times higher than that of conventional mesa devices with the same epitaxial structure. Because of its low duty cycle, the device delivers a 3-dB resistance-capacitance bandwidth of 26.08 THz·µm2 under -4-V bias, which is twice that of traditional mesa structures. This characteristic allows for nearly a twofold increase in the detection area under identical resistance-capacitance (RC)-limited bandwidth. Moreover, a 2 × 2 PD is designed based on the grid configuration. The array is expected to realize an 11.1-GHz bandwidth over a large area of 96 × 96 μm2, with absorption efficiency exceeding 80% at 1,550 nm. Simulations show that the active-region meta-surface reconstruction in indium gallium arsenide (InGaAs) PDs is a promising design concept that can alleviate the inherent tradeoff among detection area, responsivity, and bandwidth performance.
Keywords


 Download PDF
INTRODUCTION
Optical wireless communication (OWC) has progressed significantly in the last decade. Among its available spectral bands, the infrared band is widely used for establishing line-of-sight outdoor connections through free space optics (FSO)[1]. In optical communication systems[2], high-speed indium gallium arsenide (InGaAs) photodetector (PD) chips function as pivotal optoelectronic components that convert optical signals into processable electrical signals, with their performance fundamentally determining the system’s maximum information capacity. Conventional strategies for enhancing the bandwidth performance of InGaAs detectors involve inherent tradeoffs: (1) absorption layer thickness reduction to improve transit-time-limited bandwidth and (2) device active area minimization to enhance resistance-capacitance (RC)-limited bandwidth. Because of these detector limitations, conventional FSO equipment uses complex optics to focus and precisely couple the signal beam into a single-mode fiber and then convert it into an electrical signal using a PD with a small active area. The original purpose of this scheme is to provide the PD with a large 3-dB-RC bandwidth, which is inversely proportional to the active area, thus enabling high-speed optoelectronic conversion. However, this scheme faces some significant challenges. One is maintaining the alignment between the transmitter and the receiver, and another is ensuring the efficient coupling of the light beam into the fiber. Using PDs with small active areas makes the system sacrifice size, cost, and responsivity performance. Thus, balancing the photonic collection area and high-speed performance remains a design challenge.
Presently, there are few high-speed 10-GHz-range PDs with large active areas with diameters over
Large-area, high-speed PDs comprise an active research direction in the field of optical communication, and numerous designs have been investigated[1,3,6-11]. In 2018, Toshimasa Umezawa reported a two-dimensional multi-pixel type PD array (PDA) with a high 3-dB bandwidth over 10-GHz and a large photodetection area of 210 μm × 210 μm[3]. The pixels shared a common bottom electrode, and the upper electrode was led individually through the metal wires between the pixels. Thus, each pixel worked independently and the high-speed performance of the PDA depended on the individual pixel. This scheme partially addresses the conflict between size and bandwidth. However, the parasitic effect caused by the complex metal wires reduces the high-speed performance of the device. In addition, considerable spacing between the pixels is required, causing optical signal loss. In 2019, Daniele Palaferri reported a long-wavelength (9 μm) infrared quantum-well PD with a subwavelength metamaterial metallic resonator structure. The photonic collection area of the device was much larger than its active area, which led to a sizable 3-dB-RC bandwidth and a low dark current. The device outperformed the then-state-of-the-art devices at temperatures up to room temperature[12]. This work is significant for the development of long-wave infrared communications. In 2021, Michael Hakl optimized the structure reported by Daniele Palaferri and manufactured a 2D quantum-well PD array consisting of subwavelength patch antennas. The device working at 10 μm enables a flat frequency response up to 70 GHz at room temperature[13]. In 2021, an ultrahigh-quantum-efficiency and high-bandwidth nanowire array uni-traveling-carrier photodiode (UTC-PD) working at 1,064 nm was designed, the nanowire array structure enables ultrahigh quantum efficiency of over 93% at 1,064 nm with a tiny active area through the Fabry-Pérot (FP) resonance effect, making it suitable for FSO systems[14].
From the results reported in the literature[12-14], detectors with integrated microstructures can combine a large optical collection area with high responsivity and high-speed operation. However, these devices are difficult to fabricate. Previously[14], the electrical connection between nanowire PDs needs to be realized through transparent electrodes. However, the resistive properties of transparent electrode materials are not as good as those of metals, which is harmful to the RC bandwidth. In another previous study[13], the quantum well antenna units working at 10 μm were electrically connected by suspended metal wires. If the antenna structure is applied to devices working at short-infrared bands, the size of the units must be reduced by a few times. However, preparing suspended metal wires between small-sized antenna units is difficult. Therefore, device structures with both large size and high performance must be designed, which can be fabricated using typical semiconductor processes.
In this paper, a grid-structured UTC-PD is theoretically investigated to operate at 1,550 nm. By forming a metasurface microcavity structure within the functional layer of the detector, the incident power is confined inside the device, resulting in enhanced field localization. The grid UTC-PD with a 200-nm thick absorber layer presents a high absorption efficiency of 92.7% for 1,550 nm. The period size and the air duty cycle of the device are 1.2 µm and 0.7, respectively, which are close to those of scattering gratings for mid-wave infrared quantum-well PDs[15]. In addition, the design requires no special processes during device fabrication, such as the preparation of suspended metal wires. Furthermore, simulation results indicate that the optical performance of the grid structure exhibits low sensitivity to dimensional variations caused by typical semiconductor processes. Hence, the grid UTC-PD theoretically exhibits high fabrication process tolerance. The device’s active region has a volume duty cycle of 0.51, indicating that the RC bandwidth can be doubled relative to that of a conventional mesa structure. The 3-dB Frequency of Resistor-Capacitor bandwidth (fRC) and the 3-dB Frequency of carrier transit time bandwidth (ftr) are 26.08-THz·µm2 and 68-GHz under -4-V bias. To meet the demand for photodetectors with hundred-micron-scale dimensions and 10-GHz bandwidth, we design a 2 × 2 grid UTC-PD array with a large area of 96 × 96 μm2 and a 3-dB-bandwidth of 11.1-GHz, with an expected absorption efficiency of more than 80% for 1,550 nm light. Simulation results show that the active-region metasurface reconstruction of InGaAs PDs is a promising design concept that can alleviate the inherent tradeoff among detection area, responsivity, and bandwidth performance.
MATERIALS AND METHODS
The epitaxial layers of the UTC-PD are listed in Table 1. Layer 1 is a 100-nm P-contact layer with a doping level of 1.5 × 1019 cm-3; it acts as a p-type ohmic contact layer and a diffusion block layer for photogenerated electrons. The electric field is very weak in the p-doped (1 × 1018 cm-3) InGaAs absorber (layer 2) and strong in the unintentionally doped (3 × 1014 cm-3) InP collector (layer 5). This electric field distribution leads to the separation of the absorber and collector layers, allowing them to be designed separately in the UTC-PD, unlike in conventional p-i-n PDs. Layer 3 is a 15-nm InGaAsP-Q1.3 layer that smooths the conduction band offset between InGaAs and InP. Layer 4 is a 35-nm n-doped (2 × 1017 cm-3) layer used to increase the electric field intensity at the heterojunction between layers 2, 3, and 4 to accelerate electron transfer. Layer 6 is a 100-nm N-contact layer with a doping level of 1 × 1019 cm-3 that acts as an n-type ohmic contact layer. In specific acid solutions, InGaAsP has a large corrosion selectivity ratio relative to InP; therefore, layer 7 can serve as an etch-stop layer during substrate removal.
Epitaxial layer structure for grid UTC-PD
| Geometric structure | Number | Layer | Material | Thickness (nm) | Doping (cm-3)/type |
| Grid | 1 | P-contact | InP | 100 | 1.5e19/P |
| 2 | Absorber | InGaAs | Lab | 1e18/P | |
| 3 | Grading layer | InGaAsP Q1.3 | 15 | 1e15/N | |
| 4 | Cliff | InP | 35 | 2e17/N | |
| 5 | Collector | InP | 400 | 3e14/N | |
| 6 | N-contact | InP | 100 | 1e19/N | |
| 7 | Sacrificial layer | InGaAsP | 200 | 1e19/N | |
| SUB | InP |
Figure 1 illustrates the proposed manufacturing process and the simulation models of the grid UTC-PD. In Figure 1A, the blue part shows a material with high thermal conductivity, which acts as a support and a thermal conductor in the final device. The gray, pink and green parts are the materials of the UTC-PD. The gray part includes layers 1 and 3-6, the pink part is the absorber layer 2 and the green part comprises layer 7 and the InP substrate [Table 1], which are ultimately removed. Metal-organic chemical vapor deposition is widely used for the epitaxial growth of high-quality InGaAs detectors. Low-defect material epitaxy is critical for high-performance detectors. When x = 0.01896y/(0.04176 - 0.00125y), the lattice of In1-xGaxAsyP1-y material matches that of InP, enabling stress-free and low-defect epitaxial growth. Therefore, precise control of the composition in layers 2 and 3 is essential. Notably, the stoichiometric ratio of As and P in Layer 3 is highly sensitive to temperature. Minor temperature fluctuations during epitaxy can significantly alter the solid-phase incorporation efficiency of As and P, thereby affecting the material composition. Therefore, temperature uniformity must be maintained within the epitaxial chamber. Additionally, the growth rate must be reduced to achieve atomic-level deposition of InP and InGaAs. Parameters such as growth temperature and chamber pressure should be optimized to suppress the generation of defects such as dislocations during the process.
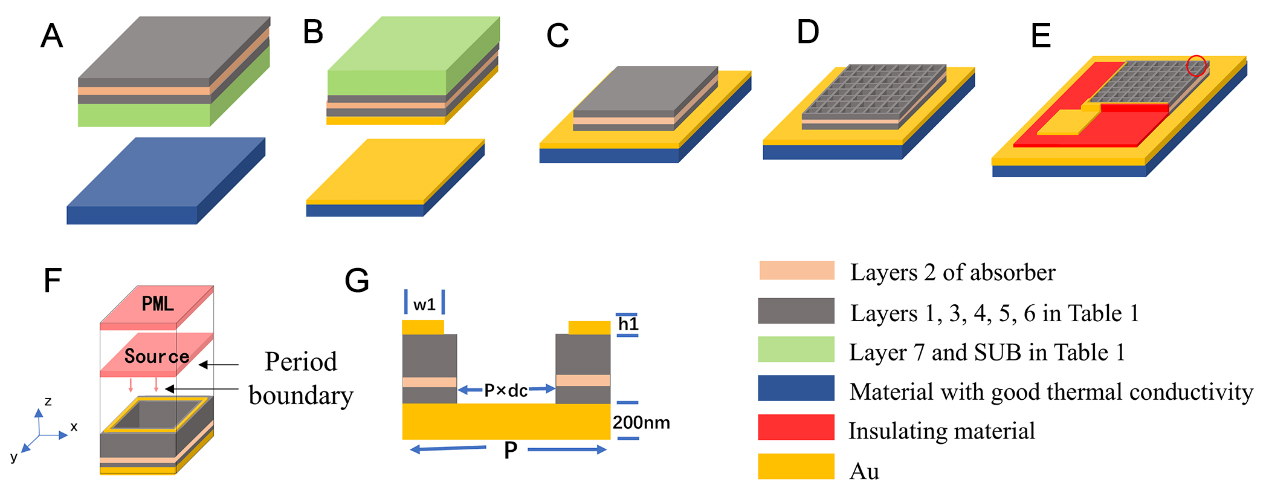
Figure 1. (A-E) Flowchart of the proposed fabrication process for the grid UTC-PD. (A) Thermally conductive material (blue) and detector epitaxial wafers (gray, pink and green); (B) growth of metal (yellow) on the thermally conductive material and epitaxial wafer; (C) metal bonding and complete substrate removal for the epitaxial wafer; (D) etching of the grid structure; (E) preparation of the upper metal electrode, with the red part denoting the insulating material; (F) Schematic of the grid UTC-PD unit; (G) x-z cross-section of the grid UTC-PD unit, the gray part includes layers 1-6 in Table 1; the thickness of the lower electrode was set to 200 nm. UTC-PD: Uni-traveling-carrier photodiode; SUB: substrate.
In Figure 1B, Au (yellow part) is deposited on the thermally conductive material and layer 1 of the UTC-PD. In Figure 1C, metal bonding combines the thermal conductor and the UTC-PD. Then, the green part is completely removed through grinding and polishing. In Figure 1D, the grid structure is formed. Short-infrared metasurface devices exhibit subwavelength-scale dimensions (hundreds of nanometers), and their optical performance is highly sensitive to structural geometry. To achieve high-precision pattern transfer, electron beam lithography (EBL) with superior resolution is indispensable. The selection of photolithographic mask materials should be prioritized. The high-resolution photoresists suitable for EBL are too thin to be used as etch masks for III-V materials. In our experience, the combination of high-resolution positive-tone resist (ZEP520a) and silicon oxide is recommended. Inductively coupled plasma (ICP) etching, known for its anisotropic etching characteristics, is suitable for high-precision pattern transfer in III-V materials. The CH4/Cl2/H2 gas combination has been used to fabricate high-performance InGaAs detectors. ICP parameters, such as gas composition, gas flow rate, Radio Frequency (RF) power, ICP power, and chamber pressure, must be further optimized to balance the physical and chemical etching during the ICP process and ultimately obtain grid-type mesas with smooth and vertical sidewalls. Then, the acid solution with low concentration is used to remove surface-etching-damaged layer, and thereby reduce the surface dark current. In Figure 1E, the metal (yellow part) is deposited on layer 6 as a top electrode, and the insulating material (red part) is prepared. Then, the top electrode is led on the insulating material. At this point, the device preparation is complete. The simulations were performed using the Electromagnetic Waves, Frequency Domain (EWFD) interface and the Semiconductor module in COMSOL Multiphysics. The finite element method (FEM) was also implemented in COMSOL Multiphysics. FEM offers strong capability in handling complex geometries with fine structural details and provides high solution accuracy. However, such accuracy is highly sensitive to the mesh quality, and the method requires considerable computational resources. In addition to FEM, several more advanced numerical approaches for electromagnetic field simulations have been reported previously[16,17], such as the nonlocal operator method and the thermodynamically consistent deep energy method. These methods can significantly simplify the simulation workflow and are particularly well suited for device optimization and inverse design.
Figure 1F shows the optical model of the grid-structured UTC-PD with periodic boundary conditions in the x and y directions. In the EWFD interface, a port was positioned at a distance of one incident wavelength above the top surface of the device. The port type was set to periodic, and the incident electromagnetic wave excitation was properly defined. The slit type was configured as domain-supported, and the option for activating the slit condition on the internal port was enabled. A perfectly matched layer (PML) was placed above the excitation port, and the scattering boundary condition was applied to its upper boundary.
Figure 1G shows the schematic cross-section of the periodic unit in the x-direction, where the bottom metal electrode thickness was set to 200 nm, which was much larger than the penetration depth of the incident light in the metal. Thus the selection of the thermally conductive material did not affect the optical performance of the device and the blue part was removed in the simulation. With these settings, the number of meshes could be reduced and the simulation efficiency could be improved. Due to the low thermal conductivity of InP, InGaAs-based high-speed photodiodes can exhibit significant improvement by flip-chip bonding to a material with good thermal conductivity[18-21]. The potential advantage of grid PD is that there is no need to consider the effect of thermally conductive materials on optical performance. Therefore, the material choice for the blue part can be mainly based on thermal conductivity.
Within the solver module, the relative tolerance was set to 0.0001. Maxwell’s equations are discretized and solved using the Galerkin FEM. Internally, the software transformed the partial differential equations into the corresponding integral weak form: within each mesh element, the equation was multiplied by a vector test function W and integrated over the entire computational domain. By applying the divergence theorem, the second-order curl operator was reduced to first order, thereby constructing a system of linear algebraic equations comprising stiffness and mass matrices. Finally, the electromagnetic field strength E at each mesh node was obtained. The optical power absorbed by the grid PD could be calculated as[22]
where
In the Semiconductor module, the electron-hole-pair generation rate profile G(
where Rn and Rp denote the carrier recombination rates, with commonly used recombination models including the SRH and Auger recombination mechanisms;
The above model was previously employed in our previous design work[14] and is used here to reproduce the photodetector structures reported in other previous studies[23,24]. The simulation results obtained using this model show good agreement with both the simulated and experimental data reported in the original literature.
RESULTS AND DISCUSSION
Figure 2 shows the optical performance of the grid UTC-PD under illumination with x-polarized light. The period (P) of the grid unit and the duty cycle of the air (dc) were set to 1.2 μm and 0.7, respectively. The metal fabrication was first assumed to be ideal, with the top metal electrode strictly partially fitted to the grid detector so that w1 is set to
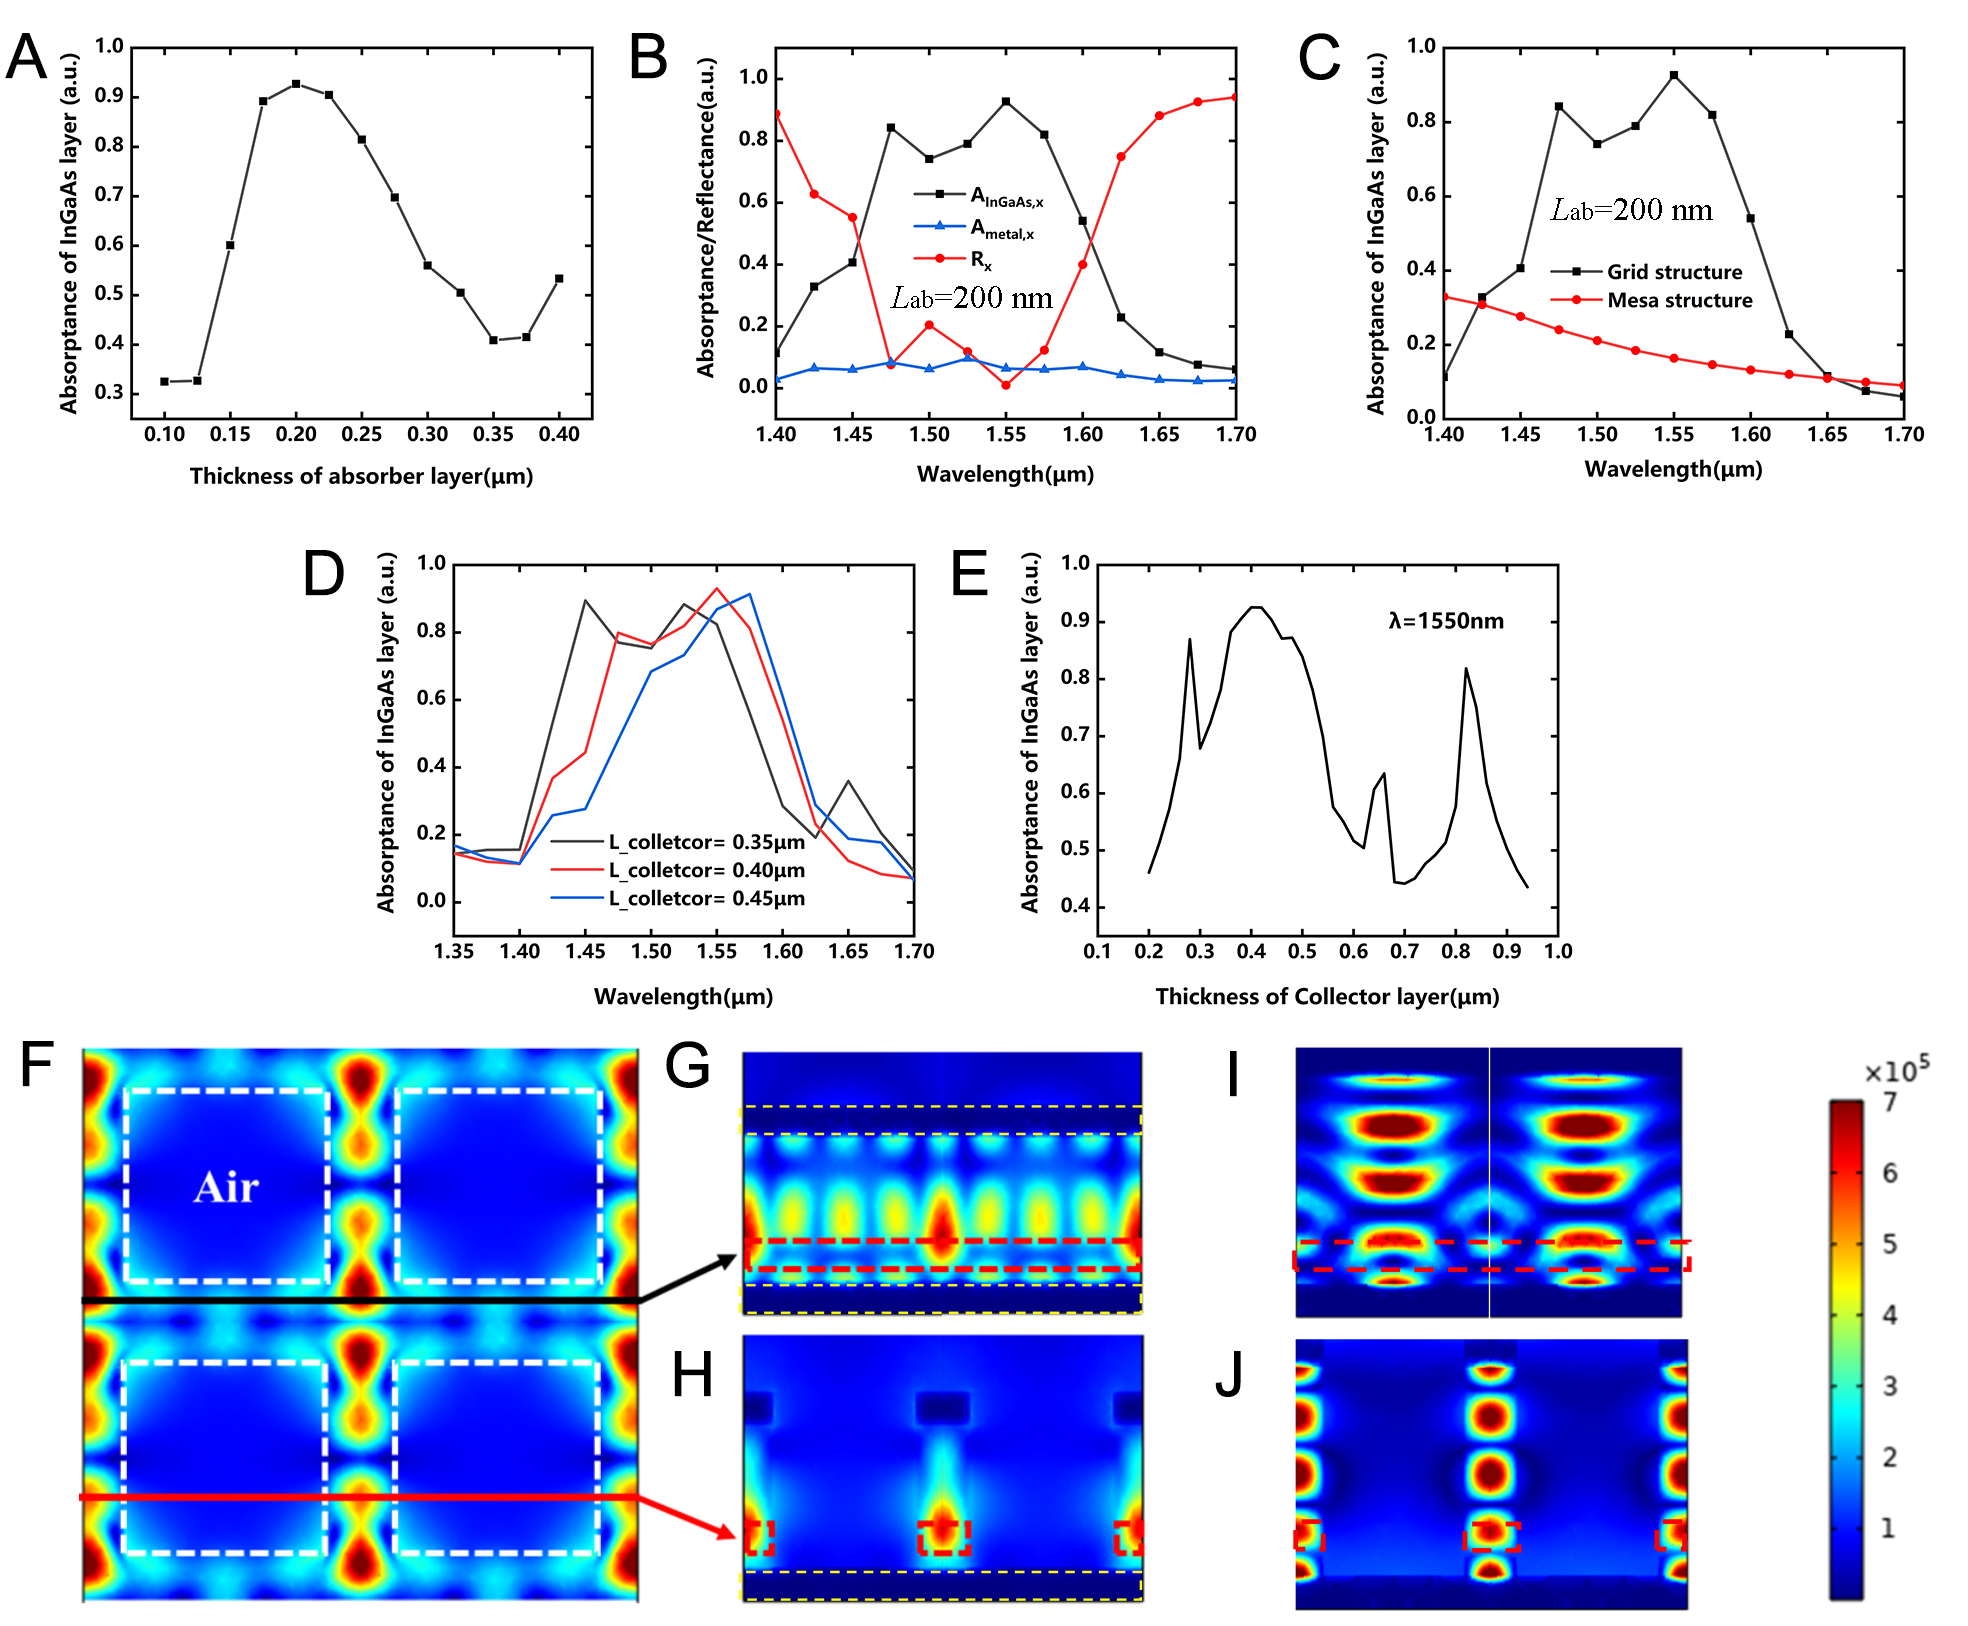
Figure 2. (A) Absorber layer thickness versus the absorption efficiency of the absorber layer 2 (AInGaAs,x); (B) Absorptance and reflectance spectra of the grid UTC-PD with Lab = 200 nm. AInGaAs,x denotes the absorption efficiency of the absorber layer-2, Ametal,x denotes the absorption efficiency of the metal, and Rx denotes the reflectance of x-polarized light; (C) AInGaAs,x of the grid UTC-PD and mesa UTC-PD; (D) AInGaAs,x spectra for different thicknesses of collector layer 5 (Lcollector); (E) Thickness of layer 5 versus AInGaAs,x; (F) Field distributions in the x-y cross-section at the middle of the absorber layer of 2 × 2 grid units; Lab = 200 nm, Lcollector = 400 nm. The white dotted box outlines enclosed air; the rest of the area includes the detectors; (G and H) Field distributions in the x-z cross-section at the black line and the x-z cross-section at the red line. Inside the red dotted box is the absorber layer. Inside the yellow dotted box is the metal; (I and J) Field distributions in the x-z cross-section inside the grid device; Lab = 200 nm, Lcollector = 820 nm. Inside the red dotted box is the absorber layer. Inside the yellow dotted box is the metal. UTC-PD: Uni-traveling-carrier photodiode; Lab: thickness of the absorber layer.
Figure 2A shows the relationship between the absorption efficiency (AInGaAs,x) and the thickness of the absorber layer (Lab) at an incident wavelength of 1,550 nm. The grid PD shows a peak AInGaAs,x of 92.7% at Lab =
Reducing the thickness of the absorber layer is thus an effective means of increasing the ftr bandwidth. As shown in Figure 2B, when Lab is 200 nm, the grid PD exhibits strong absorption properties for the incident light range from 1.47 to 1.58 μm and AInGaAs,x peaks at 1,550 nm. The reflectivity (Rx) and the metal absorptance (Ametal,x) are only 0.9% and 6.37%, respectively. Figure 2C compares the AInGaAs,x spectra of the grid and traditional mesa PDs with identical epitaxial structures. Without the optical modulation of the microstructures, the absorption of the mesa PD is only 16.4% at 1,550 nm, which decreases with increasing wavelength of the incident light.
Figure 2D presents the absorption efficiency spectra of the device for different collector layer thicknesses. The collector layer is made of InP, which is transparent at 1,550 nm. As the collector thickness increases, the absorption spectra exhibit a distinct redshift. Figure 2E shows the absorptance at 1,550 nm as a function of collector thickness, where primary peaks appear at thicknesses of 400 and 820 nm.
The field distribution in the x-y cross-section at the middle of the absorber layer of 2 × 2 grid units is shown in Figure 2F, where Lab = 200 nm and Lcollector = 400 nm. The white dashed box outlines the enclosed air, whereas the remaining region is the absorber. Energy is localized inside the absorber layer, with very little energy penetrating into the air at the corners. For x-polarized incident light, a strong energy-localized mode distribution forms along the grid in the y-direction, whereas a weak energy-localized mode distribution forms along the grid in the x-direction.
The field distributions in the x-z cross-section at the position of the black and red lines in Figure 2F are shown in Figure 2G and 2H, respectively. Strong standing-wave effects exist in both the lateral and vertical directions. As shown in Figure 2G, because there is no abrupt refractive-index change in the x-direction, the energy-localized mode distribution is formed over the entire cross-section. Two localized resonant modes appear along the z-direction. In Figure 2H, the device acts as an FP-like cavity composed of air (low refractive index), detector (Q1.3) (high refractive index), and air (low refractive index). Energy localizes inside the detector part with a high refractive index.
Figure 2I and J present field distributions at analogous positions when the collector layer thickness is increased to 820 nm. Four pronounced localized energy modes appear along the z-direction. Upon doubling the collector layer thickness, the increase in the number of localized modes indicates that a significant contributor to the enhanced absorption in this device is the FP-like localized resonance effect along the z-direction. In addition, Figure 2H and J show that the energy is effectively localized within the grid along the x-direction, and no discernible leakage into the air is present. With this field distribution, energy is maximally localized inside the PD. No significant energy localization effects are observed around the metal, corresponding to the low value of Ametal,x in Figure 2B.
The geometry of the microstructures usually greatly impacts the final performance of the device. Thus, process robustness must be considered. For the grid PD, several process steps are difficult to perform as expected. First, the width of the top metal electrode is difficult to match exactly to that of the grid PD, and it is almost impossible for the metal to be a perfect rectangle after stripping. If the size and shape of the top metal have a significant role in the regulation of the incident light, grid PD devices will face a huge reliability problem. In addition, because of the errors in the lithography and etching processes, it is difficult to realize perfect 90° grid corners. According to our experience with III-V material etching process, grid corners are usually rounded, and the duty cycle of the grid tends to have a certain degree of error. Finally, the III-V semiconductor usually needs to be passivated to resist oxidation and contamination of the sidewalls. Moreover, passivation helps reduce the surface leakage current of the device[25-27].
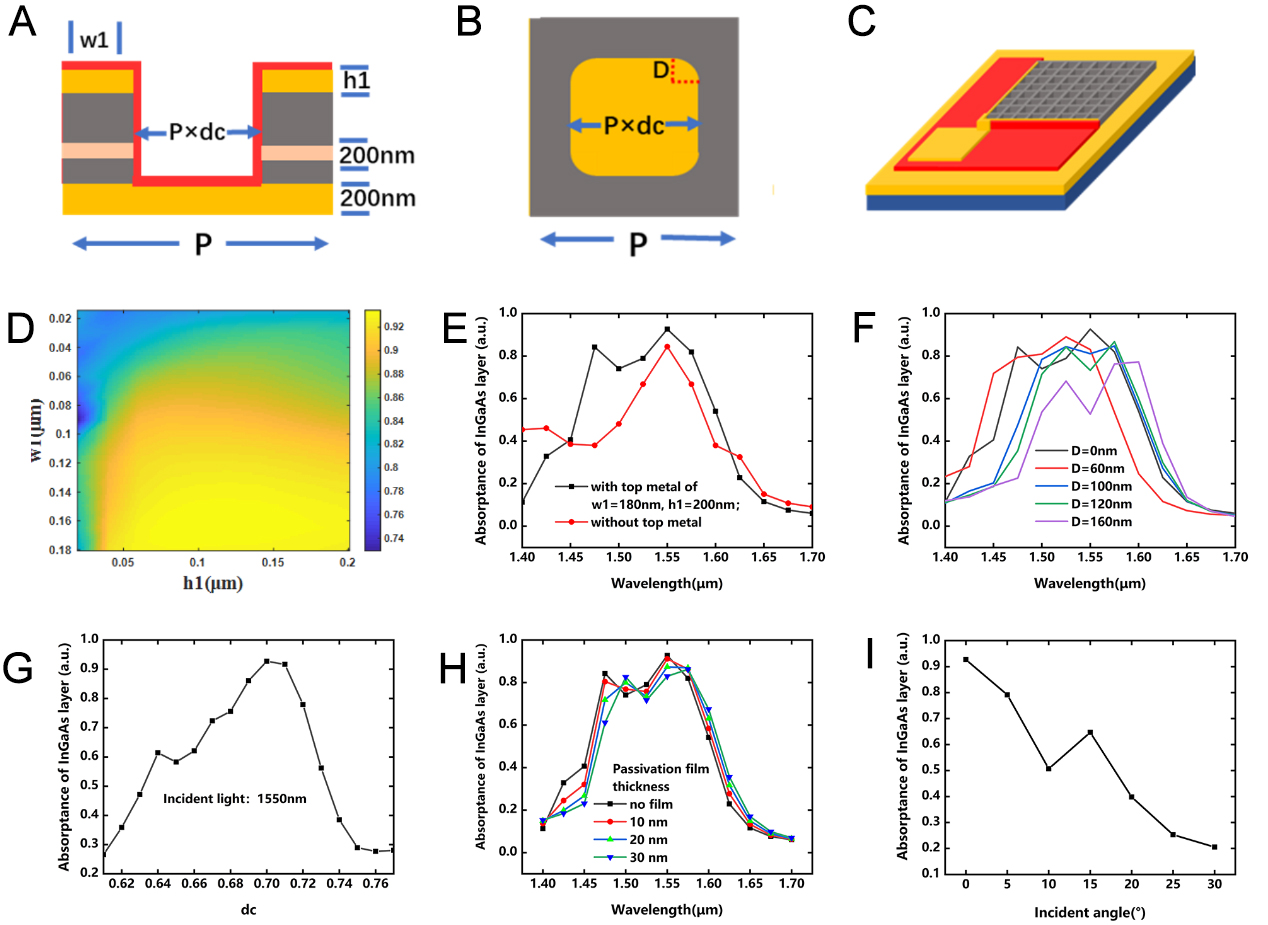
Figure 3. (A) x-z cross-section of the grid UTC-PD unit with SiO2 passivation films. The gray part includes layers 1-6 in Table 1 with a total thickness of 850 nm, and the thickness of the lower electrode is set to 200 nm; (B) x-y cross-section of the grid UTC-PD unit. D is the radius of the arc at the grid corner; (C) Schematic of the grid UTC-PD device with the top electrode prepared only at the edge of the upper layer; (D) Width (w1) and height (h1) of the top metal versus AInGaAs,x of grid UTC-PD under 1,550 nm x-polarized light illumination; (E) AInGaAs,x spectra of the grid UTC-PD with the ideal top metal morphology (black line, w1 = 180 nm, and h1 = 200 nm) and without the top metal (red line, w1 = 0 nm, and h1 = 0 nm); (F) AInGaAs,x spectra of the grid UTC-PD for different radii of the arcs at grid corners (D); (G) Air duty cycle (dc) versus AInGaAs,x of the grid UTC-PD under 1,550 nm x-polarized light illumination; (H) AInGaAs,x spectra of the grid UTC-PD for different passivation film thicknesses; (I) AInGaAs,x of the grid UTC-PD at 1,550 nm under x-polarized light versus the incident angle. UTC-PD: Uni-traveling-carrier photodiode.
Therefore, the effect of passivation film thickness on optical properties must be studied. Figure 3 illustrates the process robustness of the grid UTC-PD. Figure 3A and B show the x-z and x-y sections of the grid unit, respectively. The effect of some process-related geometric parameters on optical performance has been investigated, such as the width (w1) and height (h1) of the top metal, the radius (D) at grid corners, the air duty cycle (dc), and the thickness of the silicon oxide passivation film.
Figure 3D shows the absorption of the grid UTC-PD for 1,550 nm incident light with different h1 and w1. The device exhibits a high absorption of over 70% at 1,550 nm and different top metal sizes. Figure 3E shows the absorption spectrum of the device with the ideal top metal morphology and without the top metal. When there is no top metal, AInGaAs,x decreases from 92.7% to 84.5%, which is still a high value. Therefore, the presence or morphology of the top metal does not have much effect on the optical performance of the grid device. Thus, during device preparation, the top electrodes can be prepared at the very edge of the grid array as shown in Figure 3C, which can greatly reduce the process difficulty.
Figure 3F shows the absorption spectra of the grid UTC-PDs with different values of D. As shown in Figure 3F, AInGaAs,x reaches 73.5% at 1,550-nm incident light and a D value of 120 nm, which is still a high value. When D = 160 nm, the absorption decreases rapidly to 52.8%. The morphology of the grid corners thus affects the optical response. Nevertheless, in the case of a non-perfect process, there is still a huge performance improvement relative to the traditional mesa structure. Meanwhile, Figure 3G shows that dc has an important effect on the absorption performance of the grid device, which imposes high demands on photolithography and the etching process. Thus, the value of dc must be controlled between 0.68 and 0.72 to make the absorption of the grid device greater than 70%.
According to Figure 3H, the presence of the SiO2 passivation film does not affect the absorption spectrum too much. The main peak near 1,550 nm is redshifted as the thickness increases, and the absorption at 1,550 nm decreases from 92.7% to 82.9%. The influence of the incident angle is also crucial for practical applications. Figure 3I demonstrates that for 1,550 nm light, as the incidence angle increases from 0° to 10°, AInGaAs,x gradually decreases. When the angle is further increased to 15°, AInGaAs,x exhibits a moderate increase, followed by a subsequent decrease upon further increasing the angle.
The electric field distribution and energy-band diagram of the UTC-PD with a 200-nm-thick absorber layer under 0-, 2-, and 4-V reverse biases are investigated as shown in Figure 4A and B. Reverse bias significantly impacts the energy band and electric field at the grading layer (layer 3), the cliff layer (layer 4), and the collector layer (layer 5). Under different reverse biases, almost the entire electric field is zero in layer 2 because of its high doping concentration. Therefore, during carrier transport, the photogenerated electrons first diffuse slowly in the absorber layer, then cross the conduction band barrier and pass through the collecting layer with a faster drift motion under electric field acceleration, and finally are collected by the electrode. The transition time of the UTC-PD mainly depends on the electron diffusion time in the absorber layer and the drift time in the collection layer.
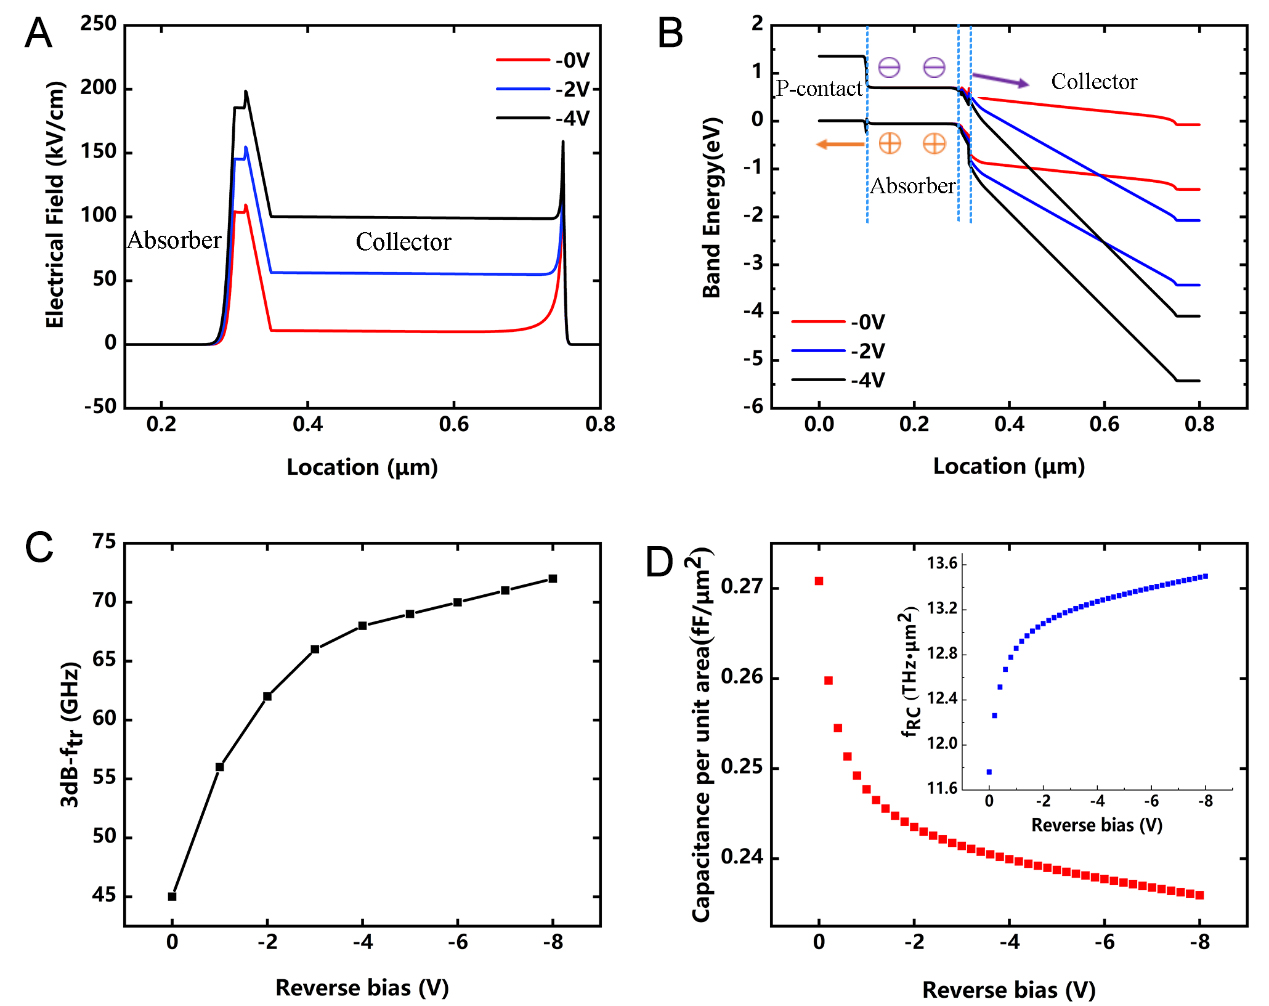
Figure 4. (A) Electric field distribution and (B) energy-band diagram for 0-, 2-, and 4-V reverse bias; (C) 3-dB-ftr vs. reverse bias; (D) Capacitance per unit device junction area vs. reverse bias. The accompanying figure shows the 3-dB-fRC calculated using formula 6. fRC: frequency of resistor-capacitor bandwidth; ftr: frequency of carrier transit time bandwidth.
Figure 4A shows that the collector layer is depleted under 0 V because of the ultralow background doping concentration. The average electric field strength in this layer is about 10 kV/cm, and electrons pass through the layer at the maximum drift rate. As the reverse bias increases, the field strength rises, and the electrons gradually drift at a saturation rate. It appears that the UTC-PD should have an optimal transition time in the collector layer at 0 V. However, the conduction band barrier between the absorber and collector layers can also significantly affect electron transport. In Figure 4B, the barrier gradually disappears as the reverse bias voltage is raised, which favors electron transport. Thus, in Figure 4C, the transition-time bandwidth (ftr) increases with the reverse bias and shows a saturation trend at around -4 V. In addition to the carrier transition time, the junction capacitance of the device also significantly impacts its high-speed performance. The RC bandwidth (fRC) can be expressed as
where R is the load resistor, usually set to 50 Ω; and C is the junction capacitance of the photodiode. Figure 4D shows the capacitances per µm2 of the UTC-PD for reverse bias levels up to 8 V. Because the collector layer 5 is fully depleted at 0 V, the increase in reverse bias barely increases the length of the depletion layer, and the capacitance value remains almost unchanged. The inset in Figure 4D presents the 3-dB-fRC from formula (6), where the capacitance is normalized to the device’s optical detection area. The 3-dB bandwidth can be expressed as
For a conventional mesa structure photodiode with an area of 100 × 100 μm2, the 3-dB-bandwidth is 1.3 GHz under -4 V, dominated by RC time.
Figure 5A shows the photocurrents versus a set of incident optical powers. The responsivity of the grid unit is 1.12 A/W. The relationship between the external quantum efficiency η and responsivity is described as
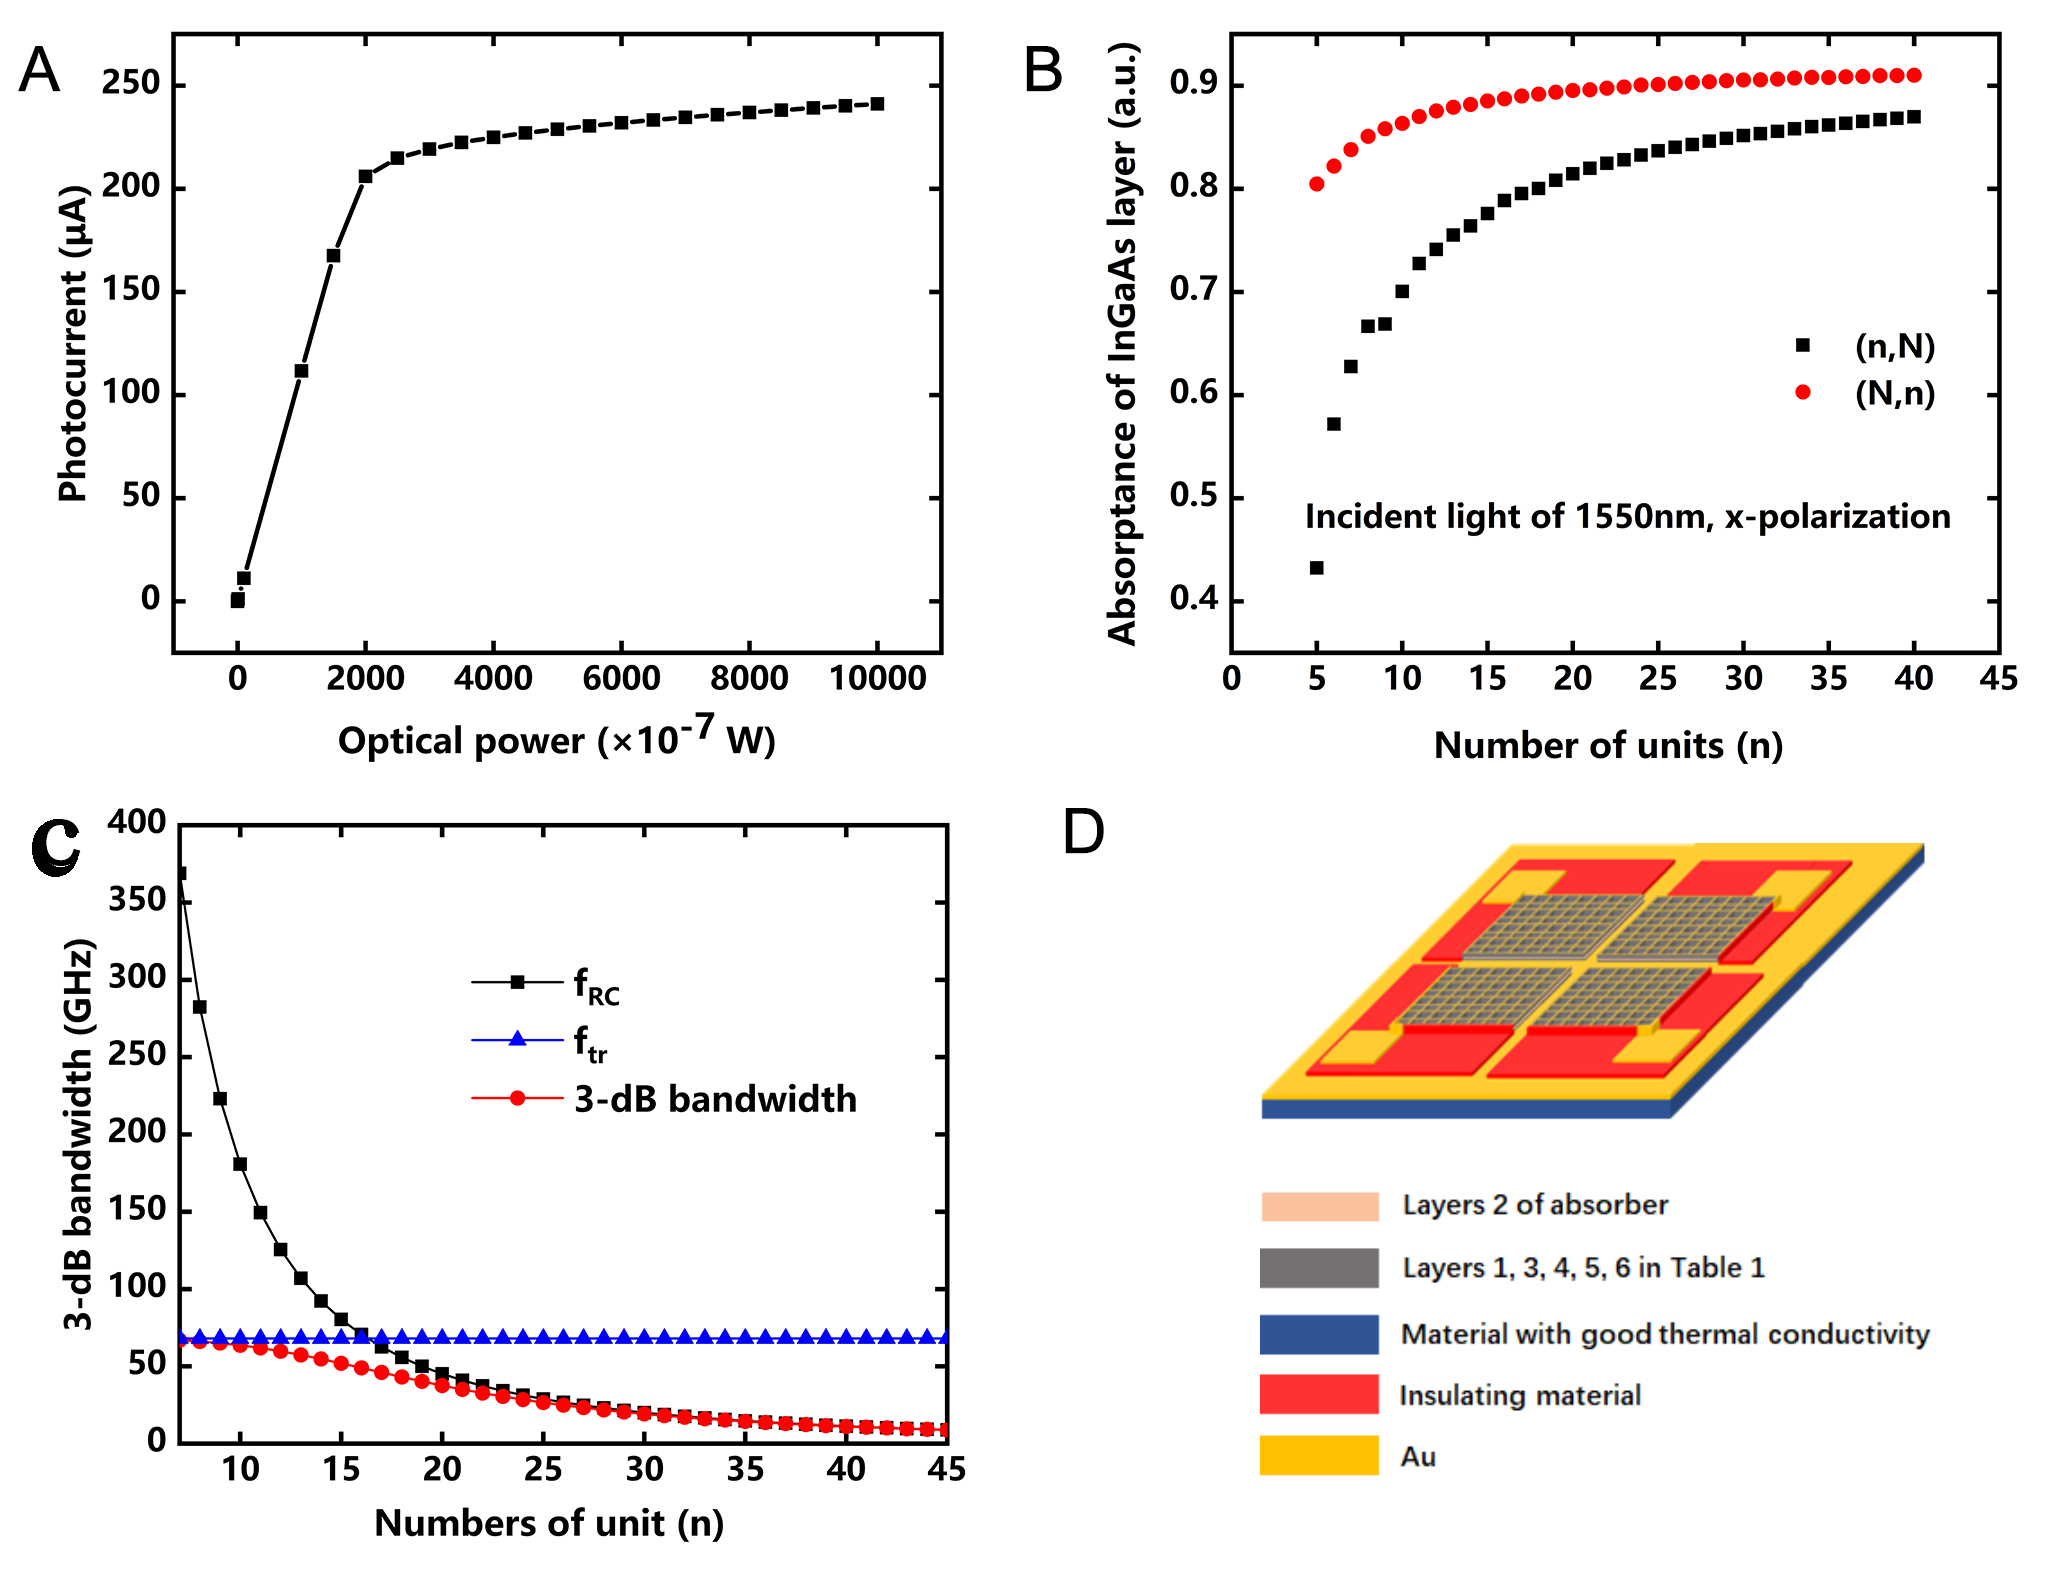
Figure 5. (A) Incident optical power versus photocurrent; (B) AInGaAs,x of grid UTC-PD at 1,550 nm x-polarized light illumination as a function of the number of units. The first and second elements in parentheses represent the number of grid units in the x- and y- directions, respectively, where n is an arbitrary value and N stands for infinity. Scattering boundary conditions are added in the dimension corresponding to n, whereas periodic boundary conditions are added in the dimension corresponding to N; (C) 3-dB-fRC (black line), 3-dB-ftr (blue line) and 3-dB-bandwidth (red line) of the grid UTC-PDs versus the number of units; (D) Schematic of a 2 × 2 PD array based on the grid structure. The period of the grid unit is 1.2 μm. When the number of grid units of one photodetector is 1,600, the area of the 2 × 2 array is 96 × 96 μm2. UTC-PD: Uni-traveling-carrier photodiode; fRC: frequency of resistor-capacitor bandwidth; ftr: frequency of carrier transit time bandwidth.
The number of grid units is an important factor affecting the optical and high-speed performance. In Figure 5B, the first and second elements in parentheses represent the number of grid units in the x- and y- directions, respectively, where n is an arbitrary value and N stands for infinity. In the simulation model, scattering boundary conditions are added in the dimension corresponding to n, whereas periodic boundary conditions are added in the dimension corresponding to N. According to Figure 5B, under x-polarized incident light at 1,550 nm, the number of grid units in the x-direction significantly affects the optical performance; as the unit number in x-direction rises from 5 to 40, the absorption increases from 43.2% to 86.9%. Meanwhile, the unit number in y-direction does not have a very large effect on the absorption performance, which is already 80.5% at an n value (y-direction) of 5, and subsequently saturates and is close to the desired value of 92.7%. The grid UTC-PD is predicted to achieve optical absorption of more than 80% at 1,550 nm when the grid array size reaches 40 × 40.
Figure 5C illustrates the 3-dB bandwidth of the grid UTC-PD versus the number of grid units. With a dc of 0.7 for air, the junction area of the grid structure is 0.51 times that of the mesa structure, which means that the RC bandwidth could be doubled. As shown in Figure 5C, when the value of n is small, the bandwidth of the grid UTC-PDs is mainly dominated by the carrier transition time. As the number of units increases, the RC-time gradually dominates. When the value of n is 40, the grid UTC-PDs with a size of 48 × 48 μm2 exhibit a 3-dB-bandwidth of 11.1 GHz.
A 2 × 2 PD array is designed based on the grid UTC-PD shown in Figure 5D. Each detector consists of 1,600 grid units and the total size of the array is 96 × 96 μm2. The four detectors share a common bottom electrode, and the top electrode leads out separately. Because there are no complex metal alignments that lead to parasitic effects to reduce the bandwidth, the high-speed performance of the array depends on the individual detectors and is expected to be 11.1 GHz.
Table 2 compares the performance of the grid UTC-PD in this work with that reported in previous studies[28,29]. In addition to presenting the results of the original literature, we resimulated the structure using the model in this paper and obtained consistent results. The grid UTC-PD exhibited an ultrahigh responsivity performance and a good 3-dB-fRC performance. Given that the grid UTC-PD has a junction area duty cycle of about 50%, the specific junction capacitance was only 0.12 fF/μm2 (normalized by the device’s optical detection area) and 3-dB-fRC was 26.08 THz·μm2 calculated by formula (6). This means that when the bandwidth metric is fixed, the grid device could have a larger optical receiving area.
| [28] | [29] | This paper | |||
| Literature results | Re-simulation | Literature results | Re-simulation | ||
| Capacitance | 0.3 fF/μm2 | 0.3 fF/μm2 | / | 0.36 fF/μm2 | 0.12 fF/μm2 |
| 3-dB-fRC | 10.6 THz·μm2 | 10.6 THz·μm2 | / | 8.84 THz·μm2 | 26.08 THz·μm2 |
| 3-dB-ftr | 125 GHz | 118 GHz | 70 GHz | 66 GHz | 68 GHz |
| Responsivity | 0.19 A/W | 0.182 A/W | 0.17 A/W | 0.164 A/W | 1.12 A/W |
CONCLUSION
We designed a grid UTC-PD working at 1,550 nm. By forming a metasurface microcavity structure within the functional layer of the detector, the incident power was confined inside the device, resulting in enhanced field localization. The grid UTC-PD exhibits a remarkable absorption efficiency of 92.7% with a thin absorption layer of 200 nm - 5.65 times higher than that of traditional mesa structures with the same epitaxial layers. Because of the small duty cycle, the 3-dB-fRC was 26.08 THz·µm2 under -4 V bias, two times that of traditional mesa structures. Based on the grid structure, a 2 × 2 PD array was designed to achieve a high-speed performance of 11.1 GHz with a large area of about 96 × 96 μm2 and a high absorption efficiency of over 80% at 1,550 nm. Thus, active-region metasurface reconstruction of InGaAs PDs is a promising design concept that can alleviate the inherent trade-off among detection area, responsivity, and bandwidth performance.
DECLARATIONS
Authors’ contributions
Supervised the project: Xu, Y.; Chen, H.
Formal analysis: Shao, H.; Cheng, B.; Lv, L.
Investigation: Shao, H.
Methodology: Shao, H.; Cheng, B.
Data curation: Lv, L.
Software, Writing - original draft: Xu, Y.
Writing - review & editing: Chen, H.
Availability of data and materials
The data that support the findings of this study are available from the corresponding author upon reasonable request.
AI and AI-assisted tools statement
Not applicable.
Financial support and sponsorship
This work was supported by the National Natural Science Foundation of China (Grant Nos. 62434001, 12075244, and 61835011).
Conflicts of interest
All authors declared that there are no conflicts of interest.
Ethical approval and consent to participate
Not applicable.
Consent for publication
Not applicable.
Copyright
© The Author(s) 2026.
REFERENCES
1. Alkhazragi, O.; Trichili, A.; Kang, C. H.; et al. Toward wide-field-of-view and large area optical detectors for high-speed optical wireless communication. IEEE. Commun. Mag. 2023, 61, 162-7.
2. Yamada, Y.; Hiraoka, I.; Maeda, Y.; Kosuga, S.; Nakamura, T.; Nakajima, F. High-speed vertical-illumination photodiode for beyond-200-gbaud applications. NTT. Technical. Review. 2026, 24, 47-54.
3. Umezawa, T.; Kusakata, K.; Kanno, A.; Matsumoto, A.; Yamamoto, N.; Kawanishi, T. Large active area, high-speed photoreceiver for optical wireless communications. In 2018 International Topical Meeting on Microwave Photonics (MWP), Toulouse, France, October 22-25, 2018; IEEE, 2018; pp 1-4.
4. Sarbazi, E.; Kazemi, H.; Crisp, M.; et al. Design and optimisation of high-speed receivers for 6G optical wireless networks. arXiv 2022, arXiv:2212.14830.
5. Srinivasan, M.; Song, J.; Grabowski, A.; et al. End-to-end learning for VCSEL-based optical interconnects: state-of-the-art, challenges, and opportunities. J. Lightwave. Technol. 2023, 41, 3261-77.
6. Bashir, M. S.; Zeeshan, Ahmed. Q.; Alouini, M. Optimal photodetector size for high-speed free-space optics receivers. IEEE. Trans. Wireless. Commun. 2024, 23, 16390-403.
7. Umezawa, T.; Dat, P. T.; Kanno, A.; Yamamoto, N. Fiber wireless and optical wireless communications using high-speed photonic devices. In 2020 International Conference on Advanced Technologies for Communications (ATC), Nha Trang, Vietnam, October 8-10, 2020; IEEE, 2020; pp 1-4.
8. Milovančev, D.; Jukić, T.; Steindl, B.; Brandl, P.; Zimmermann, H. Optical wireless communication using a fully integrated 400 µm diameter APD receiver. J. Eng. 2017, 2017, 506-11.
9. Weng, Z. K.; Yoshida, Y.; Umezawa, T.; et al. High-mobility 40-Gbps free-space optical link by a three-stage high-speed beam stabilizer and 2-D photodetector array based diversity reception. Opt. Express. 2025, 33, 16820-32.
10. Umezawa, T.; Matsumoto, A.; Akahane, K.; Nakajima, S.; Yamamoto, N. Large submillimeter high-speed photodetector for large aperture FSO receiver. IEEE. J. Select. Topics. Quantum. Electron. 2022, 28, 1-9.
11. Umezawa, T.; Matsumoto, A.; Akahane, K.; Kanno, A.; Yamamoto, N. 400-pixel high-speed photodetector for high optical alignment robustness FSO receiver. In Optical Fiber Communication Conference 2022, San Diego, California USA, March 6-10, 2022; Optica Publishing Group, 2022; pp 1-3.
12. Palaferri, D.; Todorov, Y.; Bigioli, A.; et al. Room-temperature nine-µm-wavelength photodetectors and GHz-frequency heterodyne receivers. Nature 2018, 556, 85-8.
13. Hakl, M.; Lin, Q.; Lepillet, S.; et al. Ultrafast quantum-well photodetectors operating at 10 μm with a flat frequency response up to 70 GHz at room temperature. ACS. Photonics. 2021, 8, 464-71.
14. Shao, H.; Cheng, B.; Xu, Y.; Song, G. Ultrahigh-quantum-efficiency and high-bandwidth nanowire array UTC-PDs working at 1064 nm. Opt. Quant. Electron. 2022, 54, 3293.
15. Schneider, H.; Fleissner, J.; Rehm, R.; et al. High-resolution QWIP FPAs for the 8- to 12-µm and 3- to 5-µm regimes. In Infrared Technology and Applications XXVIII, Seattle, Washington, USA, July 7-11, 2023; SPIE, 2003; pp 297-305.
16. Rabczuk, T.; Ren, H.; Zhuang, X. A nonlocal operator method for partial differential equations with application to electromagnetic waveguide problem. Comput. Mater. Contin. 2019, 59, 31-55.
17. Samaniego, E.; Anitescu, C.; Goswami, S.; et al. An energy approach to the solution of partial differential equations in computational mechanics via machine learning: concepts, implementation and applications. Comput. Methods. Appl. Mech. Eng. 2020, 362, 112790.
18. Beling, A.; Xie, X.; Campbell, J. C. High-power, high-linearity photodiodes. Optica 2016, 3, 328.
19. Xie, X.; Zhou, Q.; Li, K.; et al. Improved power conversion efficiency in high-performance photodiodes by flip-chip bonding on diamond. Optica 2014, 1, 429.
20. Li, Q.; Li, K.; Fu, Y.; et al. High-power flip-chip bonded photodiode with 110 GHz bandwidth. J. Lightwave. Technol. 2016, 34, 2139-44.
21. Zhou, Q.; Cross, A. S.; Fu, Y.; Beling, A.; Campbell, J. Development of narrowband modified uni-travelling-carrier photodiodes with high power efficiency. In 2013 IEEE Avionics, Fiber-Optics and Photonics Technology Conference (AVFOP), San Diego, CA, USA, October 1-3, 2013; IEEE, 2013; pp 65-6.
22. Boroumand, J.; Das, S.; Vázquez-Guardado, A.; Franklin, D.; Chanda, D. Unified electromagnetic-electronic design of light trapping silicon solar cells. Sci. Rep. 2016, 6, 31013.
23. Xie, Z.; Chen, Y.; Zhang, N.; Chen, B. InGaAsP/InP uni-traveling-carrier photodiode at 1064-nm wavelength. IEEE. Photon. Technol. Lett. 2019, 31, 1331-4.
24. Peng, Y.; Zang, J.; Sun, K.; Yang, Z.; Campbell, J. C. High-speed and high-power MUTC photodiode working at 1064 nm. IEEE. Photon. Technol. Lett. 2019, 31, 1584-7.
25. Suzuki, R.; Ozaki, K.; Tsunoda, K.; Nishino, H. ALD-Al2O3 passivation effects on surface characteristics of InAs/GaSb type-II superlattice infrared photodetectors. In Infrared Technology and Applications XLV, Baltimore, MD, USA, April 14-18, 2019; SPIE, 2019; 110020B.
26. Park, M.; Razaei, M.; Barnhart, K.; Tan, C. L.; Mohseni, H. Surface passivation and aging of InGaAs/InP heterojunction phototransistors. J. Appl. Phys. 2017, 121, 233105.
27. Braga, O.; Delfino, C.; Kawabata, R.; et al. Investigation of InGaAs/InP photodiode surface passivation using epitaxial regrowth of InP via photoluminescence and photocurrent. Mater. Sci. Semicond. Process. 2023, 154, 107200.
28. Umezawa, T.; Kanno, A.; Kashima, K.; et al. Bias-free operational UTC-PD above 110 GHz and its application to high baud rate fixed-fiber communication and W-band photonic wireless communication. J. Lightwave. Technol. 2016, 34, 3138-47.
Cite This Article
 Open Access
How to Cite
Shao, H.; Lv, L.; Cheng, B.; Xu, Y.; Chen, H. Design of metasurface uni-traveling-carrier photodetector with large area, high speed and high quantum efficiency. Microstructures 2026, 6, 20260131. https://dx.doi.org/10.20517/microstructures.2026.161
Download Citation
If you have the appropriate software installed, you can download article citation data to the citation manager of your choice. Simply select your manager software from the list below and click on download.
Export Citation File
Type of Import
Tips on Downloading Citation
Citation Manager File Format
Type of Import
Direct Import: When the Direct Import option is selected (the default state), a dialogue box will give you the option to Save or Open the downloaded citation data. Choosing Open will either launch your citation manager or give you a choice of applications with which to use the metadata. The Save option saves the file locally for later use.
Indirect Import: When the Indirect Import option is selected, the metadata is displayed and may be copied and pasted as needed.
About This Article
Copyright

Data & Comments
Data
0











Comments
Comments must be written in English. Spam, offensive content, impersonation, and private information will not be permitted. If any comment is reported and identified as inappropriate content by OAE staff, the comment will be removed without notice. If you have any queries or need any help, please contact us at [email protected].