

fig4
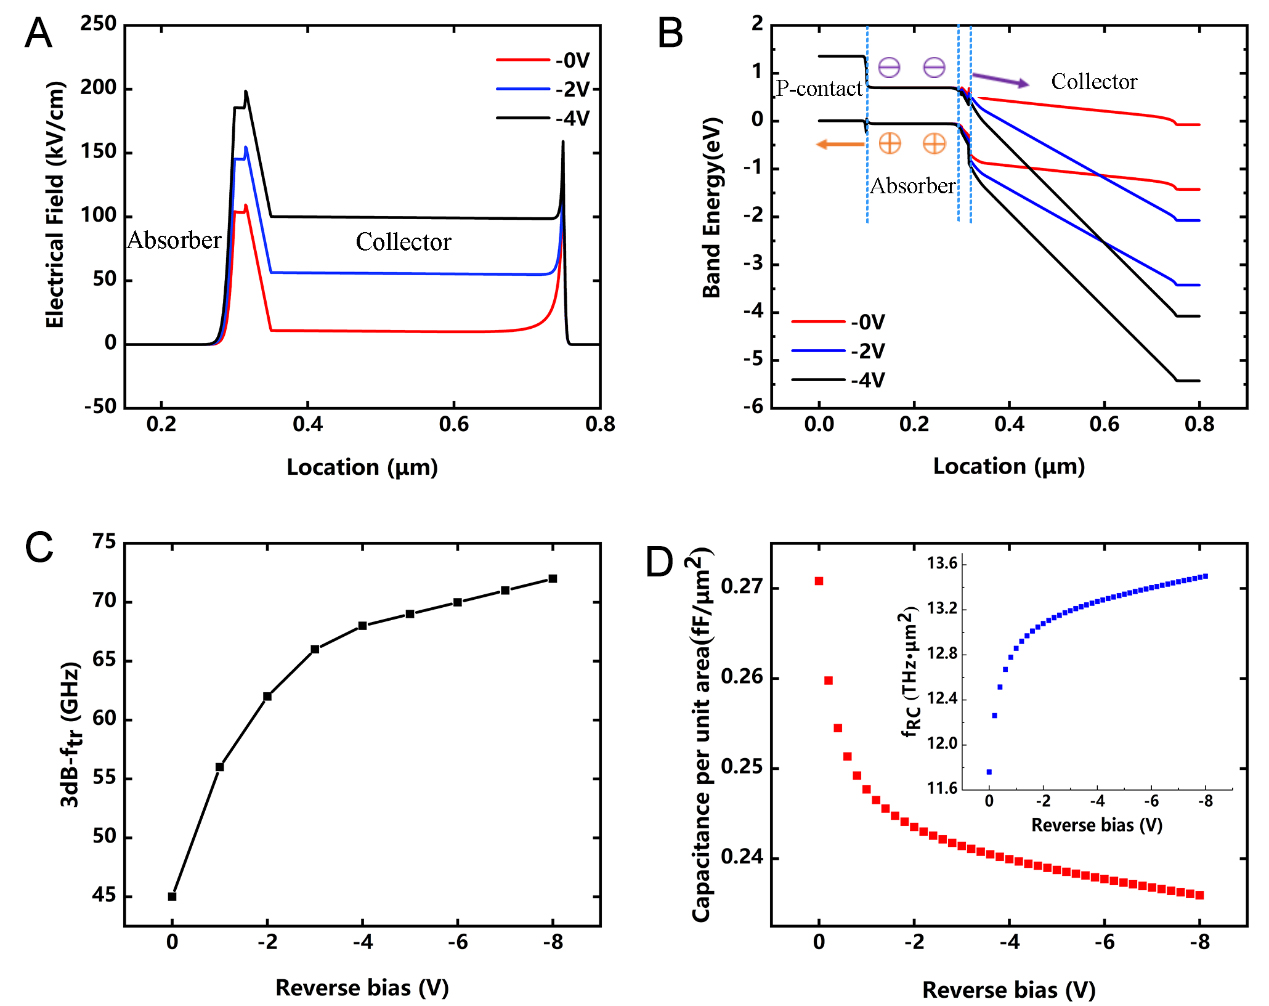
Figure 4. (A) Electric field distribution and (B) energy-band diagram for 0-, 2-, and 4-V reverse bias; (C) 3-dB-ftr vs. reverse bias; (D) Capacitance per unit device junction area vs. reverse bias. The accompanying figure shows the 3-dB-fRC calculated using formula 6. fRC: frequency of resistor-capacitor bandwidth; ftr: frequency of carrier transit time bandwidth.