

Subsurface Ni nanolayers from selective Mn surface oxidation and diffusion in NiMn alloys
 0
Graphical Abstract
Abstract
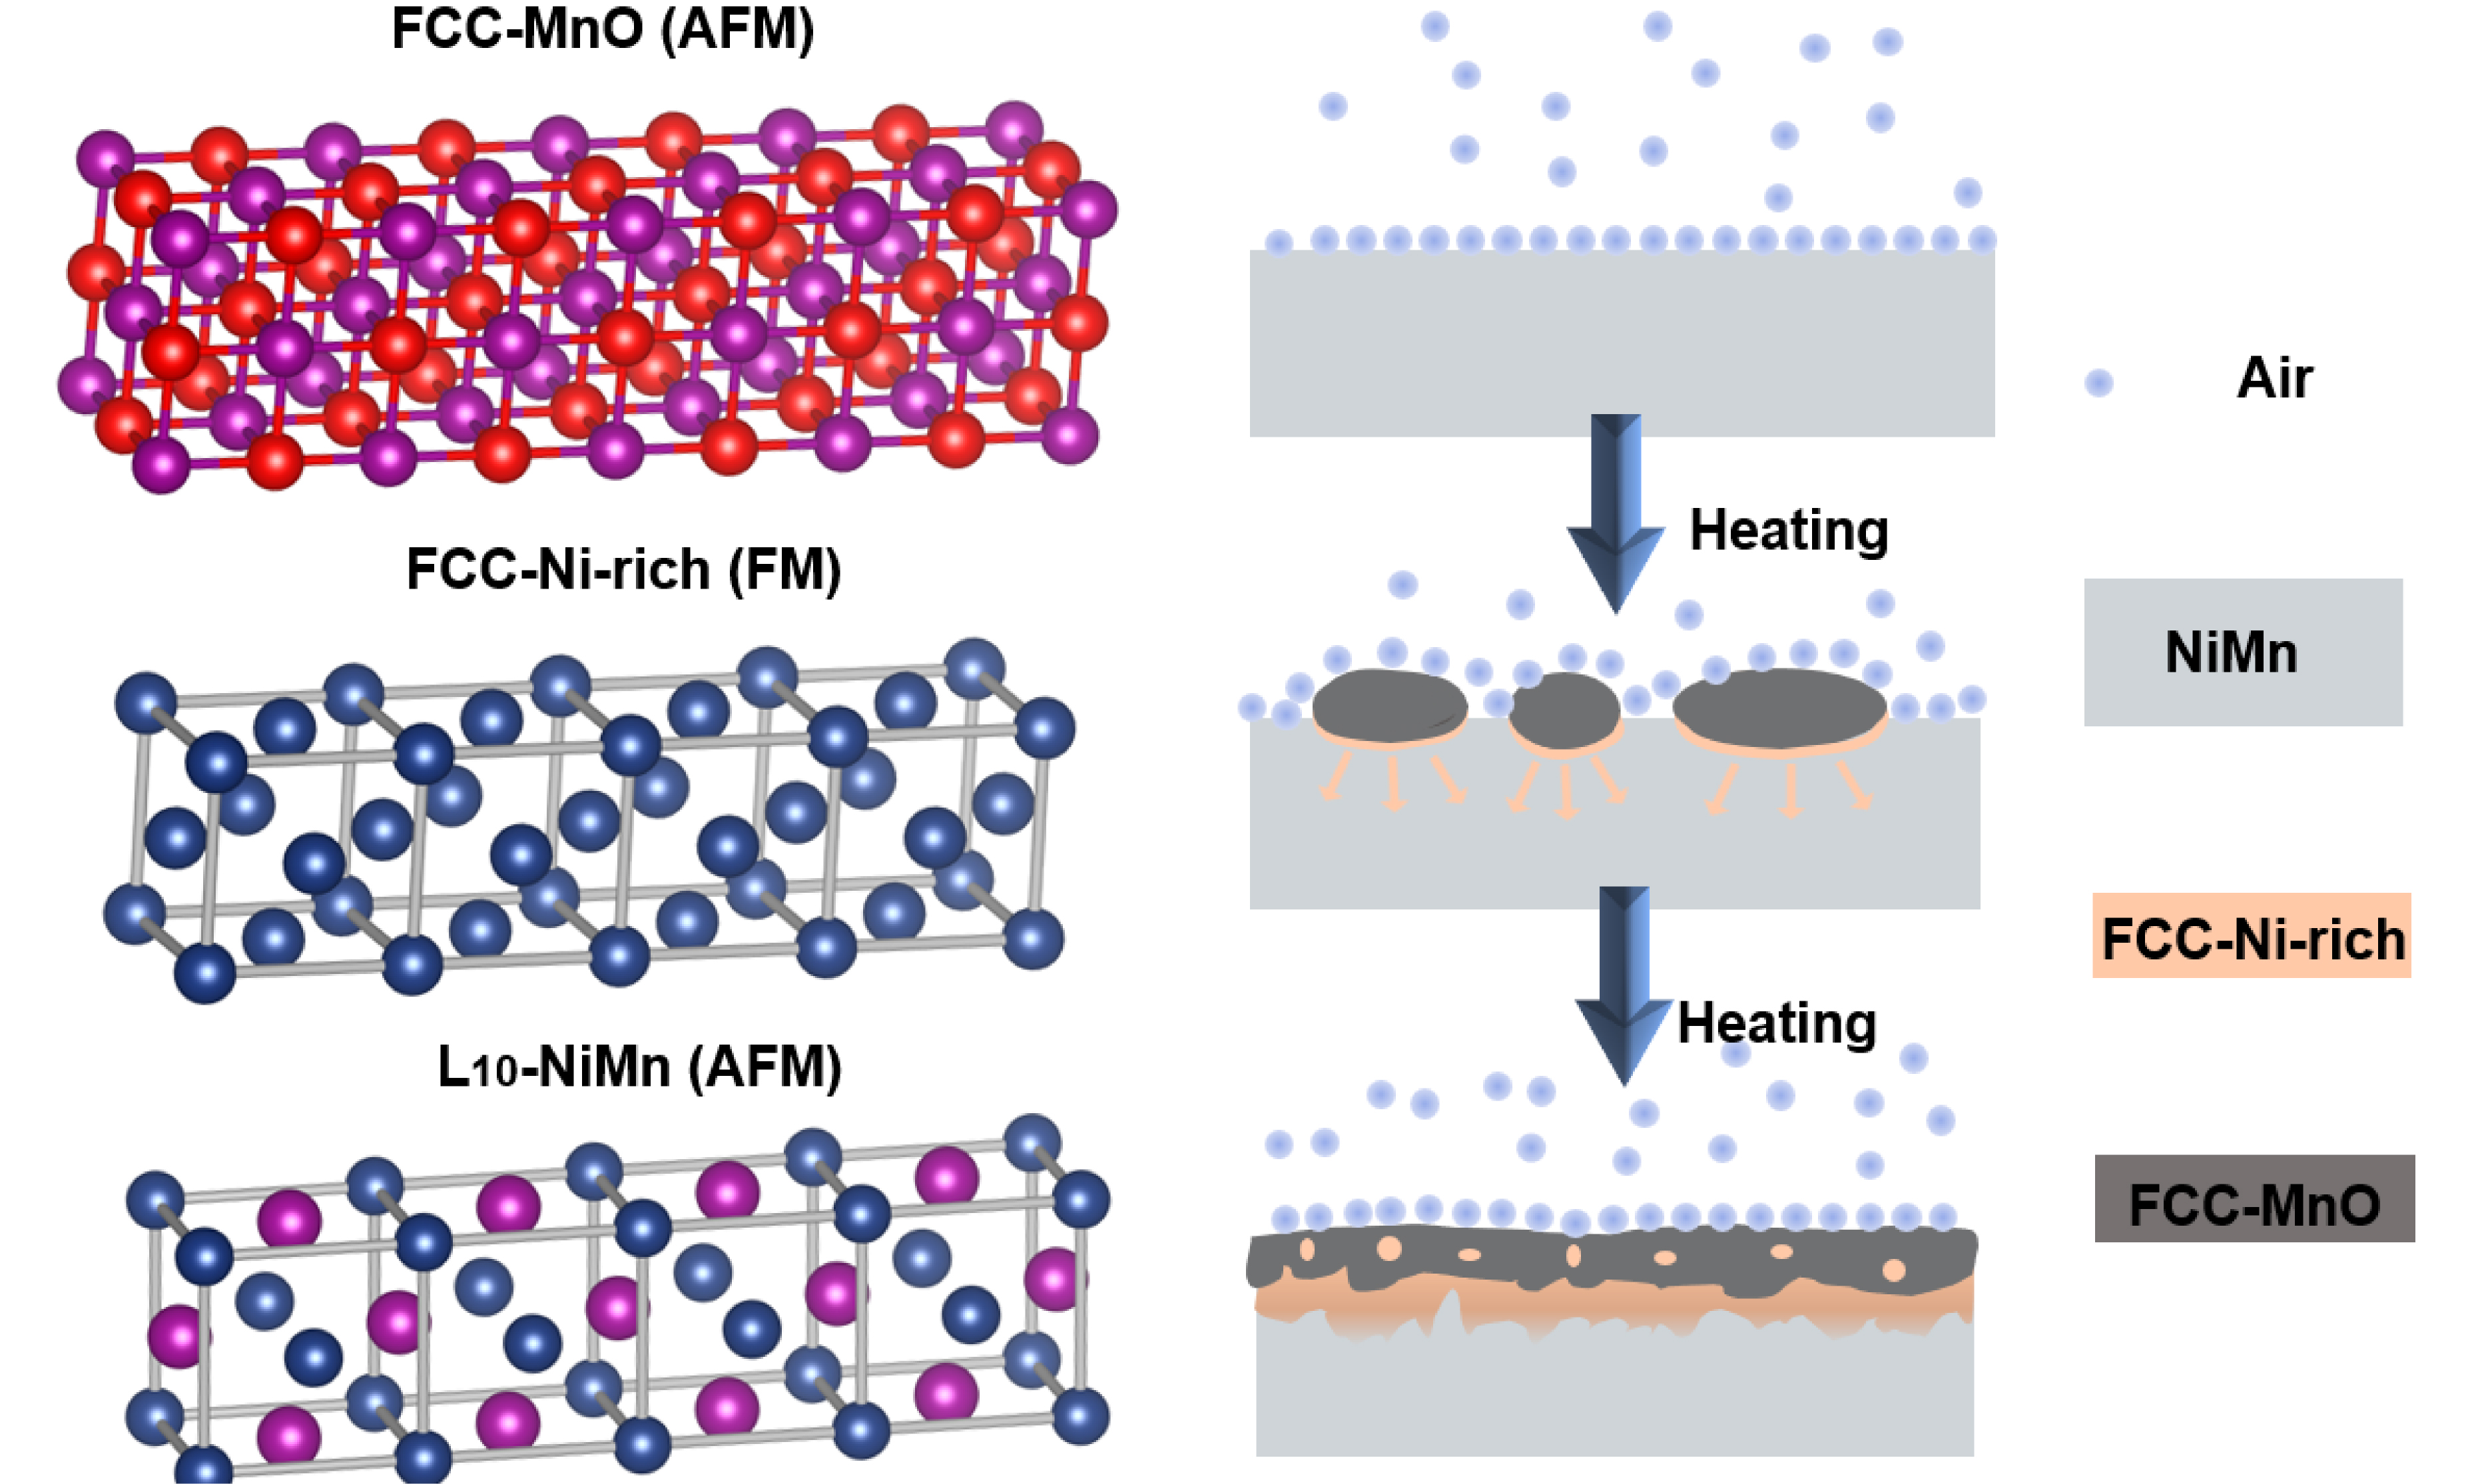
We demonstrate by spatially resolved chemical and structural analysis in transmission electron microscopy that the selective oxidation of Ni-Mn alloys produces a distinct MnO/Ni-rich/NiMn trilayer structure, in which the Ni-rich layer contains locally pure Ni regions and a compositionally graded transition region toward the NiMn substrate. Off-axis electron holography directly visualizes magnetic induction in the subsurface Ni-rich layer, which exhibits ferromagnetic behavior and a Curie temperature close to that of bulk Ni. These findings reveal that selective oxidation can serve as a controlled, bottom-up strategy to synthesize nanoscale ferromagnetic layers for advanced device applications.
Keywords


 Download PDF
INTRODUCTION
Selective oxidation in binary alloys with constituents of distinctly different oxygen affinities typically yields either a compositionally graded solid solution beneath the oxide scale or internal precipitation of the solute oxide[1,2]. The formation of a continuous Ni-rich metallic layer through selective oxidation has only rarely been reported in previous studies and is not fully captured by the conventional picture of a simple compositionally graded solid solution or internal oxide precipitation. Such a structure could provide new opportunities for tailoring subsurface magnetic or electronic properties. Selective oxidation and oxidation-induced elemental redistribution have been extensively investigated in high-entropy alloys, including refractory high-entropy alloys[3-6], as well as in other metallic and nanoscale systems[7-12].
Among alloy systems, NiMn is of particular interest due to its high antiferromagnetic thermal stability, high Néel temperature[13], and substantial magnetocrystalline anisotropy[14], making it widely used as a pinning layer in exchange-biased thin films[15]. Oxidation of NiMn favors the formation of MnO over NiO because of the more negative Gibbs free energy of formation of MnO[2]. Previous work has shown that MnO formation at the surface and the consequent enrichment of Ni in the subsurface region can induce a ferromagnetic response[16]. However, whether this process can produce a continuous metallic Ni-rich layer and how such a layer influences the magnetic response remain unclear. In the present work, the Ni-rich layer comprises locally pure Ni regions together with a compositionally graded Ni-rich transition region toward the NiMn substrate. Predicting subsurface composition after oxidation remains challenging, despite frameworks such as the Preferential Interactivity Parameter (PIP)[17,18].
Addressing this question requires simultaneous measurement of composition, crystal structure, and magnetic induction across the oxide-metal interface with nanometer resolution. In this work, we investigate the MnO/Ni-rich/NiMn subsurface nanostructure formed by oxidizing an off-equiatomic Ni54Mn46 alloy at 650 K. We combine controlled oxidation experiments with atomic-scale transmission electron microscopy and map nanoscale magnetic induction using off-axis electron holography (OAEH)[19,20]. By correlating the structural, chemical, and magnetic information, our results establish a direct link between oxidation-induced elemental redistribution and magnetic functionality.
EXPERIMENTAL METHODS
Sample preparation and characterization
Polycrystalline Ni54Mn46 was prepared by arc melting Ni (99.99%) and Mn (99.8%) under argon. The ingot was cut into cuboids and polished. Samples were oxidized in air at 650 K for 0, 2.8, 5.6, 8.6, 11.6, and 14.4 h. XRD (Rigaku SmartLab 3, Cu Kα, λ = 1.54278 Å) was performed from 2θ = 20° to 100° at 4°/min with a 0.01° step. Data were refined with GSAS-II[21]. X-ray photoelectron spectroscopy (XPS) depth profiling (Thermo ESCALAB 250XI+, Al Kα) was performed using an X-ray spot size of 650 μm. Alternating Ar+ sputtering and analysis cycles were used, with sputtering at 1 keV for 70 min followed by 3 keV for 320 min, and spectra were acquired every 10 min. The relative Ni and Mn fractions in the depth profile were calculated from the integrated peak areas of the Ni 2p1/2 and Mn 2p1/2 components. These components were selected to minimize interference from overlapping spectral features and Auger contributions, and the resulting fractions were normalized to the combined Ni and Mn content.
Cross-sectional transmission electron microscopy (TEM) specimens were prepared by focused ion beam (DB550). Structural and elemental distribution spectroscopic analysis used Talos F200X G2, Titan G2 ETEM, and Themis Z 3.2. Electron energy-loss spectroscopy (EELS) spectra were processed in Digital Micrograph. Backgrounds were removed by inverse power law fitting. For white-line analysis, the continuum background under the L2,3 edges was subtracted using a double arctan function[22]. The L3/L2 ratios were compared with reference standards to determine valence states.
Magnetic characterization
Magnetization was measured on a VSM (Lake Shore 7410) from 300 K to 900 K under 1,000 mT. Magnetic hysteresis loops, M(B), were measured at 326 K over a magnetic-field range of -1 to +1 T for samples oxidized at 650 K for 2.8, 5.6, 8.6, 11.6, and 14.4 h. For each oxidation duration, an additional M(B) loop was measured after polishing to compare the magnetic response before and after removal of the oxidized surface layer. For the sample oxidized at 650 K for 2.8 h, the measured total M(B) curve was fitted over the magnetic-field range from -1 to 1 T using a first-order polynomial to determine the linear background attributed to the antiferromagnetic NiMn matrix. The fitted linear background was then subtracted from the measured curve to obtain the ferromagnetic hysteretic contribution. Off-axis electron holography was performed on a Titan 60-300 TEM at 300 kV, equipped with an electrostatic biprism and a Gatan 2k CCD camera. Holograms were acquired in Lorentz mode with a biprism voltage of 140 V. To magnetically saturate the Ni-rich layer, the sample was tilted by ±21° in Lorentz mode, and a vertical magnetic field of 1 T was applied. This decomposes the vertical field into an in-plane component along the easy magnetization direction of the Ni-rich layer, thereby saturating the sample. Two holograms were then recorded with opposite magnetic phases but identical electrostatic phases. The electron-wave phase was reconstructed from the temporal phase-shifting hologram series using VU factorization[23].
Magnetic induction reconstruction
The magnetic phase was separated from the electrostatic contribution using images acquired under opposite magnetization states[24,25]:
Residual phase ramps were removed by subtracting a polynomial fit to vacuum regions[24].
Caron established a model-based methodological framework for reconstructing magnetization distributions from electron optical phase images[26]. Ye et al. subsequently quantitatively evaluated the model-based iterative reconstruction (MBIR) approach through comparison with three complementary methods for magnetization quantification[27]. Projected magnetization was reconstructed from φm(x, y) using MBIR. A binary mask defined the specimen area. The in-plane magnetization M(x, y) was discretized on a grid with pixel size a. The magnetization was updated iteratively by minimizing:
where R(M) enforces physical constraints and β controls regularization. The MBIR reconstruction gives a projected magnetization signal, which was normalized by the local specimen thickness t along the electron-beam direction, determined from EELS using the log-ratio method: t/ΛIMFP =ln(It/I0), where ΛIMFP denotes the inelastic mean free path of electrons in the material, i.e., the average distance an electron travels before undergoing an inelastic scattering event. It depends on the incident electron energy and local composition and was calculated according to the local composition of the analyzed Ni-rich region determined by EELS. The magnetic induction B was calculated from the specimen-thickness-normalized magnetization distribution M using the magnetostatic relations described in the MBIR method of Ye et al.[27]:
Here, A is the magnetic vector potential, B is the magnetic induction, M is the specimen-thickness-normalized magnetization distribution, μ0 is the vacuum permeability, r and r′ denote the observation and source position vectors, respectively, V is the magnetic volume. Values of B were evaluated within a uniformly magnetized region selected inside the Ni-rich layer. The uncertainty in the reconstructed magnetic induction was evaluated by considering three contributions: the statistical variation within the uniformly magnetized region, the sensitivity of the reconstruction to the specimen thickness and mask definition, and the uncertainty propagated from residual phase noise. The statistical variation was obtained from the standard deviation of the Gaussian-fitted B-value distribution. The effects of specimen thickness and mask definition were evaluated by repeating the reconstruction using several reasonable parameter settings and assessing the variation in the resulting mean B values. The phase-noise contribution was estimated from the residual phase-noise distribution and propagated through the reconstruction procedure. These contributions were combined assuming that they were independent to obtain the final uncertainty of the reconstructed magnetic induction.
RESULTS
XRD and XPS of the MnO surface and Ni-rich subsurface
Three XRD patterns of bulk NiMn are compared in Figure 1, the initial (as-prepared), after oxidation at 650 K for 5.6 h, and subsequently polished state. The initial pattern displays the tetragonal L10 phase of NiMn (space group P4/mmm) with a = 3.73 Å and c = 3.53 Å. No other phases are detectable in the initial state, confirming the sample is single-phase before oxidation.
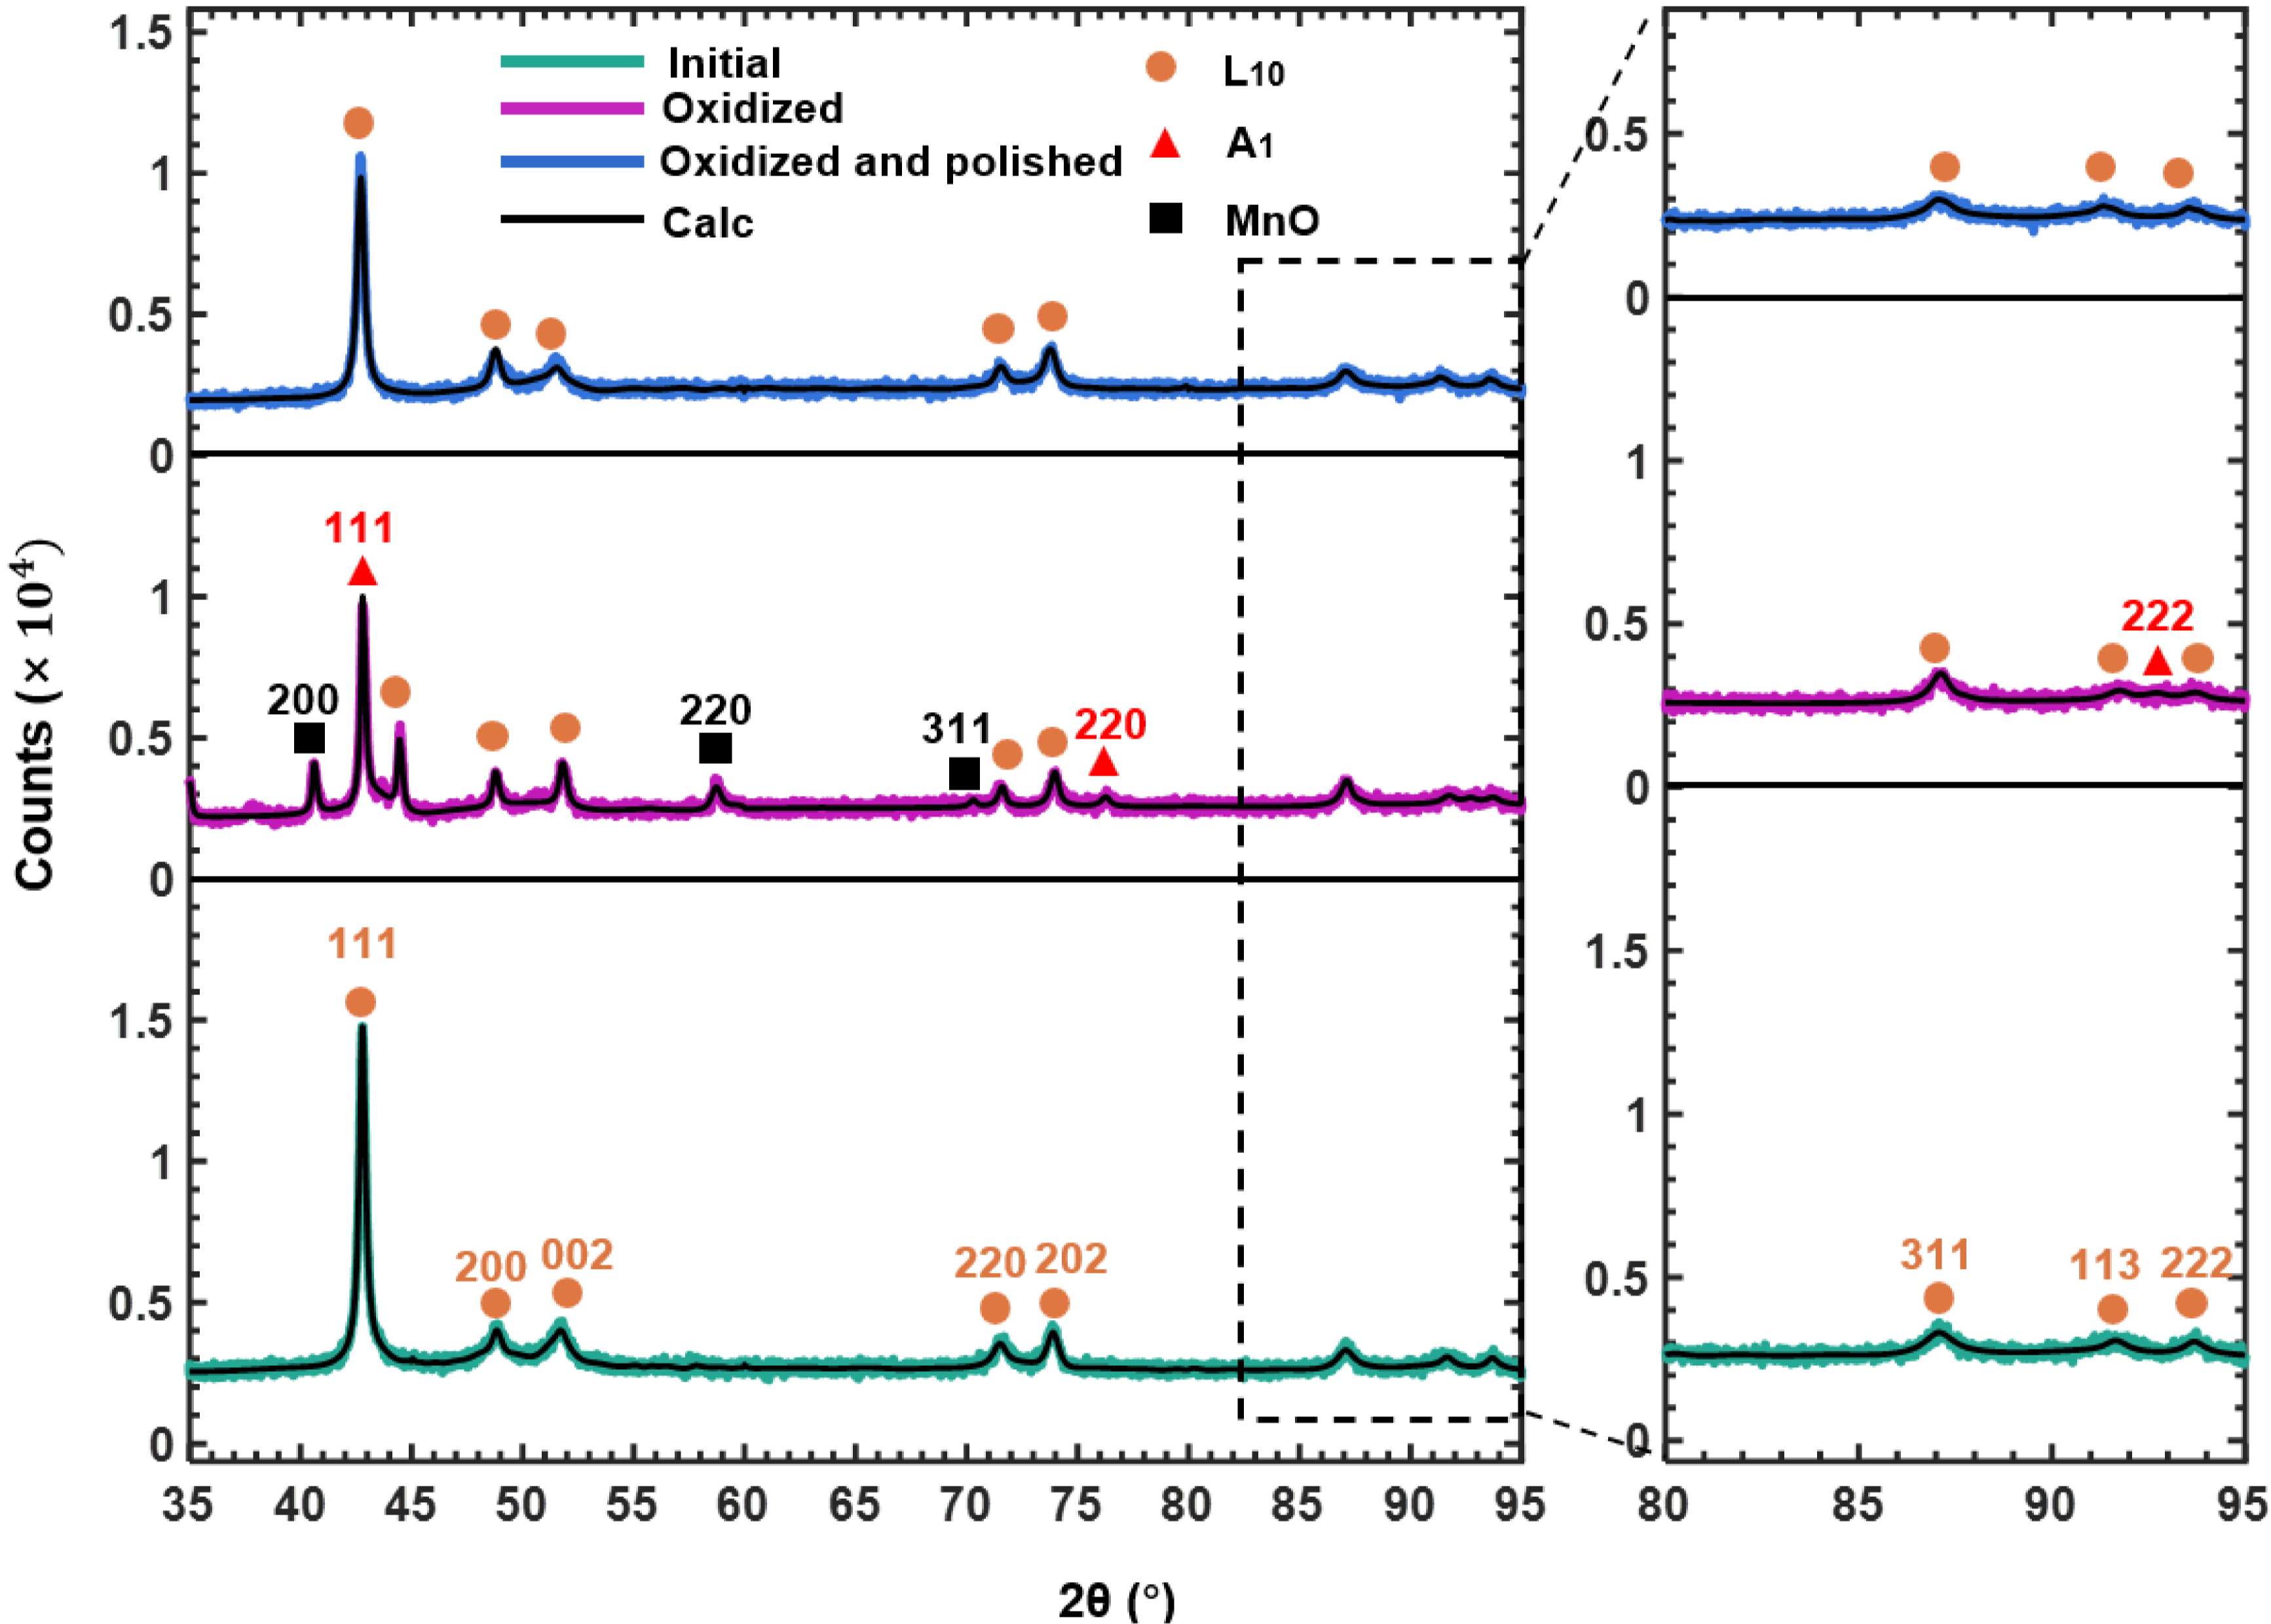
Figure 1. Room-temperature X-ray diffraction patterns of bulk NiMn samples in the initial state, after oxidation at 650 K for 5.6 h, and after subsequent polishing.
In the oxidized state, three phases exist: the L10 phase, an FCC-A1 phase (Fm
Depth-resolved XPS on the sample oxidized at 650 K for 2.8 h is shown in Figure 2. For clarity, only the 200-1,000 eV range is displayed in Figure 2A. Full spectra were acquired before sputtering and after 100 min and 390 min of sputtering [Figure 2A]. Before sputtering, only Mn, O, and C are detected (no Ni), indicating surface Mn oxidation and carbon contamination. After 100 min, carbon is absent, while Mn, O, and Ni appear, indicating that the sputtering front has reached a Ni-containing region beneath the surface Mn oxide layer. After 390 min, only Ni and Mn signals remain with almost no O, indicating that the sputtering front has reached an oxygen-depleted Ni-rich subsurface region. The 2p core-level spectra [Figure 2B] provide oxidation state information. In the initial state, no detectable Ni 2p signal is observed, consistent with a Mn oxide surface layer sufficiently thick to attenuate the Ni signal from the underlying material. After 100 min of sputtering, a Ni 2p signal becomes detectable, indicating that the sputtering front has reached the underlying Ni-containing region. After 390 min, the Ni 2p spectrum exhibits clear metallic characteristics, consistent with Ni in a metallic state within the Ni-rich subsurface region.
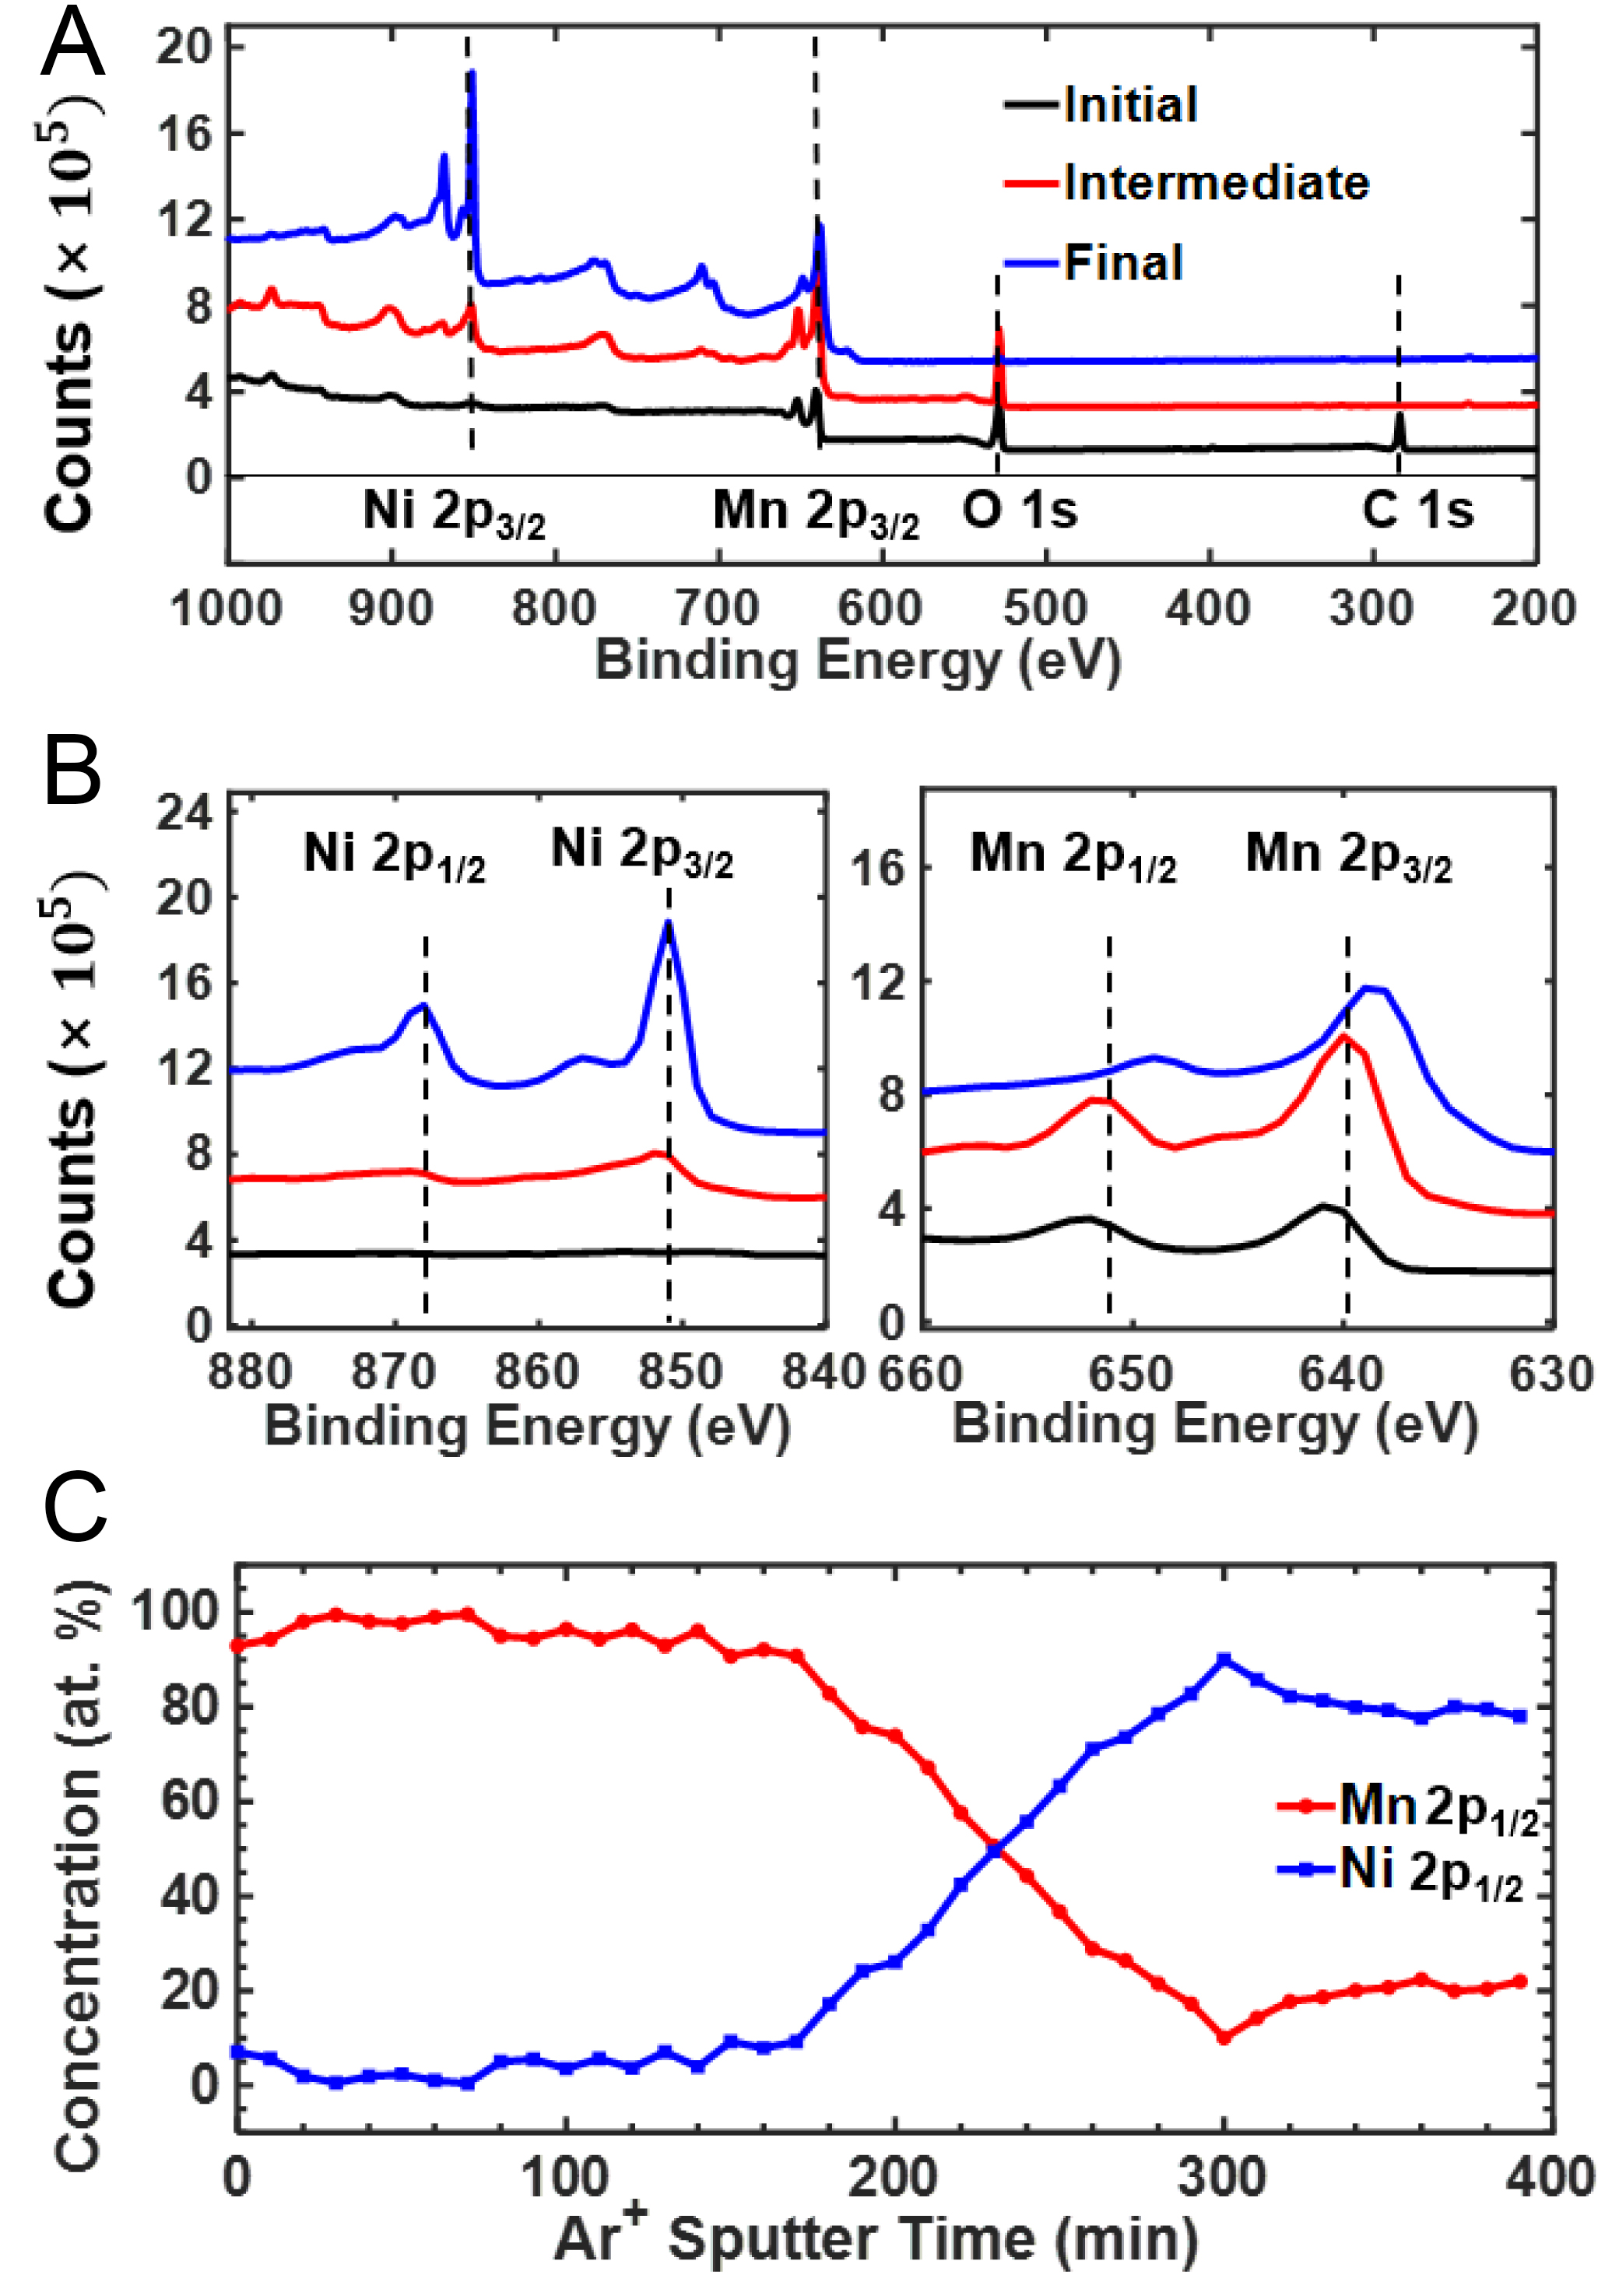
Figure 2. XPS depth profile of Ni54Mn46 oxidized for 2.8 h at 650 K. (A) Survey spectra confirming the presence of O, Ni, and Mn; (B) Ni 2p and Mn 2p core-level spectra after sequential sputtering (initial surface, intermediate, and final); (C) Relative Ni and Mn concentrations derived from the 2p1/2 components, selected to minimize interference from overlapping spectral features and Auger contributions. XPS: X-ray photoelectron spectroscopy.
For Mn, the 2p intensity increases after sputtering without an obvious energy shift in the intermediate state, indicating that Mn remains predominantly oxidized after 100 min. After prolonged sputtering, the Mn 2p binding energy decreases by approximately 3 eV, indicating the transition from oxidized Mn toward metallic Mn.
The semi-quantitative evolution of the relative Ni/Mn fractions in Figure 2C further illustrates the redistribution of Ni and Mn with sputtering depth. The Ni and Mn contents shown here are relative atomic fractions normalized to the combined Ni and Mn content, with O excluded from the normalization. This treatment was adopted because Ar+ sputtering was performed over a rectangular area, whereas the oxide/Ni-rich layered structure is morphologically nonuniform, with irregular interfaces and local pores. Consequently, the O signal obtained during sputter depth profiling cannot be quantitatively and unambiguously assigned to the Ni-rich layer itself. From 0 to 140 min, the relative Ni fraction is very low, consistent with a Mn-rich surface oxide region. From 150 to 300 min, the relative Ni fraction increases to approximately 90 at.% of the combined Ni and Mn content, indicating the presence of a strongly Ni-rich subsurface region. With further sputtering, the relative Ni fraction shows only minor fluctuations and remains high. At 390 min, the sputtering front is approaching the NiMn substrate but remains within the Ni-rich region.
Together, the XRD and XPS results establish a layered structure, specifically a surface MnO scale, an underlying Ni-rich metallic layer, and then the NiMn substrate. The Ni-rich region exhibits an FCC A1 structure rather than the tetragonal L10 structure of the bulk, indicating that Mn depletion is accompanied by a structural transformation.
Magnetic response of subsurface Ni-rich nanolayers
To probe the effect of surface oxidation on the magnetic properties, M(B) measurements were performed at 326 K for samples oxidized at 650 K for different durations and for the corresponding polished states. A hysteresis loop appears upon oxidation. With increasing oxidation time, the magnitude of the high-field magnetization increases [Figure 3A]. Figure 3B shows the linear M(B) response characteristic of an antiferromagnet with no net moment after polishing. Thus, the magnetic signal in the oxidized state primarily originates from the near-surface Ni-rich region rather than from the bulk NiMn matrix. Subtracting the linear antiferromagnetic response from the total M(B) curve yields the surface contribution Mhyst [Figure 3C]. The shape of Mhyst, a narrow hysteresis loop with low coercivity, is typical for a soft ferromagnet like Ni.
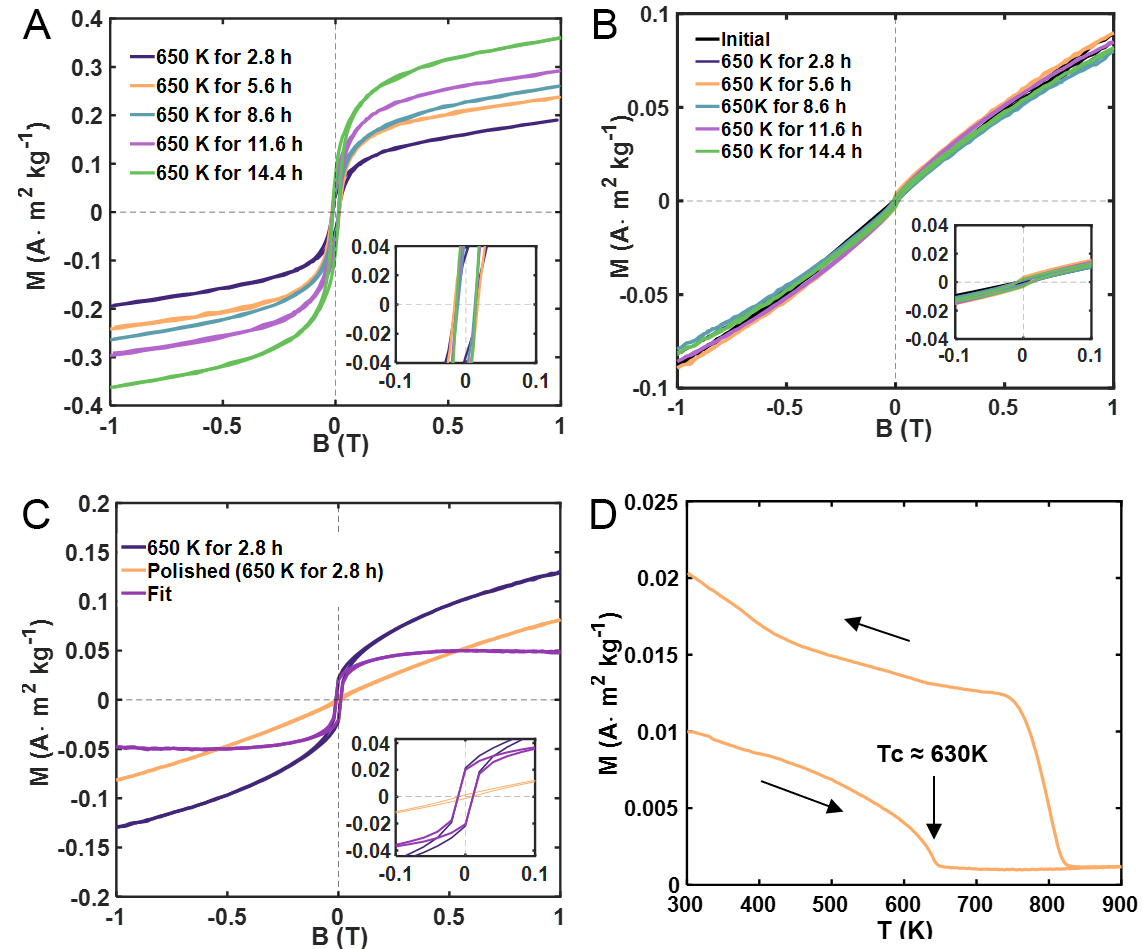
Figure 3. Magnetic hysteresis of Ni54Mn46 after oxidation. (A) M(B) loops measured at 326 K for samples oxidized at 650 K for different durations; (B) M(B) loops measured after mechanical polishing; (C) Comparison of the M(B) loop of the sample oxidized at 650 K for 2.8 h, the corresponding polished state, and the background-subtracted ferromagnetic contribution; (D) Temperature-dependent magnetization measured from 300 to 900 K under 1,000 mT.
Temperature-dependent magnetization measurements using a vibrating sample magnetometer (VSM) upon heating give a Curie temperature Tc = (630 ± 4) K, close to that of bulk Ni (631 K[28]) within experimental uncertainty, as shown in Figure 3D. Separately, upon cooling after heating to 900 K, a sharp magnetization onset is observed at approximately 830 K. This phenomenon of a significant increase in Curie temperature after annealing (tempering) is prominently observed in Ni-Mn alloys, particularly those with a composition close to Ni3Mn. This is caused by an ordering of Ni-Mn into L12 Ni3Mn during annealing[29]. This proves the presence of a compositional gradient from almost locally pure Ni to stoichiometric NiMn crossing Ni3Mn in the subsurface region after subsequent annealing. At the same time, the ferromagnetic contribution associated with the Ni-rich layer is substantially reduced. The results point to the formation of a Ni-rich layer containing locally pure Ni regions during initial oxidation, enabled by the mechanism that oxidation removes the Mn quicker than it can be compensated by diffusion from the bulk, and the creation of a compositional gradient by subsequent annealing. The absence of such hysteresis in the polished sample confirms that this behavior is tied to the near-surface composition gradient created by selective oxidation.
Atomic-scale TEM imaging of the MnO/Ni-rich/NiMn interfacial structure
Cross-sectional scanning transmission electron microscopy (STEM) of the Ni54Mn46 alloy oxidized at 650 K for 2.8 h [Figure 4A] reveals three Z-contrast regions: the bulk alloy, the Ni-rich layer, and the Mn oxide layer. The Z-contrast varies monotonically with atomic number: the Mn oxide (lowest average Z) appears darkest, the NiMn matrix (intermediate Z) appears gray, and the Ni-rich layer (highest Z) appears brightest. This contrast inversion relative to the bulk confirms that the bright layer is indeed Ni-rich. Energy-dispersive X-ray spectroscopy (EDS) mapping [Figure 4B] directly reveals the corresponding elemental distributions. The line scan [Figure 4C] along the marked path shows depletion of O and Mn accompanied by a relatively enhanced Ni signal in the Ni-rich region. Regions with relatively enhanced Ni intensity can be identified in the EDS line scan.
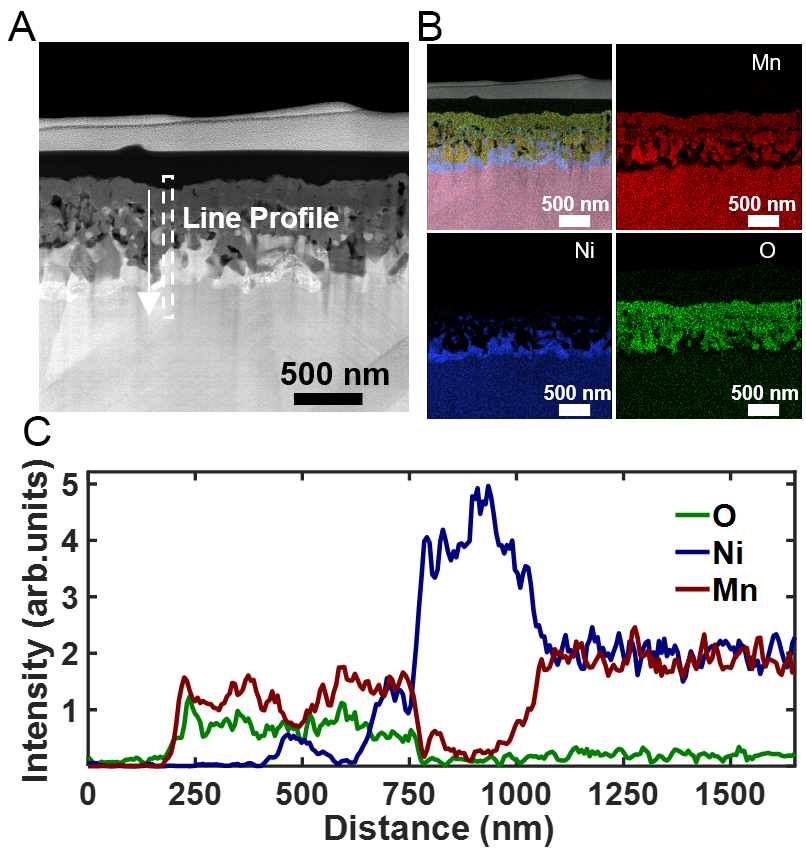
Figure 4. Cross-sectional STEM/EDS analysis of the oxidized Ni54Mn46 surface (650 K, 2.8 h). (A) HAADF image showing a tri-layer structure consisting of the surface oxide, Ni-rich intermediate layer, and NiMn substrate; (B) EDS elemental maps showing Mn enrichment in the surface oxide and relative Ni enrichment in the subsurface region; (C) EDS line-scan intensity profiles along the white dashed line in (A). STEM: Scanning transmission electron microscopy; EDS: energy-dispersive X-ray spectroscopy; HAADF: high-angle annular dark-field.
Scanning transmission electron microscopy (STEM) imaging [Figure 5A] locates the EELS measurement positions. The MnO/Ni-rich interface appears as a relatively sharp boundary, whereas the Ni-rich region toward the NiMn substrate exhibits a compositional transition, as revealed by the EELS analysis below. EELS spectra of O-K, Mn-L2,3, and Ni-L2,3 edges appear in Figure 5B-D. In the MnO region, the O-K edge has four peaks at 535.0, 540.1, 546.7, and 559.0 eV, consistent with MnO[30]. The Mn-L2,3 white lines at 642.4 eV (L3) and 653.8 eV (L2) match Mn2+. The measured L3 peak positions [Table 1] are 642.4 ± 0.3 eV for Mn and 856.6 ± 0.3 eV for Ni. No systematic shift of the Mn-L3 or Ni-L3 peak position is resolvable within the experimental energy resolution. The vertical dashed lines in Figure 5C and D indicate the corresponding L3 and L2 peak positions. The variation in the Mn L3/L2 white-line intensity ratio, together with the quantitative atomic ratios in Table 1, indicates that Mn evolves from the +2 oxidation state in MnO toward a metallic state in the NiMn substrate, while Ni remains predominantly zero-valent. These trends are consistent with previous EELS studies[30,31]. Positions 3-10 constitute the Ni-rich layer, which extends over a width of approximately 220 nm along the EELS line profile. Positions 3-6 contain 100 at.% Ni according to the EELS quantification, indicating a locally pure metallic Ni region with a width of approximately 80 nm. Positions 7 and 8 contain only trace amounts of Mn, whereas the Mn content progressively increases at positions 9 and 10, forming a compositional transition toward the NiMn substrate. Position 11 approaches the NiMn substrate composition.
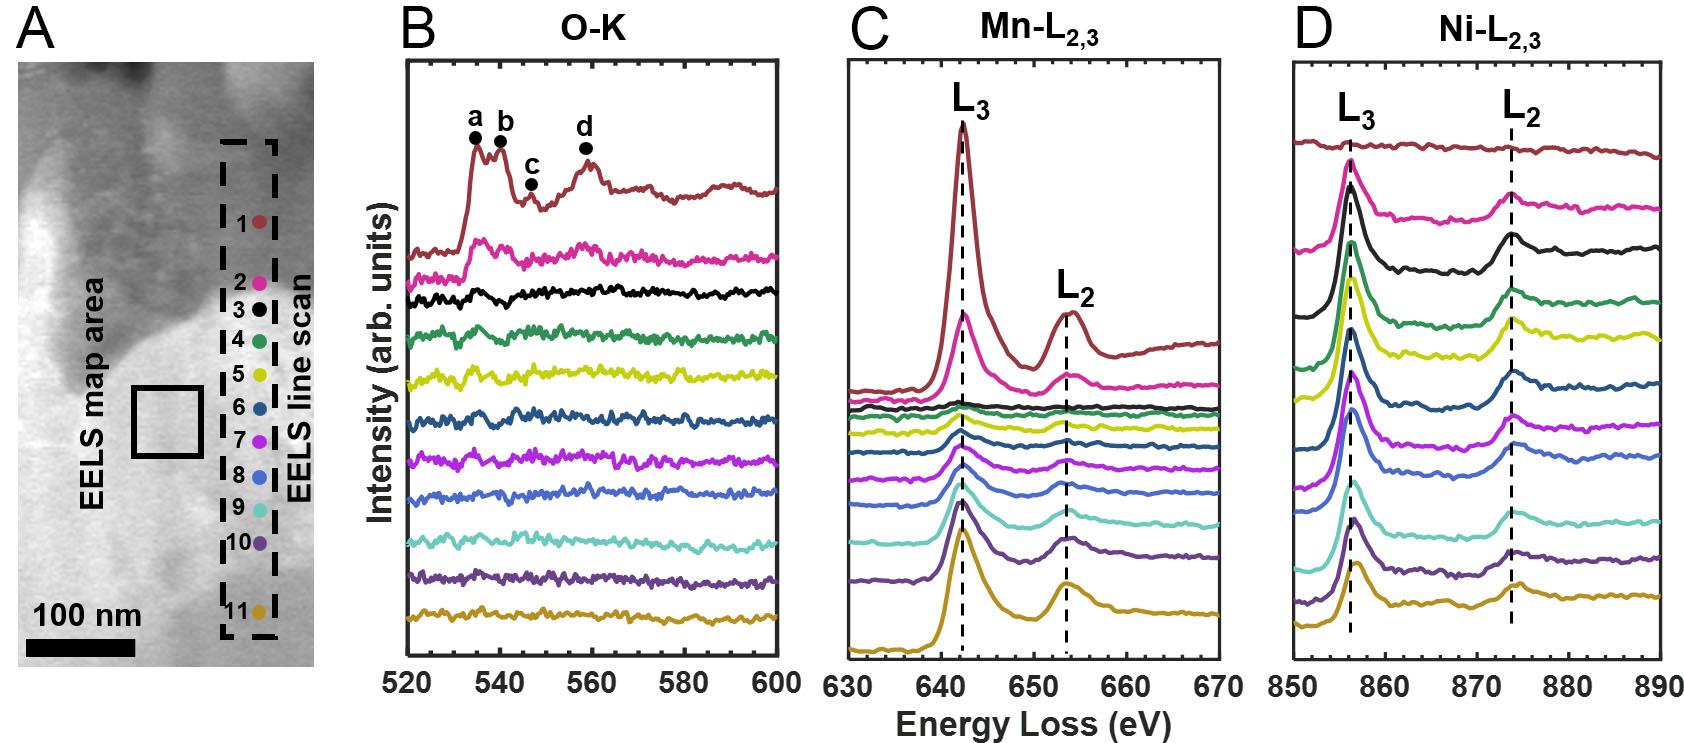
Figure 5. (A) STEM image of the oxidized cross-section showing the EELS acquisition positions; (B-D) EELS spectra of the O-K, Mn-L2,3, and Ni-L2,3 edges obtained from the color-coded positions in (A). STEM: Scanning transmission electron microscopy; EELS: electron energy-loss spectroscopy
EELS analysis results for different regions
| Region | Mn-L3 (eV) | Ni-L3 (eV) | Mn (L3/L2) | Ni (L3/L2) | Mn (at.%) | Ni (at.%) | O (at.%) |
| 1 | 642.4 | - | 3.98 | - | 45.00(4.00) | - | 55.00(4.00) |
| 2 | 642.7 | 856.3 | 4.01 | 2.32 | 23.00(2.00) | 47.40(3.00) | 29.60(1.90) |
| 3 | - | 856.3 | - | 2.32 | - | 100.00(0.60) | - |
| 4 | - | 856.3 | - | 2.32 | - | 100.00(0.60) | - |
| 5 | - | 856.3 | - | 2.32 | - | 100.00(0.60) | - |
| 6 | - | 856.3 | - | 2.32 | - | 100.00(0.60) | - |
| 7 | 642.1 | 856.3 | 2.33 | 2.98 | 1.04(0.18) | 98.96(0.18) | - |
| 8 | 642.1 | 856.3 | 2.40 | 2.89 | 4.80(0.60) | 95.20(0.60) | - |
| 9 | 642.1 | 856.6 | 2.61 | 2.98 | 15.40(1.80) | 84.60(1.80) | - |
| 10 | 642.4 | 856.6 | 2.33 | 3.13 | 22.00(2.00) | 78.00(2.00) | - |
| 11 | 642.4 | 856.9 | 2.51 | 3.17 | 52.00(4.00) | 48.00(4.00) | - |
High-angle annular dark-field (HAADF) images of the MnO layer and the NiMn substrate are shown in Figures 6A and B, respectively. The corresponding diffraction patterns are indexed along the [110] zone axis for MnO in Figure 6A and the [011] zone axis for the NiMn substrate in Figure 6B. The NiMn substrate exhibits abundant stacking faults, which are planar defects commonly observed in L10-ordered alloys. Figure 6C and D show the MnO/Ni-rich and Ni-rich/NiMn interfaces, respectively. The MnO/Ni-rich interface exhibits an incoherent interfacial structure, with no continuous long-range lattice registry across the interface. The FFT pattern from the Ni-rich region adjacent to MnO is indexed along the [121] zone axis. In contrast, the Ni-rich/NiMn interfacial region exhibits a Moiré-like modulation. The yellow boxes in Figure 6C and D indicate the regions used for the corresponding FFT analyses. The Ni-rich region adjacent to the NiMn substrate can be indexed close to the [111] zone axis, whereas the NiMn substrate is oriented close to the [011] zone axis. The Moiré-like contrast is attributed to the projected overlap of the differently oriented Ni-rich and NiMn lattices along the electron-beam direction.
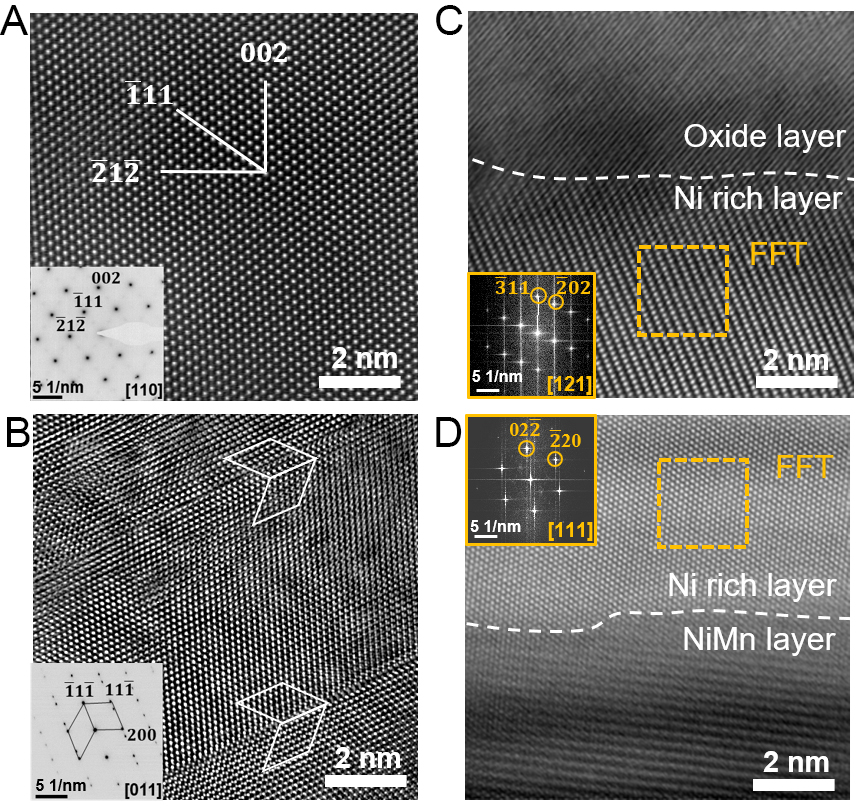
Figure 6. Atomic-resolution TEM analysis of the oxidized sample (650 K, 2.8 h). (A) HAADF image of the MnO layer with the corresponding [110] SAED pattern; (B) HAADF image of the NiMn substrate with the corresponding [011] SAED pattern; (C) MnO/Ni-rich interfacial region; the yellow box indicates the region used for FFT analysis, and the corresponding FFT pattern is shown in the panel; (D) Ni-rich/NiMn interfacial region; the yellow box indicates the region used for FFT analysis, and the corresponding FFT pattern is shown in the panel. TEM: Transmission electron microscopy; HAADF: high-angle annular dark-field; FFT: fast Fourier transform; SAED: selected-area electron diffraction.
Magnetic induction imaging of the subsurface Ni-rich layer by OAEH
Off-axis electron holography was used to map the magnetic induction distribution across the cross-section of the oxidized sample at the nanoscale. Phase maps acquired under opposite magnetic fields [Figure 7A and B] were subtracted to obtain the magnetic phase contribution [Figure 7C]. The phase gradient, color-coded for magnetic induction direction, appears in Figure 7D. The cosine of the magnetic phase is amplified by a factor of 8 for visualization. The amplified image shows magnetic flux oriented along the long axis of the continuous Ni-rich layer, consistent with shape anisotropy. This preferential alignment of the magnetic induction along the long axis is the lowest-energy magnetic state for an isolated ferromagnetic layer with high aspect ratio. The stray dipolar field that arises from this configuration is observable as a phase gradient outside the specimen region in the holography reconstruction.
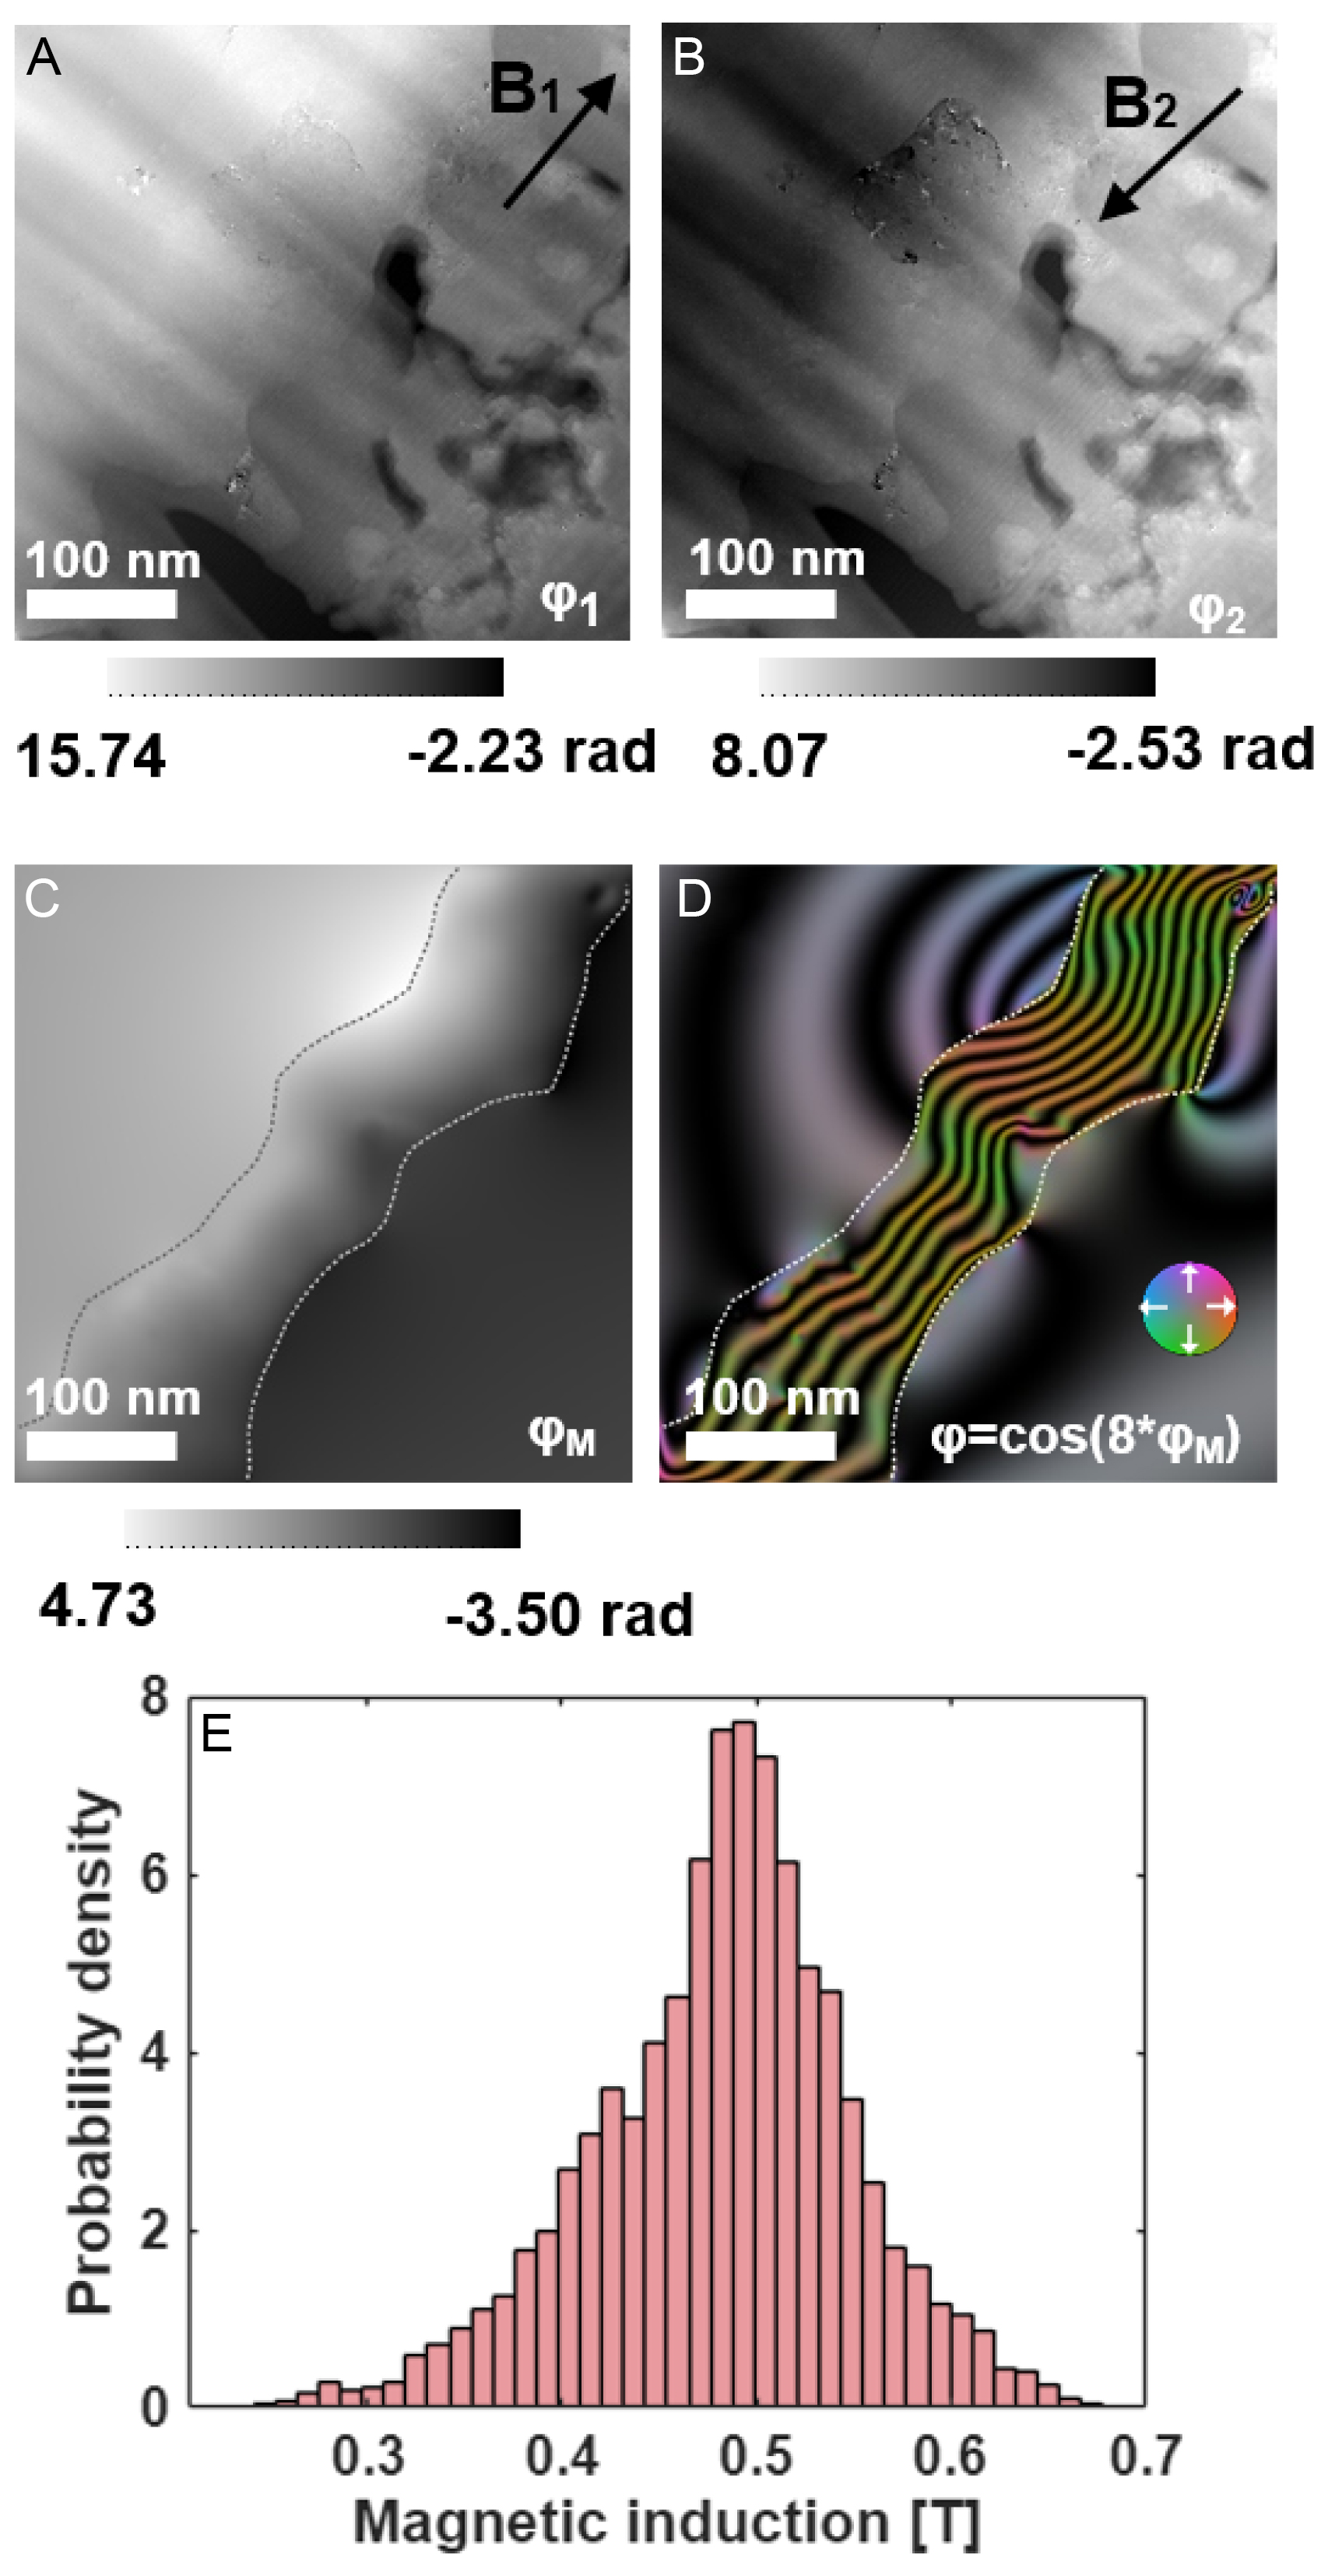
Figure 7. Magnetic phase mapping of the oxidized cross-section using off-axis electron holography. (A and B) Reconstructed phase images under reversed magnetization states (±21° tilt, 1 T field); (C) Magnetic phase image obtained as half the difference between (A and B). (D) Color-coded in-plane magnetic induction map derived from (C); the color wheel indicates the induction direction; (E) Histogram of magnetic induction values within the Ni-rich layer, yielding B = 0.48 ± 0.21 T.
The uniformly magnetized middle section of the region of interest was selected for histogram analysis [Figure 7E] to avoid boundary-related contributions. The measurement was performed at 300 K, and the reconstructed magnetic induction is B = 0.48 ± 0.21 T, where the uncertainty accounts for the statistical variation of the reconstructed values, the sensitivity to specimen thickness and mask definition, and the contribution propagated from residual phase noise. The central value is lower than the saturation induction of bulk Ni (approximately 0.61 T at room temperature), although the bulk value lies within the experimental uncertainty. The lower central value may be associated with residual strain, finite-size effects, and compositional variation within the nanoscale Ni-rich layer. EELS analysis shows that the Ni-rich layer contains a locally pure Ni region together with a compositional transition region toward the NiMn substrate. The increasing Mn content within the transition region can reduce the local magnetic moment per atom[32].
DISCUSSION
Selective oxidation of Ni54Mn46 at 650 K produces a distinct three-layer structure: an outer MnO surface layer, a continuous Ni-rich intermediate layer with a width of approximately 220 nm along the cross-sectional EELS profile, and the remaining NiMn substrate. Within the Ni-rich layer, a locally pure Ni region is followed by a compositionally graded transition region toward the NiMn substrate, in which the Mn content progressively increases. Off-axis electron holography gives a magnetic induction of B = 0.48 ± 0.21 T for the Ni-rich layer, confirming its ferromagnetic character. Our finding differs significantly from previous studies, which suggest that selective oxidation in binary alloys yields only compositionally graded solid solutions or internal precipitates[1,9]. Instead, the Ni-Mn system demonstrates that selective oxidation can produce a continuous Ni-rich layer containing locally pure Ni regions when the thermodynamic, kinetic, and phase-stability conditions align.
Selective oxidation of Mn and Ni enrichment in near-equiatomic NiMn
At 650 K, the standard Gibbs free energy of MnO formation is approximately 159 kJ mol-1 more negative than that of NiO[2]. Consequently, Mn oxidizes preferentially, leaving Ni in a metallic state. Mn is almost completely oxidized to manganese oxide, and no NiO is detected. In the Wagnerian limit, this thermodynamic preference ensures that the oxygen partial pressure (
The interface features after NiMn oxidation instead reflect the interplay between thermodynamic and kinetic factors, which can be qualitatively rationalized within the PIP framework[17]. This mechanism is driven by the competition among three core physical dimensions. First, the thermodynamic drive from the standard reduction potential (E0) transports Mn toward the reaction front while Ni remains inert. Second, the cohesive energy density (CED) reflects the lattice’s grip; Ni’s high CED and its stability in the FCC structure (EBCC ≫ EFCC) create a kinetic barrier that anchors Ni in place[18]. Third, the covalent radius (r) imposes a size-dependent hindrance, which, coupled with limited thermal activation at 650 K, is expected to restrict Ni redistribution by volume diffusion.
This parametric disparity leads to rapid extraction of Mn from the subsurface, resulting in the formation of a Ni-rich FCC region containing locally pure Ni. As the local Mn concentration drops below the L10 phase field, the system enters the FCC region of the Ni-Mn phase diagram[13]. The depleted region then transforms from tetragonal to FCC, resulting in a Ni-rich FCC layer that contains locally pure Ni regions together with a compositionally graded transition region toward the NiMn substrate. The width of the resulting Ni-rich layer, approximately 220 nm, is associated with the outward redistribution of Mn during oxidation. However, the present measurements do not provide a quantitative kinetic description of the layer-growth process. In particular, diffusion coefficients, activation energies, and a time-dependent growth law cannot be determined from the present dataset.
Crystallographic relationships and interfacial structure in the MnO/Ni-rich/NiMn layered system
Atomic-resolution HAADF-STEM observations reveal distinct interfacial characteristics in the MnO/Ni-rich/NiMn layered structure. The MnO/Ni-rich interface exhibits an incoherent structure, with no continuous long-range lattice registry across the interface. In contrast, the Ni-rich/NiMn interfacial region shows Moiré-like contrast arising from the projected overlap of differently oriented Ni-rich and NiMn lattices along the electron-beam direction. The Ni-rich layer retains an FCC structure throughout, distinct from the L10 structure of the underlying NiMn substrate. The mismatch between FCC Ni (a = 3.52 Å) and L10 NiMn (a = 3.73 Å, c = 3.53 Å) in the a direction is approximately 6%. Such a mismatch would impose substantial elastic strain on a fully coherent interface and make long-range coherent matching energetically unfavorable.
The Moiré-like contrast observed near the Ni-rich/NiMn interface is attributed to the local projected overlap of the two differently oriented crystal lattices along the electron-beam direction. The Ni-rich region can be aligned close to the [111] zone axis, whereas the adjacent NiMn region can be aligned close to the [011] zone axis. When one phase is aligned under a well-defined zone-axis condition for atomic-resolution imaging, the atomic columns of the adjacent phase cannot be simultaneously resolved under the same projection condition, indicating that the two phases do not share a simple common zone-axis relationship. The FFT of the interfacial region contains reflections from both the Ni-rich and NiMn phases, supporting the superposition of the two projected lattice periodicities. Moiré fringes can occur in HAADF-STEM imaging of overlapping crystalline structures despite the predominantly incoherent character of the imaging mode, with the resulting contrast depending on the projected atomic-column arrangement and electron-probe propagation[33]. Long-period Moiré patterns have also been experimentally identified when two misoriented crystal layers overlap along the specimen depth direction[34]. Therefore, the observed stripe-like modulation is interpreted as a geometric or projection Moiré-like contrast rather than conventional phase-interference Moiré fringes. These observations do not support a simple long-range coherent epitaxial relationship across the Ni-rich/NiMn interface.
During atomic-resolution imaging, when either phase is aligned along a well-defined zone axis, atomic columns of the adjacent phase cannot be simultaneously resolved under the same projection condition. Furthermore, no continuous long-range lattice registry or regular periodic array of misfit dislocations is resolved across the examined Ni-rich/MnO interfacial regions. These observations are consistent with an incoherent MnO/Ni-rich interface rather than a simple long-range coherent or semicoherent epitaxial relationship. The incoherent MnO/Ni-rich interface represents a structurally disordered reaction front between the growing MnO scale and the underlying Ni-rich region, which may influence local Mn transport during selective oxidation.
The rough and irregular morphology of the MnO/Ni-rich interface is likely associated with the spatially heterogeneous nature of the selective oxidation process. During oxidation, Mn diffuses outward and is preferentially oxidized to form MnO, while Ni becomes enriched beneath the oxide layer. Spatial variations in the local Mn flux and oxide growth rate can therefore produce a non-planar reaction front. Water vapor in the oxidation atmosphere may further contribute to the interfacial roughness. Previous studies have shown that H2O-assisted oxidation can promote subsurface oxidation, facilitate ionic transport through structurally disordered oxides, and enhance interfacial disorder and surface roughening[35-37]. These effects may contribute to the rough and irregular MnO/Ni-rich interface observed in the present study.
Residual strain associated with the formation of the Ni-rich layer may also influence its structural and magnetic properties. In FCC Ni, strain changes the interatomic spacing and can couple strongly to the magnetic state through magnetoelastic interactions. Direct in situ observations of single-crystalline Ni nanostructures have shown that tensile strain induces a substantial magnetic anisotropy, leading to magnetization reorientation, magnetic-domain restructuring, and magnetic hardening[38]. First-principles calculations further show that the atomic magnetic moment of FCC Ni depends on the strain state, increasing from compression toward tension under uniaxial deformation and decreasing with increasing shear strain[39]. Spin-lattice modeling of FCC Ni similarly demonstrates that lattice deformation can modify magnetocrystalline anisotropy, magnetostriction, and saturation magnetization[40].
Subsurface Ni-rich layer as the ferromagnetic origin in oxidized NiMn
Magnetization measurements show that oxidation broadens the hysteresis loop, while the high-field magnetization increases with oxidation time. Polishing removes these signals almost entirely, confirming their origin from the near-surface Ni-rich region rather than the bulk NiMn matrix. The gradual increase in magnetization with oxidation time indicates an increasing ferromagnetic contribution associated with the subsurface region. Combined with the marked reduction in the ferromagnetic response after removal of the oxidized surface region by polishing, these results indicate that the ferromagnetism originates predominantly from the subsurface Ni-rich layer formed during oxidation.
The Curie temperature of the oxidized surface (630 K) matches bulk Ni (631 K) within uncertainty. The magnetic induction measured by off-axis electron holography (B = 0.48 ± 0.21 T) has a central value lower than the reported value for bulk Ni (0.61 T), although the bulk value lies within the experimental uncertainty. The lower central value may be associated with local compositional variations near the Ni-rich/NiMn transition region, as revealed by EELS and shown in Table 1, as well as with finite-size effects in the nanoscale Ni-rich layer.
Implications
Selective oxidation can produce a continuous Ni-rich metallic interlayer containing locally pure metal regions in a binary alloy when a large difference in oxygen affinity, faster diffusion of the oxidizable element, and a stable metal-rich phase under the depleted composition are all present. The Ni-Mn system satisfies these conditions at 650 K. Other systems, such as NiCo under appropriate oxygen partial pressures or FeNi at temperatures where Fe oxidizes preferentially, may behave analogously. Off-axis electron holography directly links oxidation-driven elemental redistribution to magnetic functionality, establishing a structure-property relationship that can guide the design of oxidation-derived magnetic materials. Beyond its mechanistic significance, the present selective-oxidation process may provide a route for constructing buried ferromagnetic layers and magnetic interfaces directly within NiMn alloys. In particular, the formation of a ferromagnetic Ni-rich region adjacent to the NiMn matrix suggests the possibility of creating oxidation-defined magnetic heterointerfaces. Ferromagnet/antiferromagnet interfaces and the associated interfacial exchange coupling are important for controlling exchange bias and magnetization switching in spintronic heterostructures[41,42]. Therefore, selective oxidation may offer a promising strategy for engineering buried magnetic interfaces and locally defined ferromagnetic regions in NiMn-based materials, with potential for the development of exchange-coupled magnetic structures and spintronic devices.
CONCLUSION
Selective oxidation of near-equiatomic NiMn at 650 K produces a distinct three-layer structure consisting of an outer MnO scale, a continuous Ni-rich interlayer with a width of approximately 220 nm, and the NiMn substrate. The Ni-rich interlayer contains locally pure Ni regions together with a compositionally graded transition region toward the substrate. Off-axis electron holography yields a magnetic induction of B = 0.48 ± 0.21 T for the Ni-rich layer, confirming its ferromagnetic character. This result departs from the classical picture of selective oxidation, which predicts either compositionally graded solid solutions or internal precipitates rather than a continuous Ni-rich metallic layer containing locally pure Ni regions.
The direct magnetic measurement of the Ni-rich interlayer by off-axis electron holography links oxidation-driven elemental redistribution to ferromagnetic functionality. This work demonstrates that selective oxidation, typically viewed as a degradation mechanism, can instead be harnessed to synthesize nanoscale ferromagnetic layers. Other binary systems with a large difference in oxygen affinity and diffusivity between constituents may behave analogously.
DECLARATIONS
Acknowledgments
The Center for Instrumental Analysis of Guangxi University is acknowledged for providing research facilities and resources for the experiments.
Authors’ contributions
Material preparation, experimental investigation, data processing, and writing - original draft and revision: Li, T.
Transmission electron microscopy characterization: Xu, P.; Ma, C.
Magnetic-induction reconstruction and analysis based on off-axis electron holography: Ye, X.
Experimental design and data analysis: Liu, Y.
Writing - review and editing: Josten, N.
Supervision and guidance on the experimental work and manuscript preparation: Farle, M.; Li, Z.
All authors reviewed and approved the final manuscript.
Availability of data and materials
The data that support the findings of this study are available from the corresponding authors upon reasonable request.
AI and AI-assisted tools statement
During the preparation and revision of this manuscript, the authors used ChatGPT powered by GPT-5.6 Sol (OpenAI; released on 2026-07-09) and DeepSeek-V4-Flash in non-thinking mode (DeepSeek AI; released on 2026-07-31) solely for English-language polishing and editorial assistance to improve the clarity and readability of the manuscript. These tools were not used to generate, analyze, or interpret experimental data or to formulate scientific conclusions. The authors critically reviewed and edited all AI-assisted content and take full responsibility for the scientific content and conclusions of the manuscript.
Financial support and sponsorship
This work was supported by the Guangxi Science and Technology Major Program (No. AA23073019), the Natural Science Foundation of Guangxi Province (No. 2024GXNSFDA010014), the National Natural Science Foundation of China (Nos. 12364018 and 12674216), and the Deutsche Forschungsgemeinschaft (DFG, German Research Foundation) through TRR 270 (Project No. 405553726).
Conflicts of interest
All authors declared that there are no conflicts of interest.
Ethical approval and consent to participate
Not applicable.
Consent for publication
Not applicable.
Copyright
© The Author(s) 2026.
REFERENCES
1. Wagner, C. Theoretical analysis of the diffusion processes determining the oxidation rate of alloys. J Electrochem Soc 1952, 99, 369.
3. Li, C.; Zheng, W.; Zhong, H.; et al. Unveiling the atomistic mechanism of oxide scale spalling in heat-resistant alloys. Nat Commun 2025, 16, 2291.
4. Wang, Z.; Yan, Y.; Wu, Y.; et al. Recent research progress on the passivation and selective oxidation for the 3d-transition-metal and refractory multi-principal element alloys. npj Mater Degrad 2023, 7, 86.
5. Welch, N. J.; Quintana, M. J.; Butler, T. M.; Collins, P. C. High-temperature oxidation behavior of TaTiCr, Ta4Ti3Cr, Ta2TiCr, and Ta4TiCr3 concentrated refractory alloys. J Alloys Compd 2023, 941, 169000.
6. Welch, N. J.; Butler, T. M.; Quintana, M. J.; Collins, P. C. The influence of microstructure on the oxidation behavior of a TaTiCr refractory complex concentrated alloy. J Alloys Compd 2024, 1003, 175613.
7. Zhan, J.; Yang, Y.; Bi, H.; Li, M.; Gu, H. High temperature oxidation behavior of type 444 stainless steel in synthetic automotive exhaust gas. J Mater Res Technol 2021, 12, 530-41.
8. Martin, A.; Kiarie, W.; Chang, B.; Thuo, M. Chameleon metals: autonomous nano-texturing and composition inversion on liquid metals surfaces. Angew Chem Int Ed Engl 2020, 59, 352-7.
9. Gong, L.; Alamarguy, D.; Ruscassier, N.; Haghi-Ashtiani, P.; Giorgi, M. Understanding of selective oxidation of Fe-Mn binary alloys during continuous annealing through X-ray photoelectron spectroscopy. Corros Commun 2023, 11, 72-82.
10. Weiser, M.; Olszta, M. J.; Engelhard, M. H.; Zhu, Z.; Schreiber, D. K. Visualizing oxygen transport pathways during intergranular oxidation in Ni-Cr. npj Mater Degrad 2023, 7, 70.
11. Fu, M.; Bai, R.; Zhang, X.; et al. Oxidation mechanism transition and phase separation in Fe-Ni alloy nanowires: bridging experiments with molecular dynamics. Appl Surf Sci 2026, 715, 164556.
12. Sun, Y.; Zuo, X.; Sankaranarayanan, S. K. R. S.; Peng, S.; Narayanan, B.; Kamath, G. Quantitative 3D evolution of colloidal nanoparticle oxidation in solution. Science 2017, 356, 303-7.
13. Krén, E.; Nagy, E.; Nagy, I.; Pál, L.; Szabó, P. Structures and phase transformations in the Mn_Ni system near equiatomic concentration. J Phys Chem Solids 1968, 29, 101-8.
14. Sakuma, A. Electronic structures and magnetism of CuAu-type MnNi and MnGa. J Magn Magn Mater 1998, 187, 105-12.
16. Josten, N.; Noorzayee, S.; Miroshkina, O.; et al. Emergence of net magnetization by magnetic field biased diffusion in antiferromagnetic L10 NiMn. Phys Rev B 2023, 107, 174417.
17. Martin, A.; Thuo, M. Predicting emergence of nanoscale order in surface oxides through preferential interactivity parameter. ACS Nano 2024, 18, 6740-7.
18. Gwalani, B.; Martin, A.; Kautz, E.; et al. Mechanistic understanding of speciated oxide growth in high entropy alloys. Nat Commun 2024, 15, 5026.
19. Dunin-Borkowski, R. E.; Kasama, T.; Wei, A.; et al. Off-axis electron holography of magnetic nanowires and chains, rings, and planar arrays of magnetic nanoparticles. Microsc Res Tech 2004, 64, 390-402.
20. Weßels, T.; Kovács, A.; Gliga, S.; Finizio, S.; Caron, J.; Dunin-Borkowski, R. E. Quantitative imaging of the magnetic field distribution in an artificial spin ice studied by off-axis electron holography. J Magn Magn Mater 2022, 543, 168535.
21. Toby, B. H.; Von Dreele, R. B. GSAS-II : the genesis of a modern open-source all purpose crystallography software package. J Appl Crystallogr 2013, 46, 544-9.
22. Pearson, D. H.; Ahn, C. C.; Fultz, B. White lines and d-electron occupancies for the 3d and 4d transition metals. Phys Rev B Condens Matter 1993, 47, 8471-8.
23. Escobar, M. A.; Estrada, J. C.; Vargas, J. Phase-shifting VU factorization for interferometry. Opt Laser Eng 2020, 124, 105797.
24. Almeida, T. P.; Palomino, A.; Lequeux, S.; et al. Off-axis electron holography for the direct visualization of perpendicular shape anisotropy in nanoscale 3D magnetic random-access-memory devices. APL Mater 2022, 10, 061104.
25. Dunin-Borkowski, R. E.; Kasama, T.; Harrison, R. J. Electron Holography of Nanostructured Materials. In: Kirkland AI, Haigh SJ, editors. Nanocharacterisation. The Royal Society of Chemistry; 2015. pp. 158-210.
26. Caron, J. Model-based reconstruction of magnetisation distributions in nanostructures from electron optical phase images. Forschungszentrum Jülich GmbH; 2018. Available from: http://hdl.handle.net/2128/19740.
27. Ye, X.; Su, H.; Su, J.; et al. Quantification of magnetization of nanostructures via three complementary methods. Appl Phys Lett 2025, 126, 242403.
28. Connelly, D. L.; Loomis, J. S.; Mapother, D. E. Specific heat of nickel near the curie temperature. Phys Rev B 1971, 3, 924-34.
29. Kaya, S.; Kussmann, A. Ferromagnetismus und Phasengestaltung im Zweistoffsystem Nickel-Mangan. Z Physik 1931, 72, 293-309.(in German).
30. Schmid, H. K.; Mader, W. Oxidation states of Mn and Fe in various compound oxide systems. Micron 2006, 37, 426-32.
31. Bawane, K.; Manganaris, P.; Wang, Y.; et al. Determining oxidation states of transition metals in molten salt corrosion using electron energy loss spectroscopy. Scripta Materialia 2021, 197, 113790.
32. Cable, J. W.; Child, H. R. Magnetic moment distribution in NiMn alloys. Phys Rev B 1974, 10, 4607-15.
33. Hu, W. T.; Tian, M.; Wang, Y. J.; Zhu, Y. L. Moiré fringe imaging of heterostructures by scanning transmission electron microscopy. Micron 2024, 185, 103679.
34. Song, C.; Wang, J.; Sun, J.; et al. Insight into long-period pattern by depth sectioning using aberration-corrected scanning transmission electron microscope. Ultramicroscopy 2020, 209, 112885.
35. Luo, L.; Li, L.; Schreiber, D. K.; et al. Deciphering atomistic mechanisms of the gas-solid interfacial reaction during alloy oxidation. Sci Adv 2020, 6, eaay8491.
36. Li, S.; Cao, Z.; Chang, H.; et al. Copper-hydroxyl interactions drive water-promoted copper surface oxidation and mobility. Nat Commun 2026, 17, 5437.
37. Essuman, E.; Meier, G.; Żurek, J.; Hänsel, M.; Singheiser, L.; Quadakkers, W. Enhanced internal oxidation as trigger for breakaway oxidation of Fe-Cr alloys in gases containing water vapor. Scripta Materialia 2007, 57, 845-8.
38. Kong, D.; Kovács, A.; Charilaou, M.; et al. Direct observation of tensile-strain-induced nanoscale magnetic hardening. Nat Commun 2023, 14, 3963.
39. Liang, T.; Wang, S.; Shi, P. Mechanism study of strain-induced magnetic properties changes for nickel-based materials at atomic scale. J Magn Magn Mater 2023, 588, 171377.
40. Nieves, P.; Tranchida, J.; Arapan, S.; Legut, D. Spin-lattice model for cubic crystals. Phys Rev B 2021, 103, 094437.
41. Wang, Y.; Taniguchi, T.; Lin, P.; et al. Time-resolved detection of spin–orbit torque switching of magnetization and exchange bias. Nat Electron 2022, 5, 840-8.
Cite This Article
 Open Access
How to Cite
Li, T.; Xu, P.; Josten, N.; Ye, X.; Liu, Y.; Ma, C.; Farle, M.; Li, Z. Subsurface Ni nanolayers from selective Mn surface oxidation and diffusion in NiMn alloys. Microstructures 2026, 6, 20260138. https://dx.doi.org/10.20517/microstructures.2026.123
Download Citation
If you have the appropriate software installed, you can download article citation data to the citation manager of your choice. Simply select your manager software from the list below and click on download.
Export Citation File
Type of Import
Tips on Downloading Citation
Citation Manager File Format
Type of Import
Direct Import: When the Direct Import option is selected (the default state), a dialogue box will give you the option to Save or Open the downloaded citation data. Choosing Open will either launch your citation manager or give you a choice of applications with which to use the metadata. The Save option saves the file locally for later use.
Indirect Import: When the Indirect Import option is selected, the metadata is displayed and may be copied and pasted as needed.
About This Article
Copyright

Data & Comments
Data
0











Comments
Comments must be written in English. Spam, offensive content, impersonation, and private information will not be permitted. If any comment is reported and identified as inappropriate content by OAE staff, the comment will be removed without notice. If you have any queries or need any help, please contact us at [email protected].