
fig5
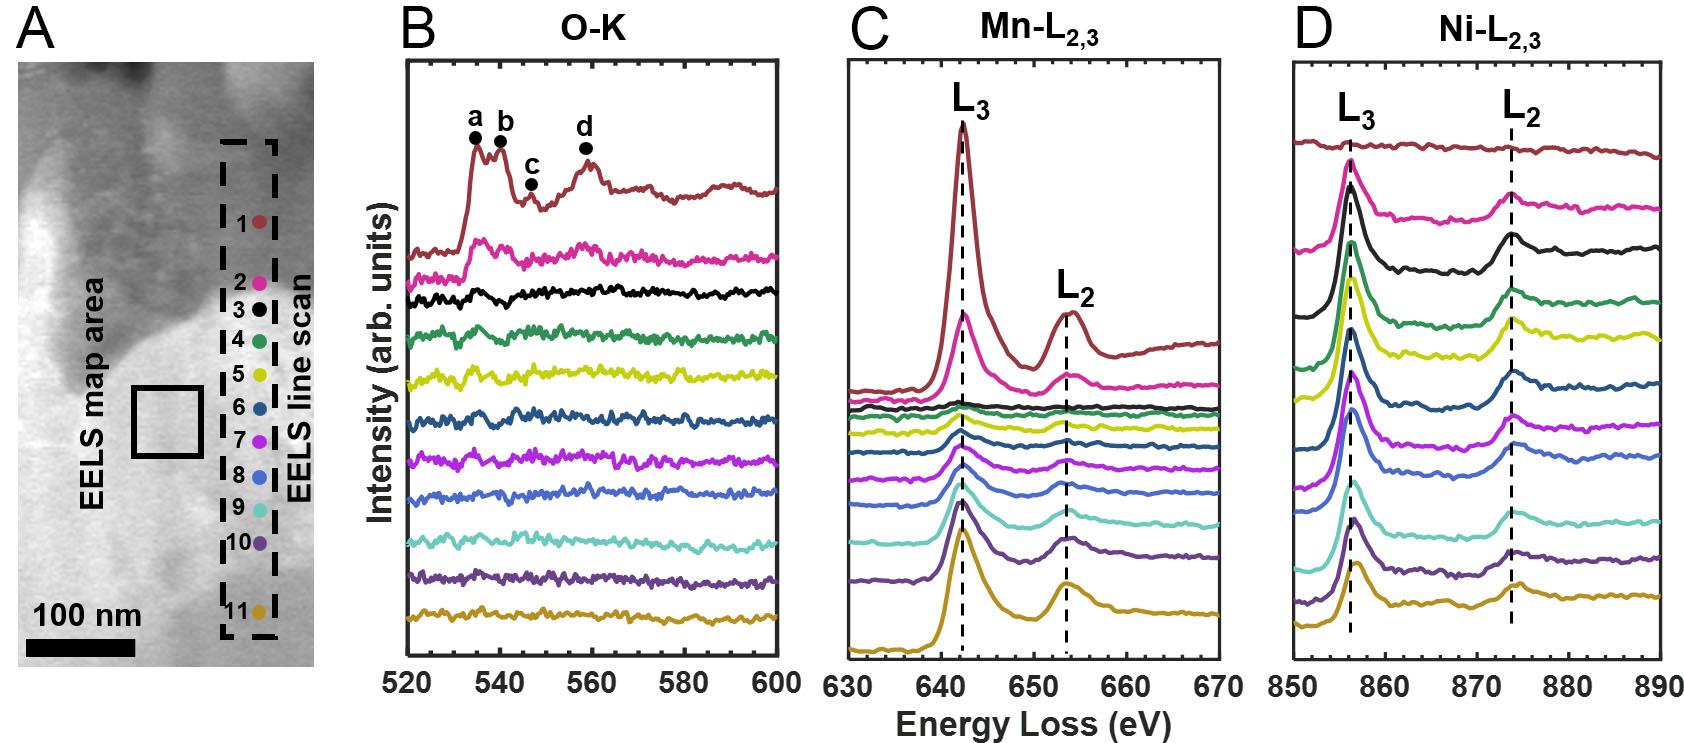
Figure 5. (A) STEM-BF image of the oxidized cross-section showing the EELS acquisition positions; (B-D) EELS spectra of the O-K, Mn-L2,3, and Ni-L2,3 edges obtained from the color-coded positions in (A). STEM-BF: Bight-field scanning transmission electron microscopy; EELS: electron energy-loss spectroscopy