
fig6
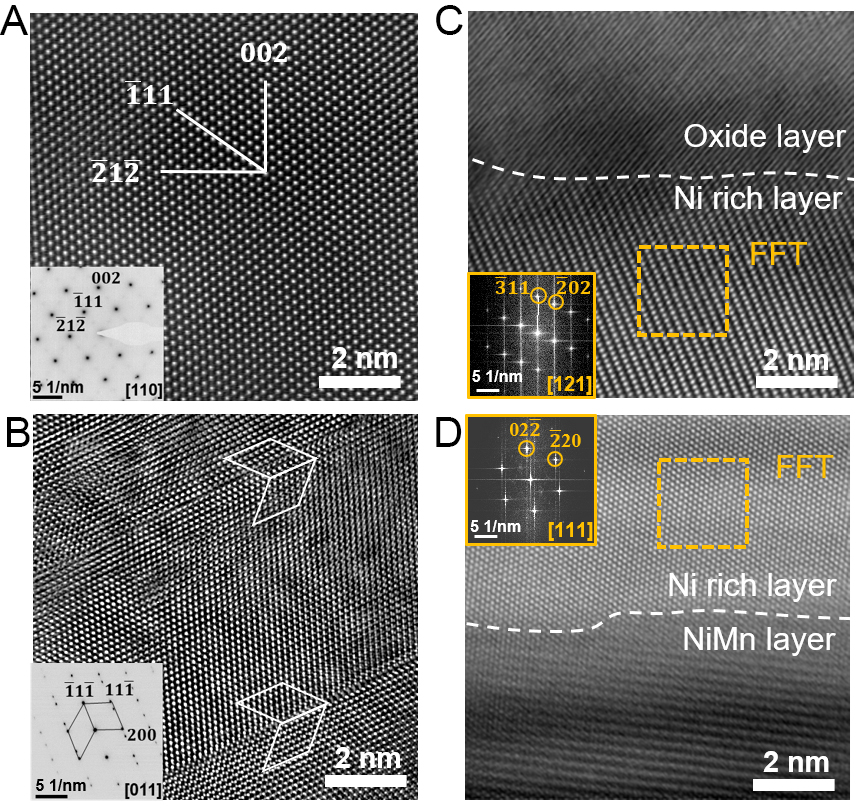
Figure 6. Atomic-resolution TEM analysis of the oxidized sample (650 K, 2.8 h). (A) HAADF image of the MnO layer with the corresponding [110] SAED pattern; (B) HAADF image of the NiMn substrate with the corresponding [011] SAED pattern; (C) MnO/Ni-rich interfacial region; the yellow box indicates the region used for FFT analysis, and the corresponding FFT pattern is shown in the panel; (D) Ni-rich/NiMn interfacial region; the yellow box indicates the region used for FFT analysis, and the corresponding FFT pattern is shown in the panel. TEM: Transmission electron microscopy; HAADF: high-angle annular dark-field; FFT: fast Fourier transform; SAED: selected-area electron diffraction.