
fig7
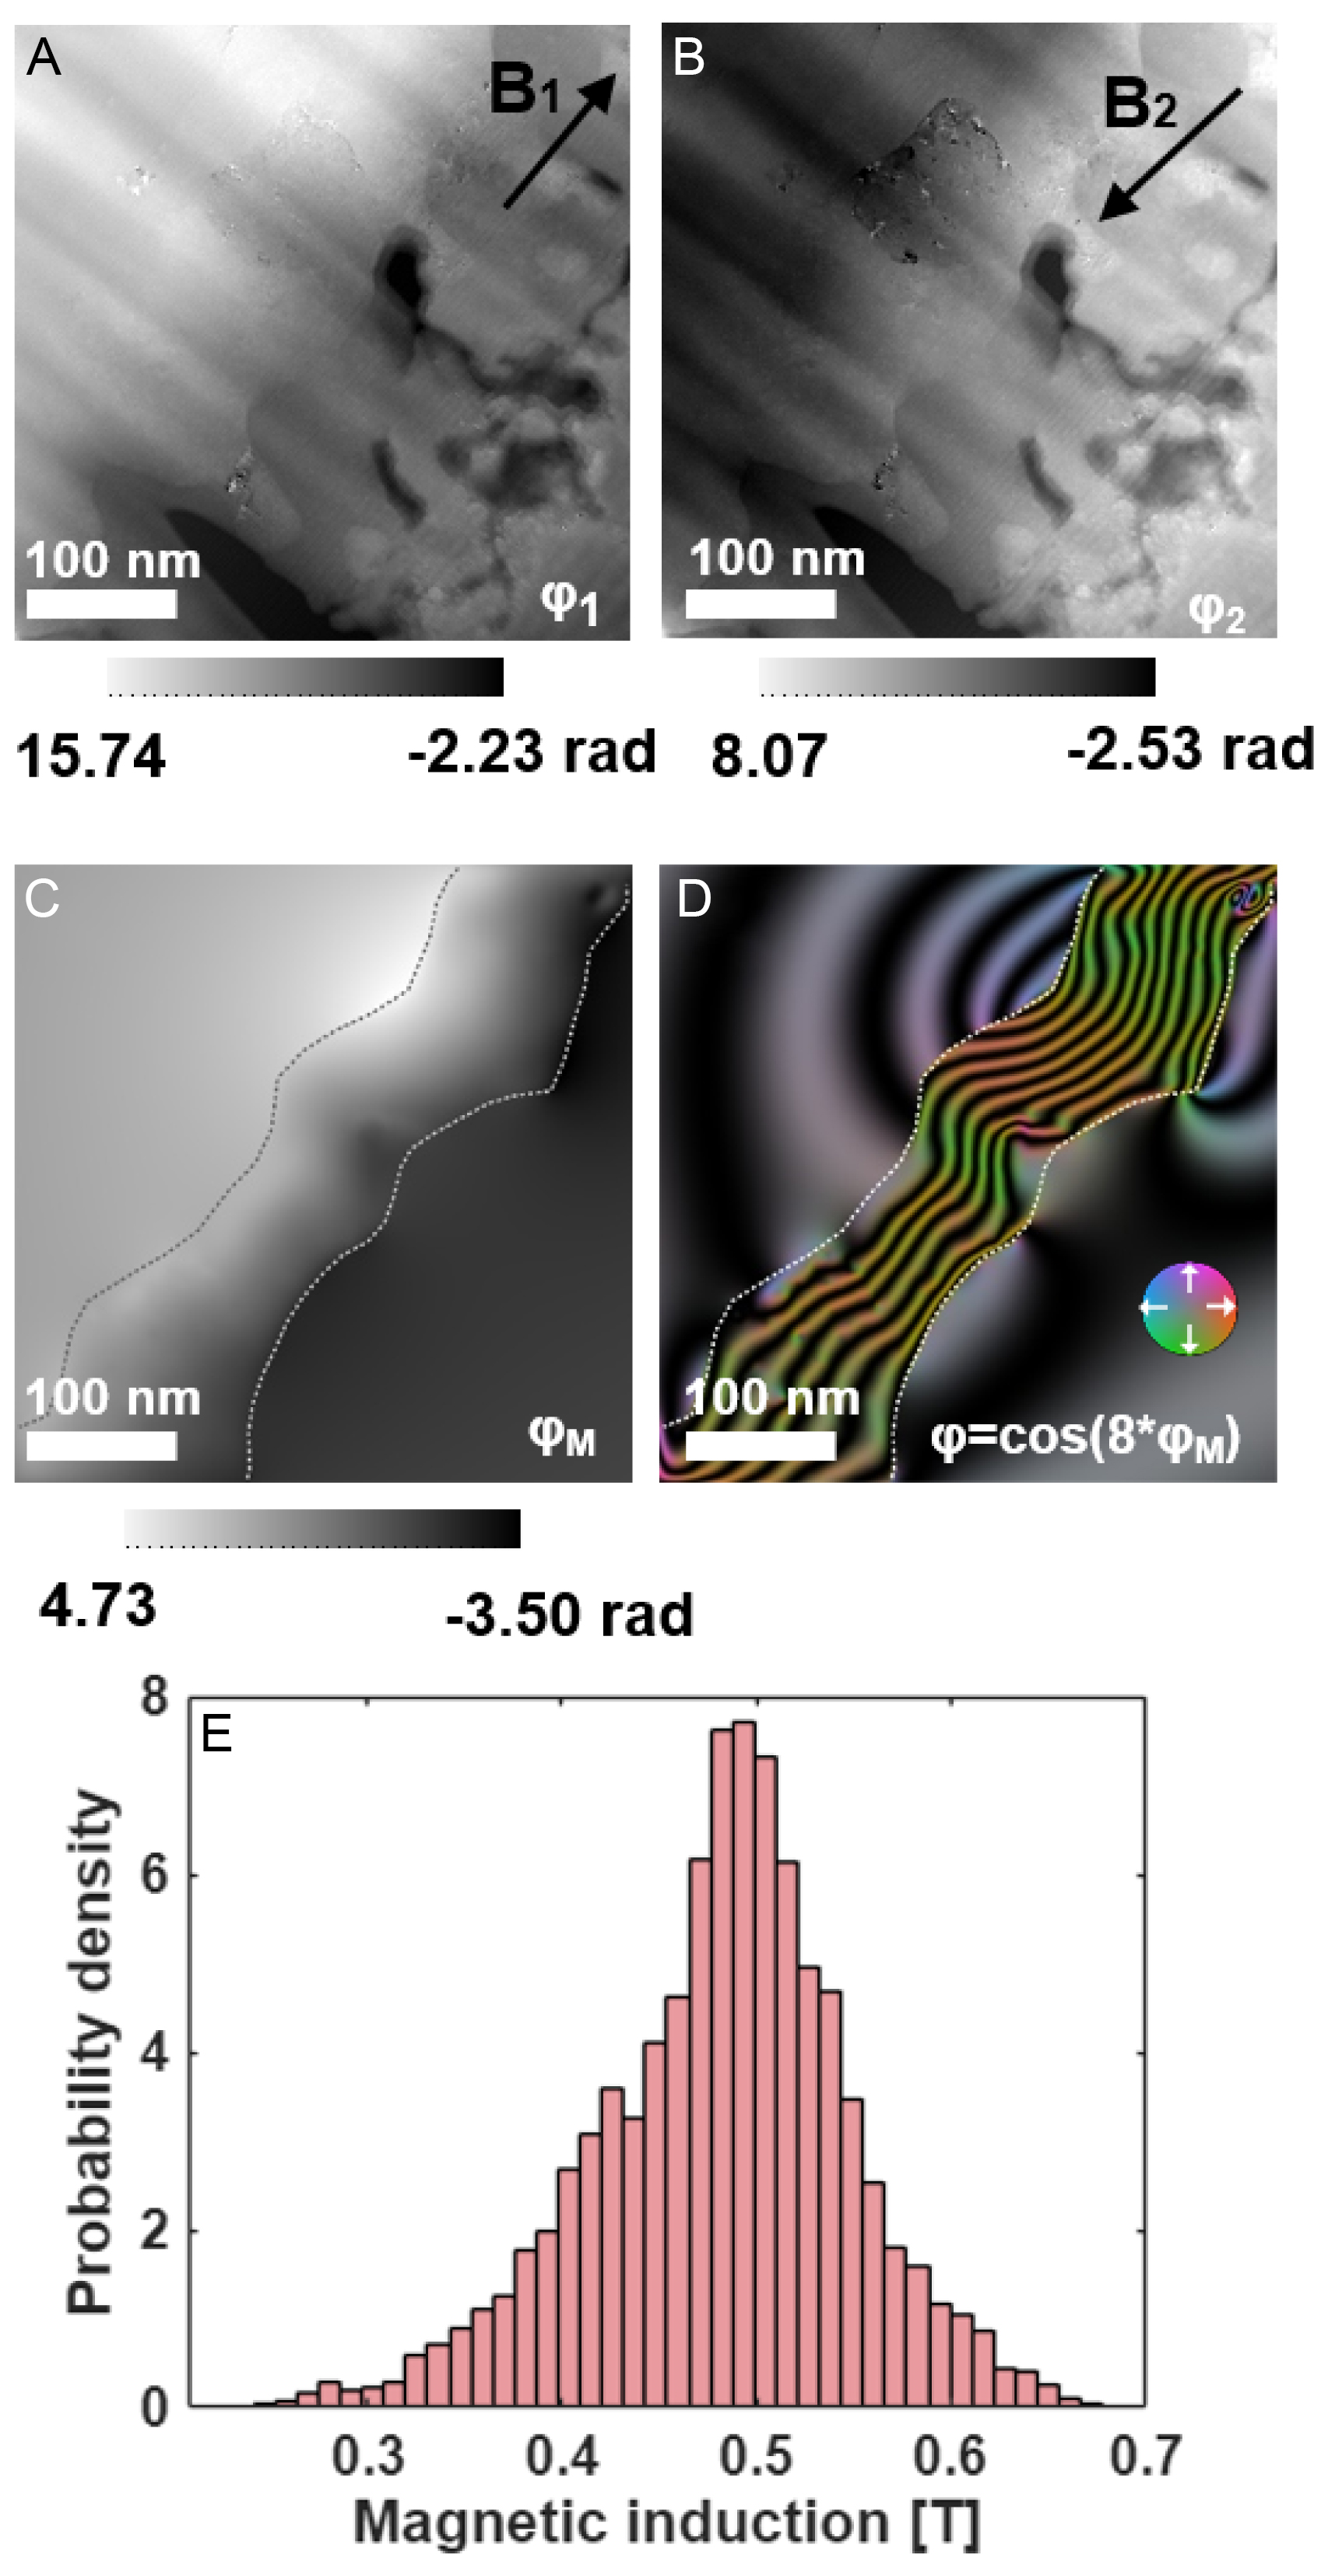
Figure 7. Magnetic phase mapping of the oxidized cross-section using off-axis electron holography. (A and B) Reconstructed phase images under reversed magnetization states (±21° tilt, 1 T field); (C) Magnetic phase image obtained as half the difference between (A and B). (D) Color-coded in-plane magnetic induction map derived from (C); the color wheel indicates the induction direction; (E) Histogram of magnetic induction values within the Ni-rich layer, yielding B = 0.48 ± 0.21 T.