

fig6
From: Intelligent and inclusive EEG-driven authentication for gender fairness and cognitive impairment
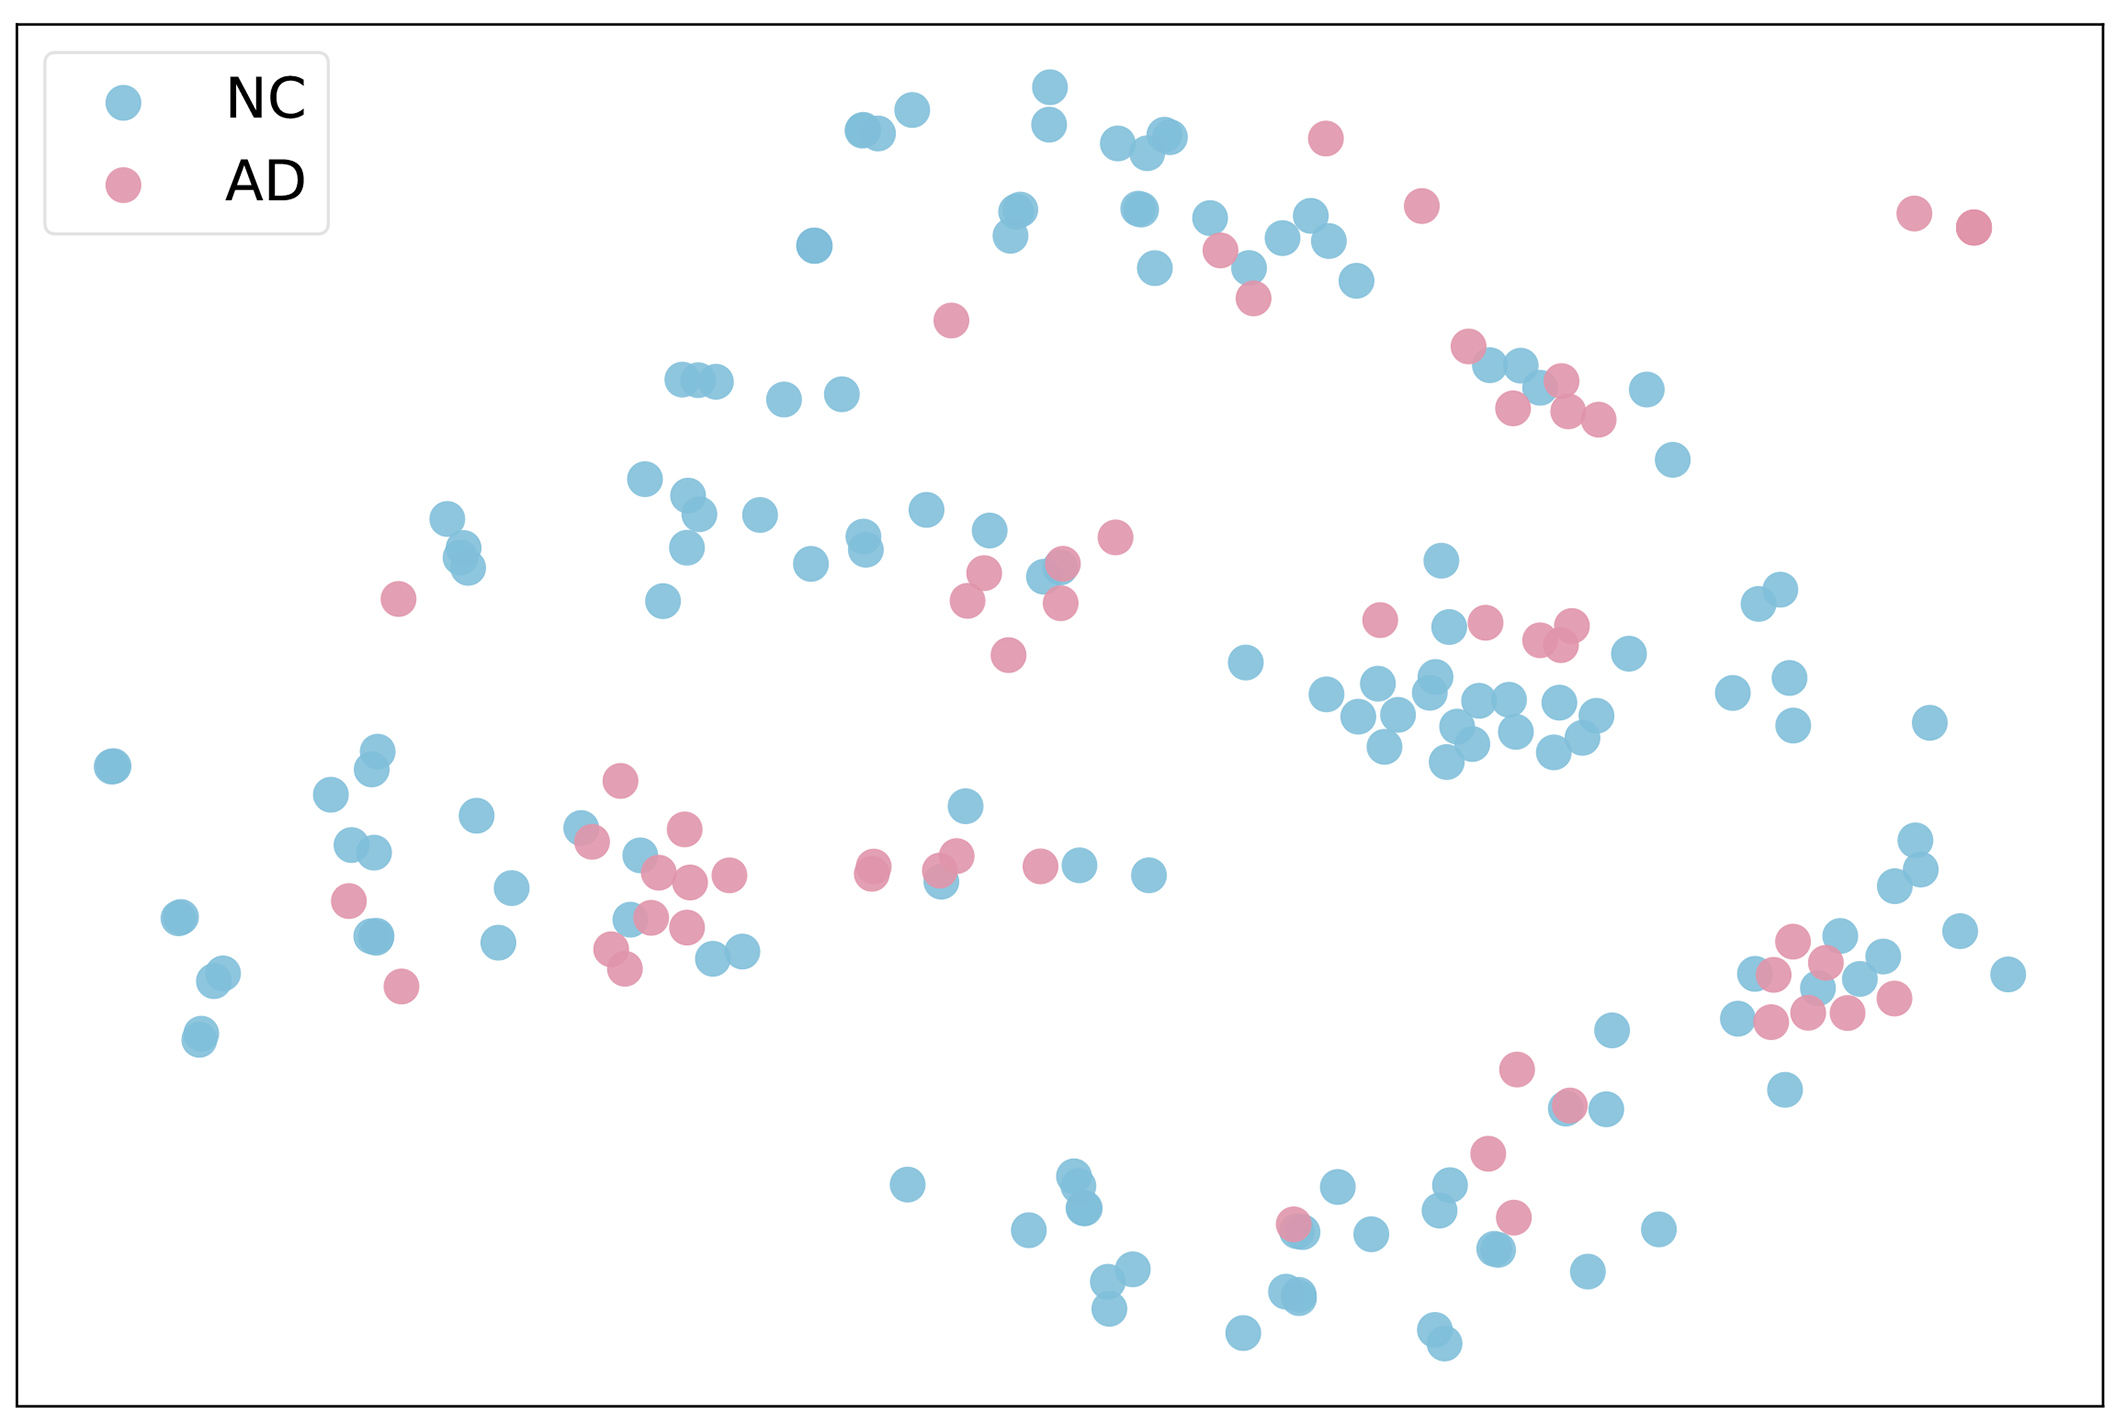
Figure 6. t-SNE projection of NC and AD samples by participant ID, illustrating feature-level clustering by group. t-SNE: t-Distributed stochastic neighbour embedding; NC: normal control; AD: Alzheimer’s disease.


