

fig5
From: Intelligent and inclusive EEG-driven authentication for gender fairness and cognitive impairment
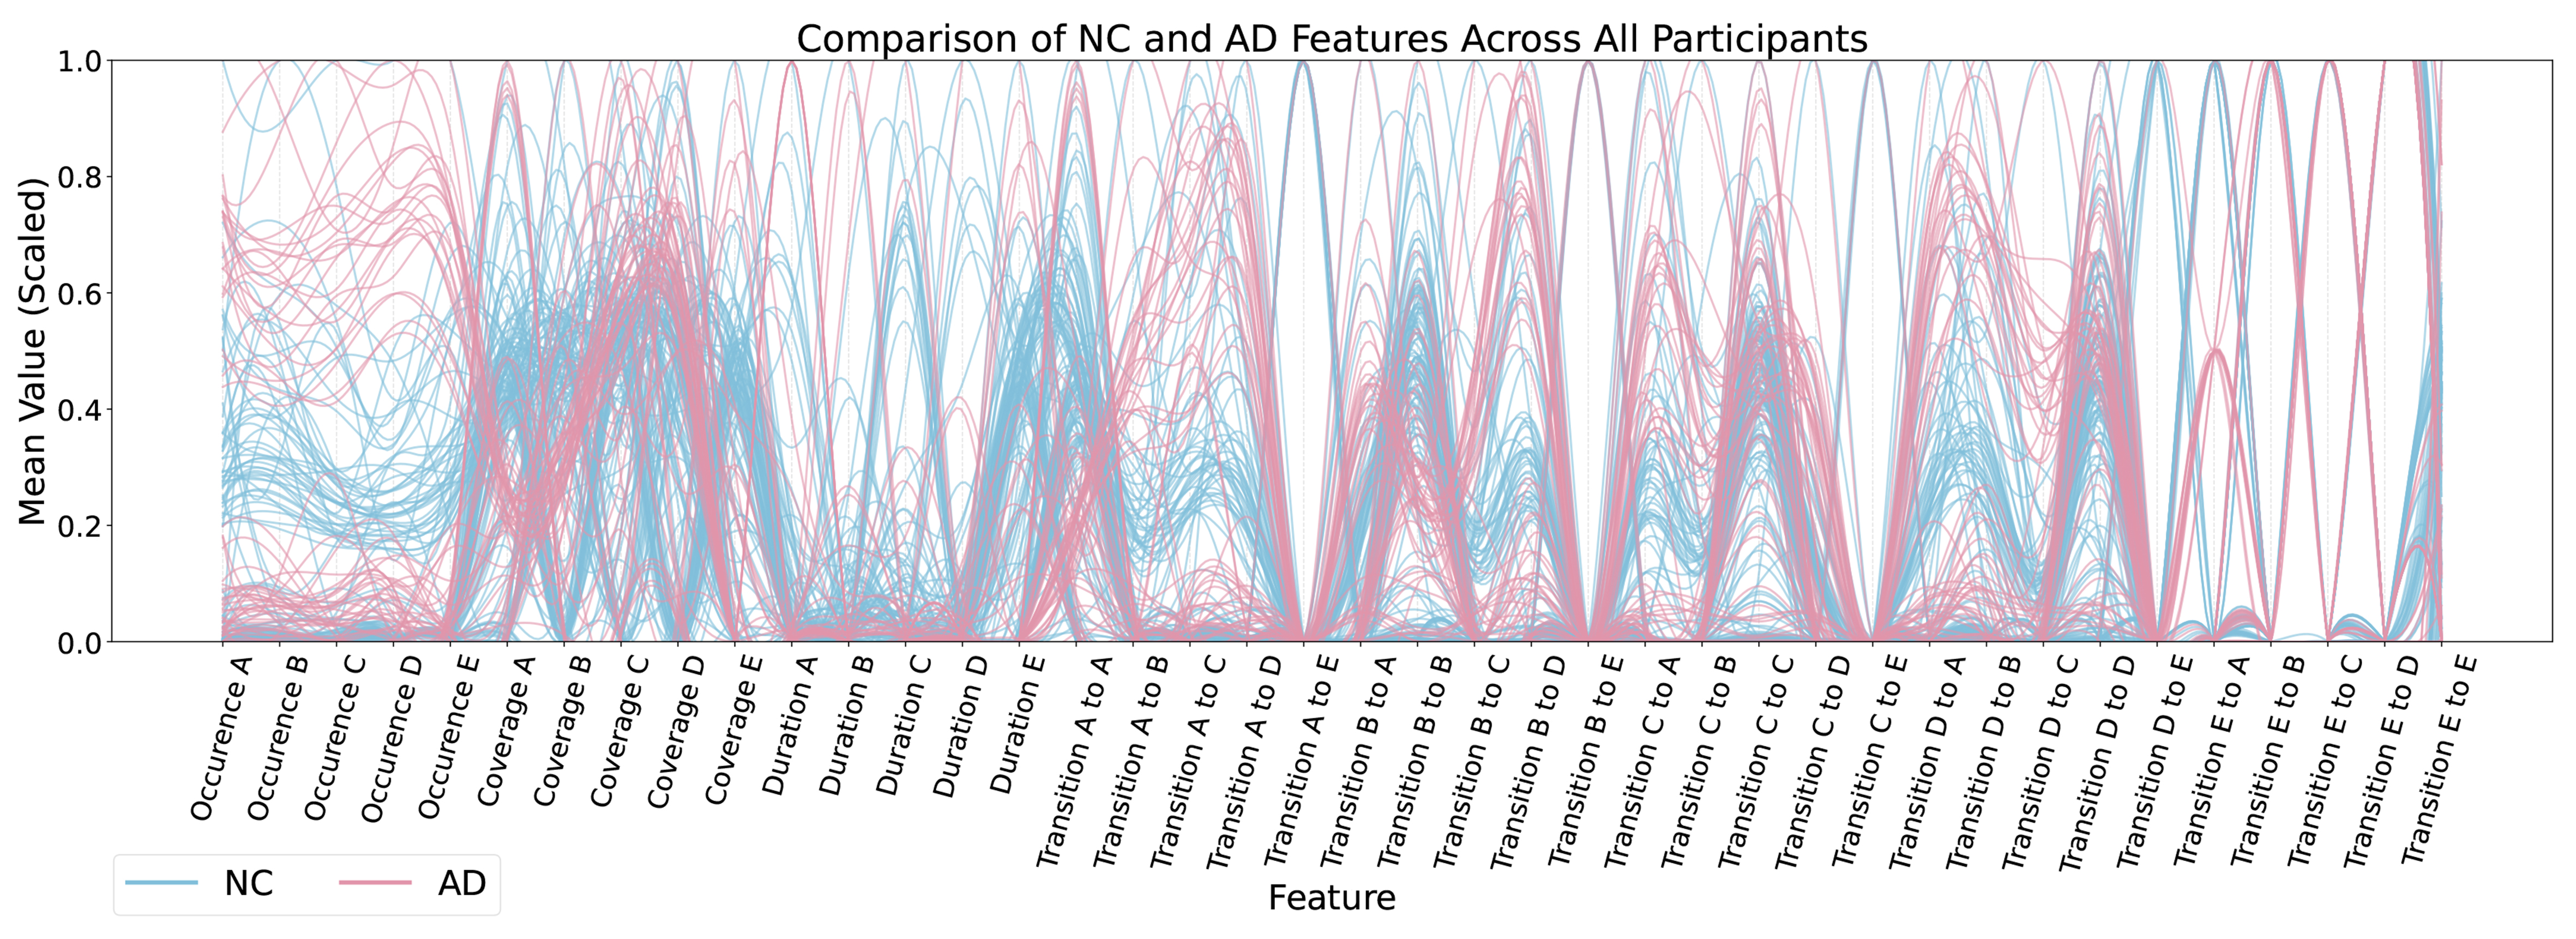
Figure 5. Comparison of feature distributions between NC and AD participants (inter-group variability). NC: Normal control; AD: Alzheimer’s disease.


