
fig3
From: Intelligent and inclusive EEG-driven authentication for gender fairness and cognitive impairment
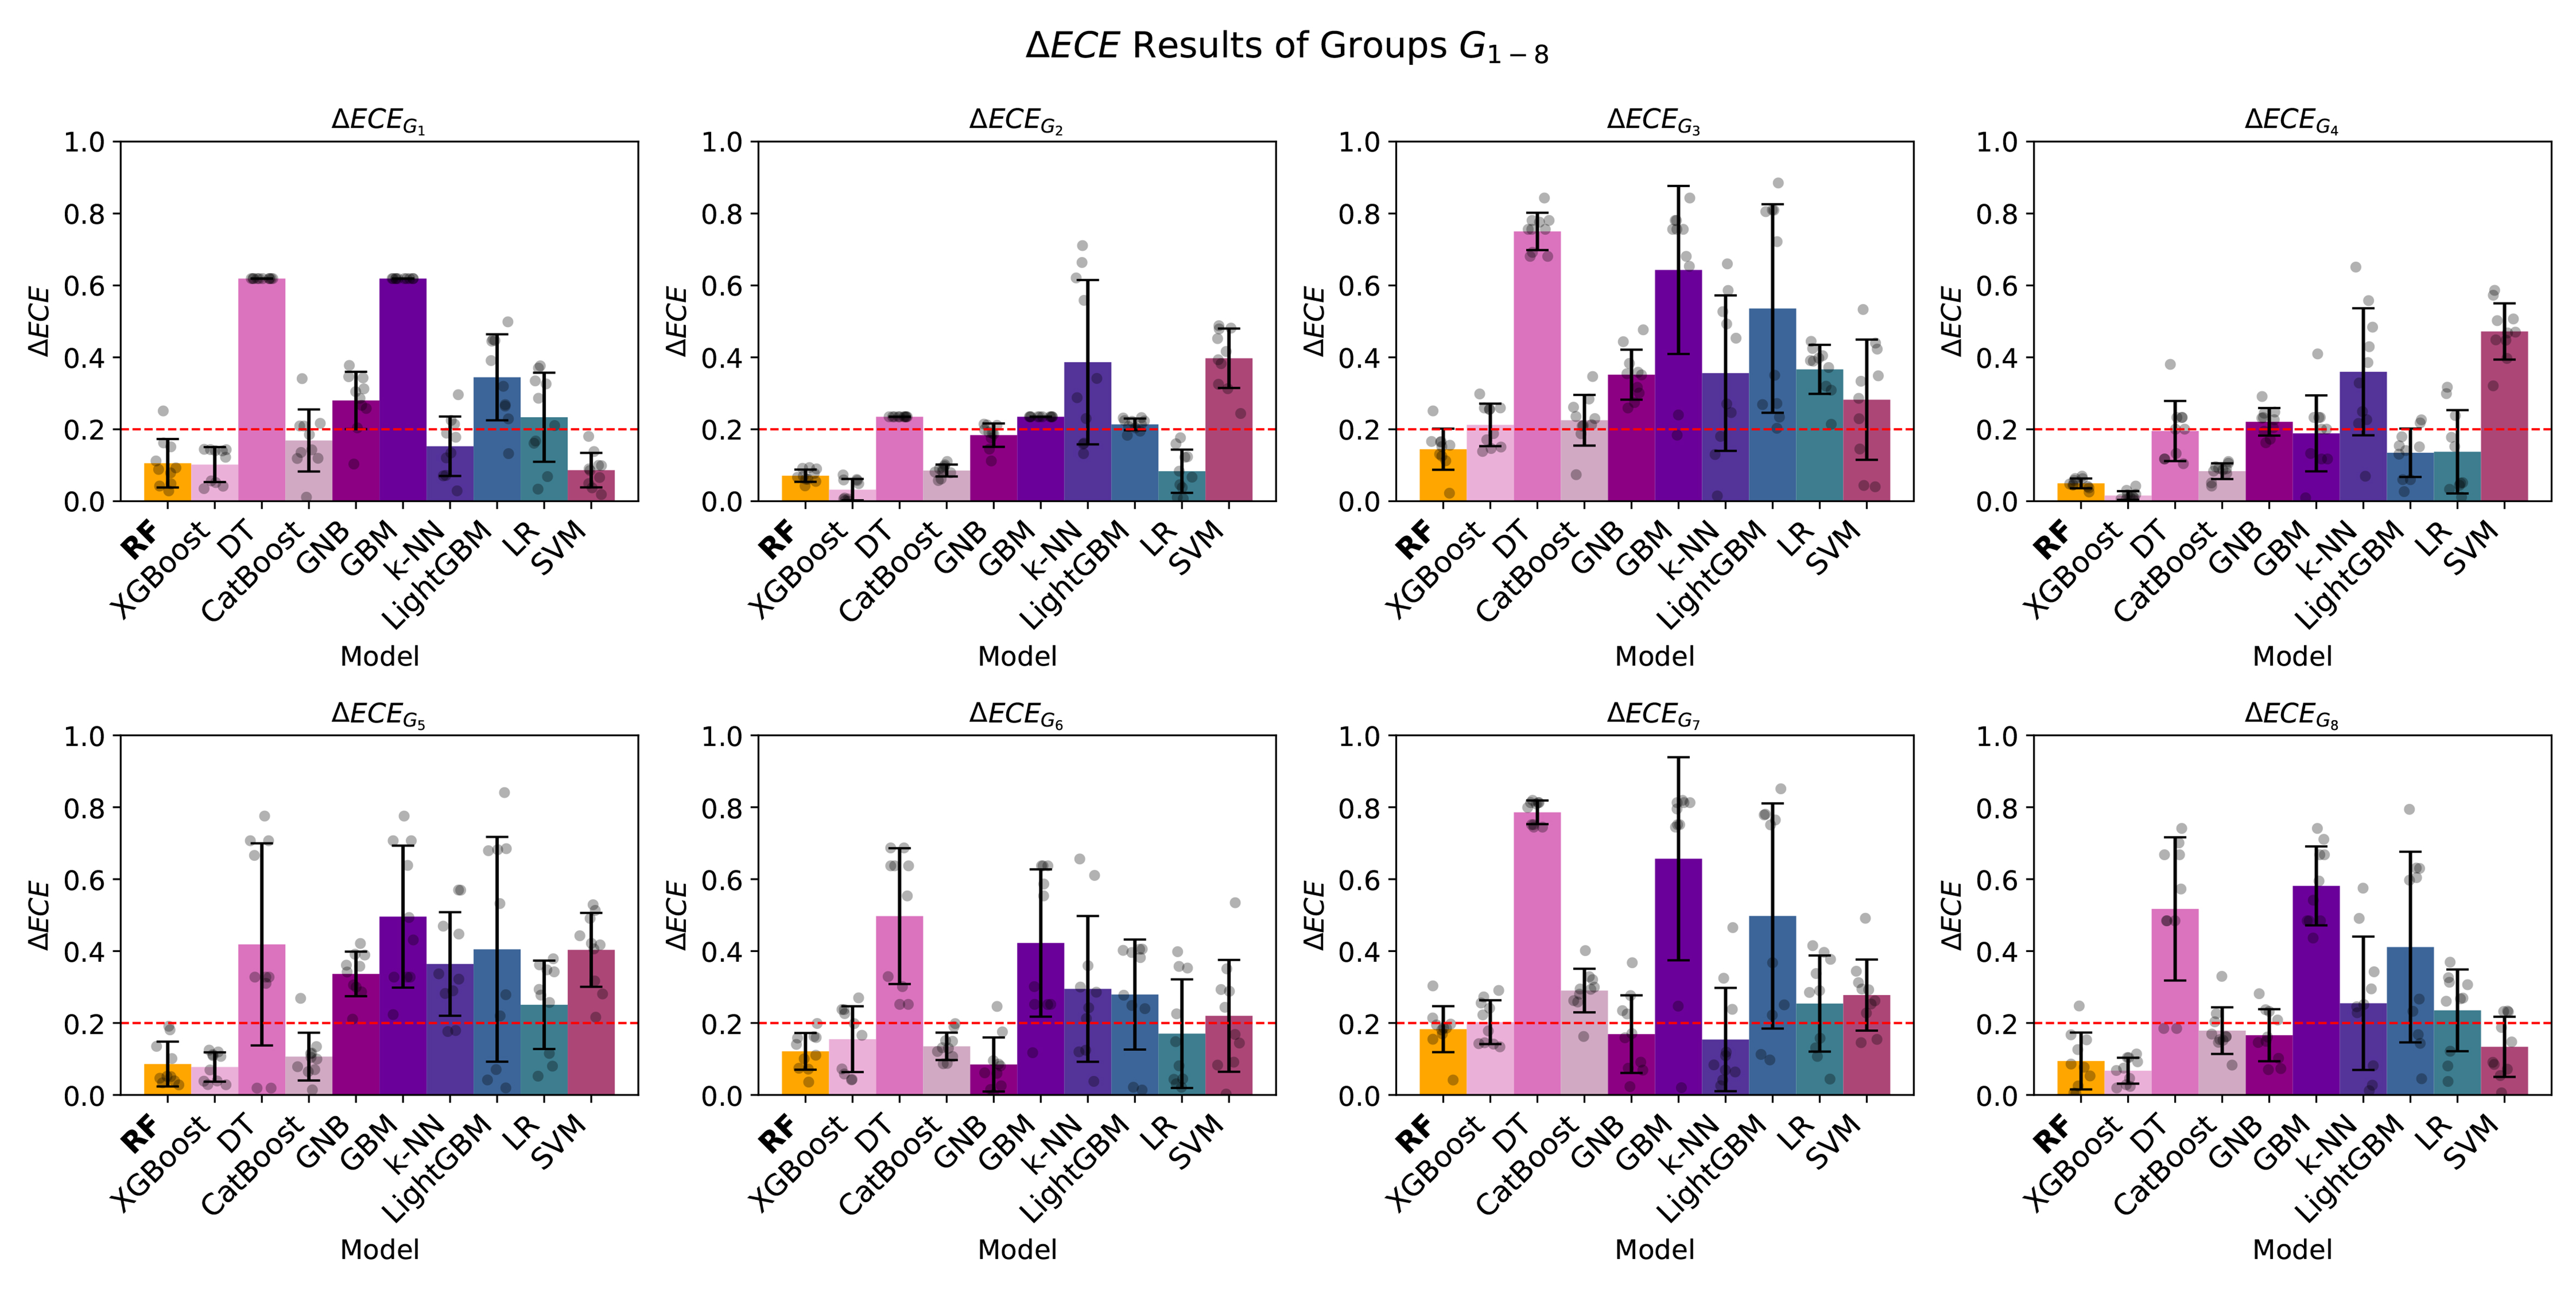
Figure 3. EchoMC network fairness visualisation: ΔECE with groups G1-8 of different meta-models across all splits. Error bars represent the standard deviation of ΔECE across the n = 10 validation splits. The dashed red line indicates the acceptance threshold γ = 0.2. ΔECE: Calibration using expected calibration error; RF: random forest; XGBoost: eXtreme gradient boosting; DT: decision tree; CatBoost: categorical boosting; GNB: Gaussian naive Bayes; GBM: gradient boosting machine; k-NN: k-nearest neighbors; LightGBM: light gradient boosting machine; LR: logistic regression; SVM: support vector machine.


