


fig6
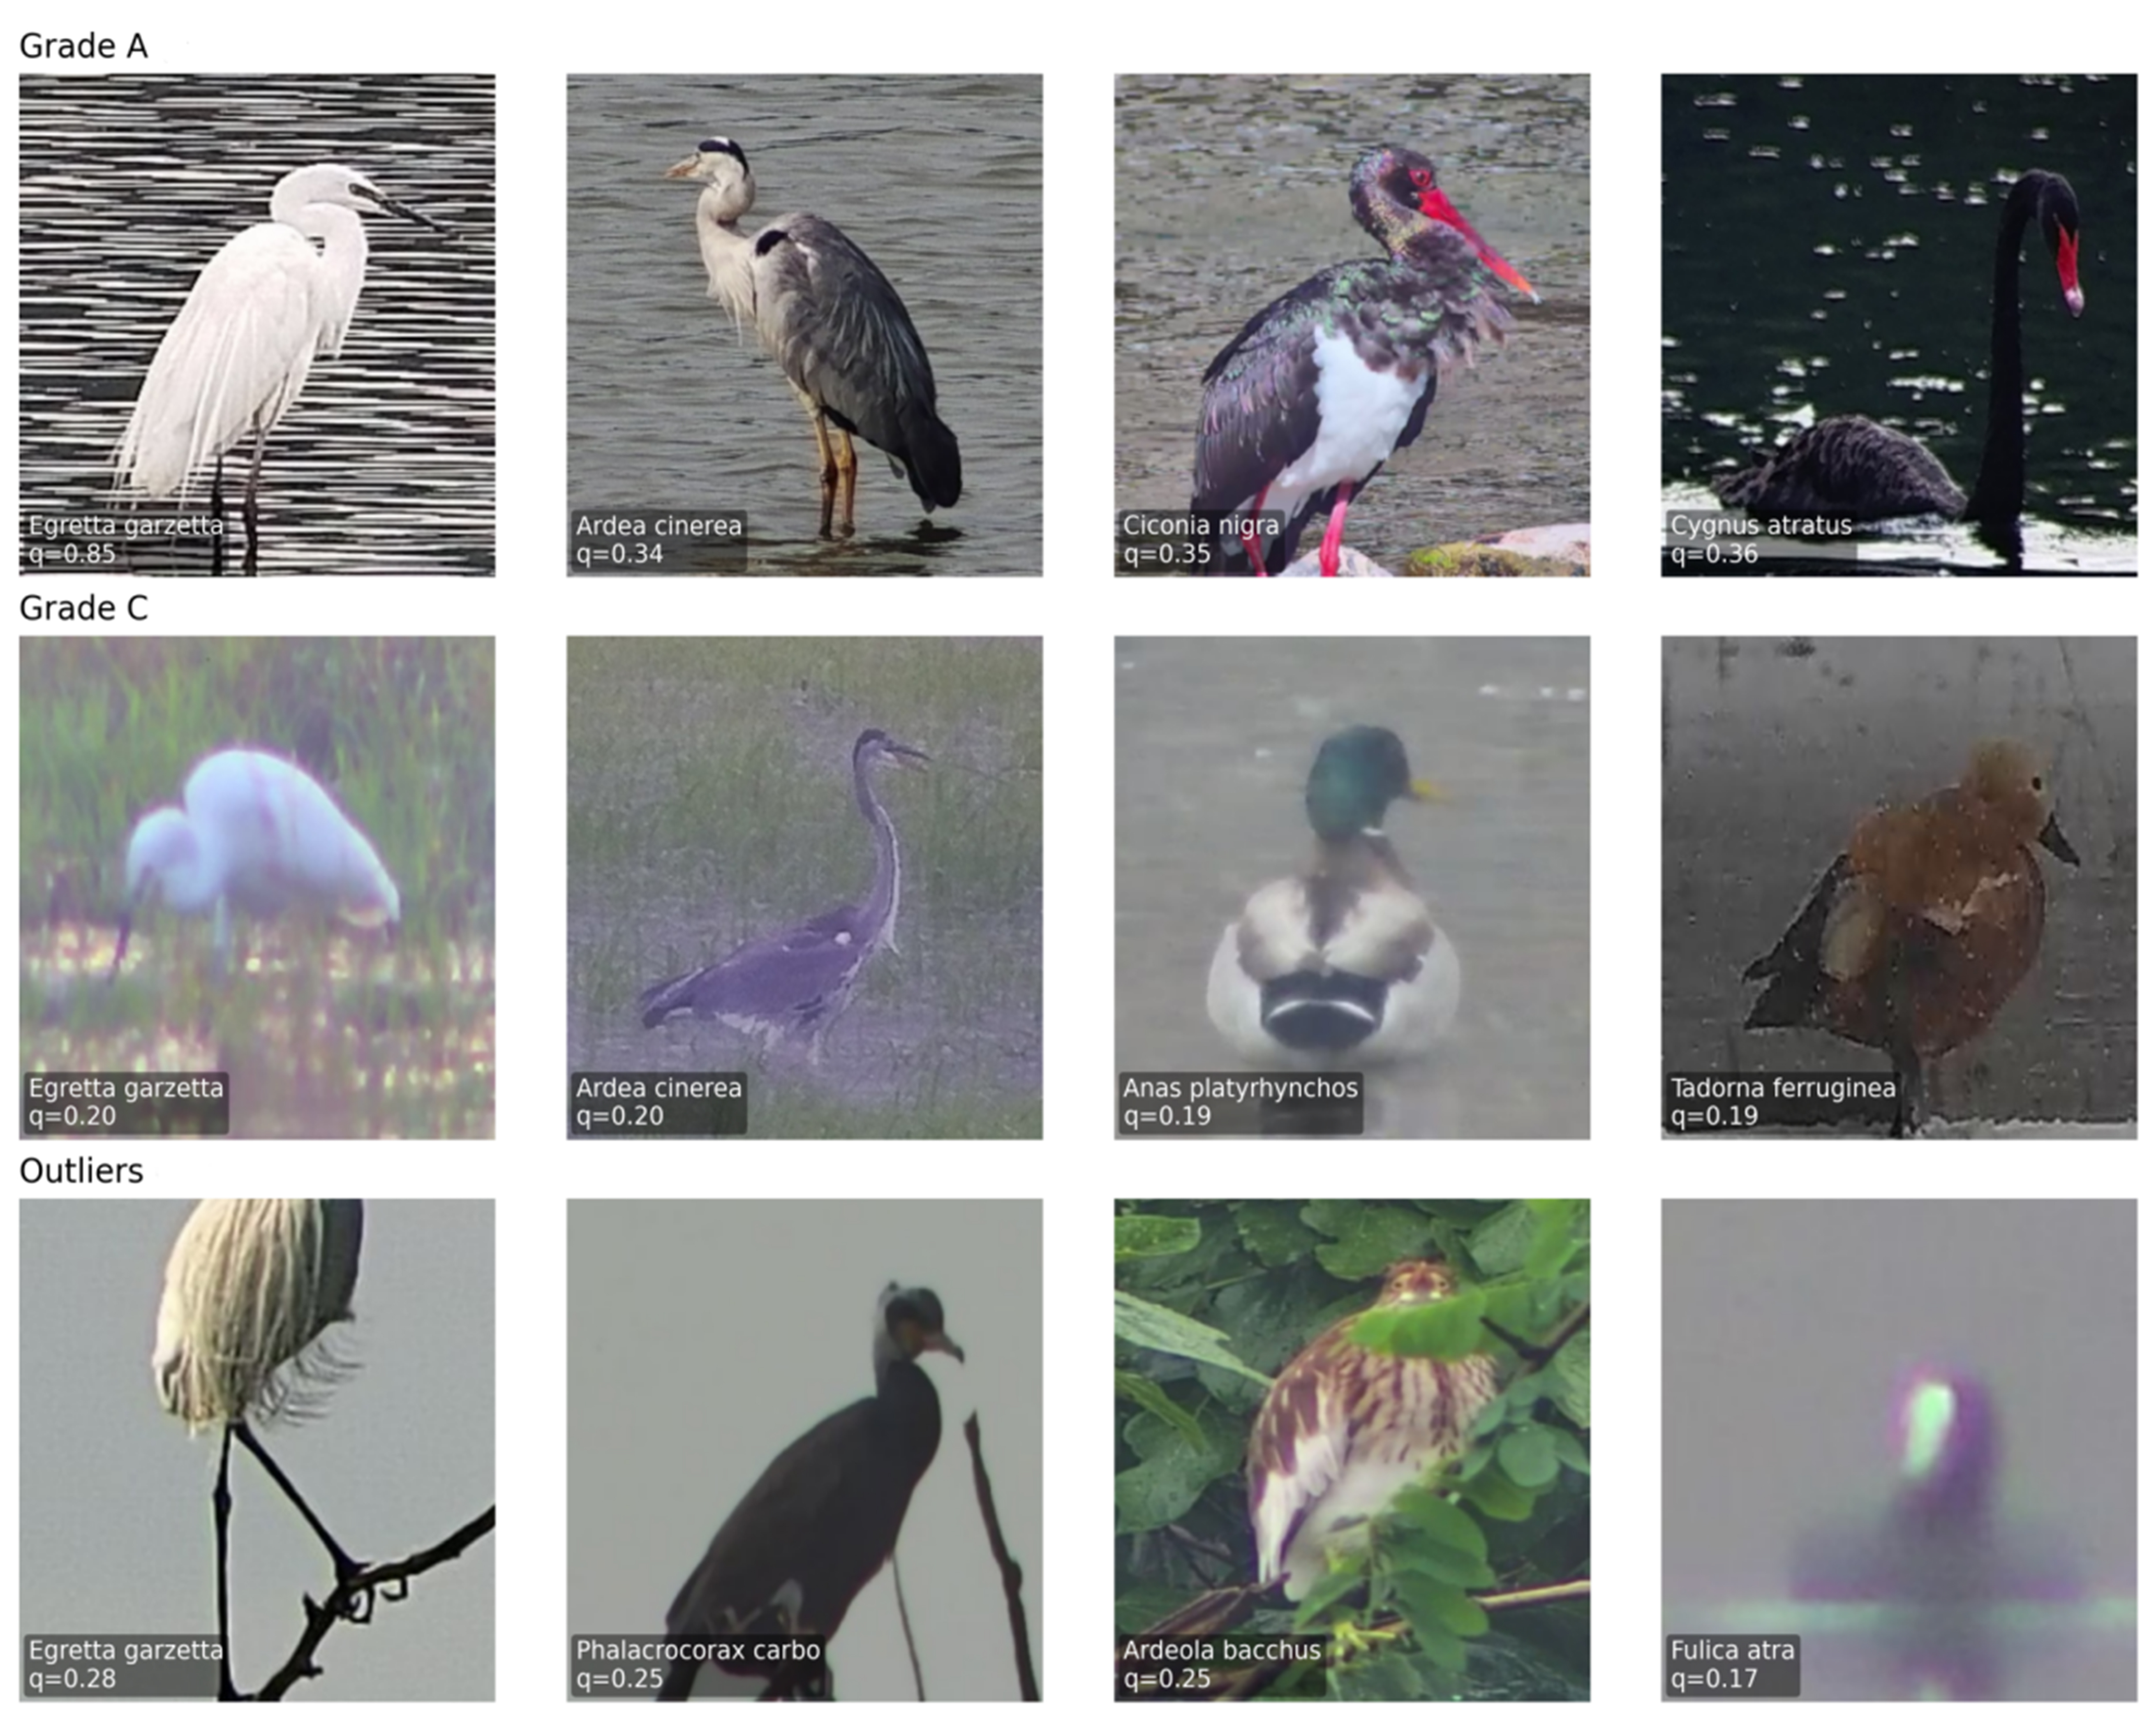
Figure 6. Visualisation of representative samples across quality Grades A/C and outliers. Photographs are from the authors’ research project and are reproduced with permission.
Figure 6. Visualisation of representative samples across quality Grades A/C and outliers. Photographs are from the authors’ research project and are reproduced with permission.


All published articles are preserved here permanently:
https://www.portico.org/publishers/oae/


