


fig8
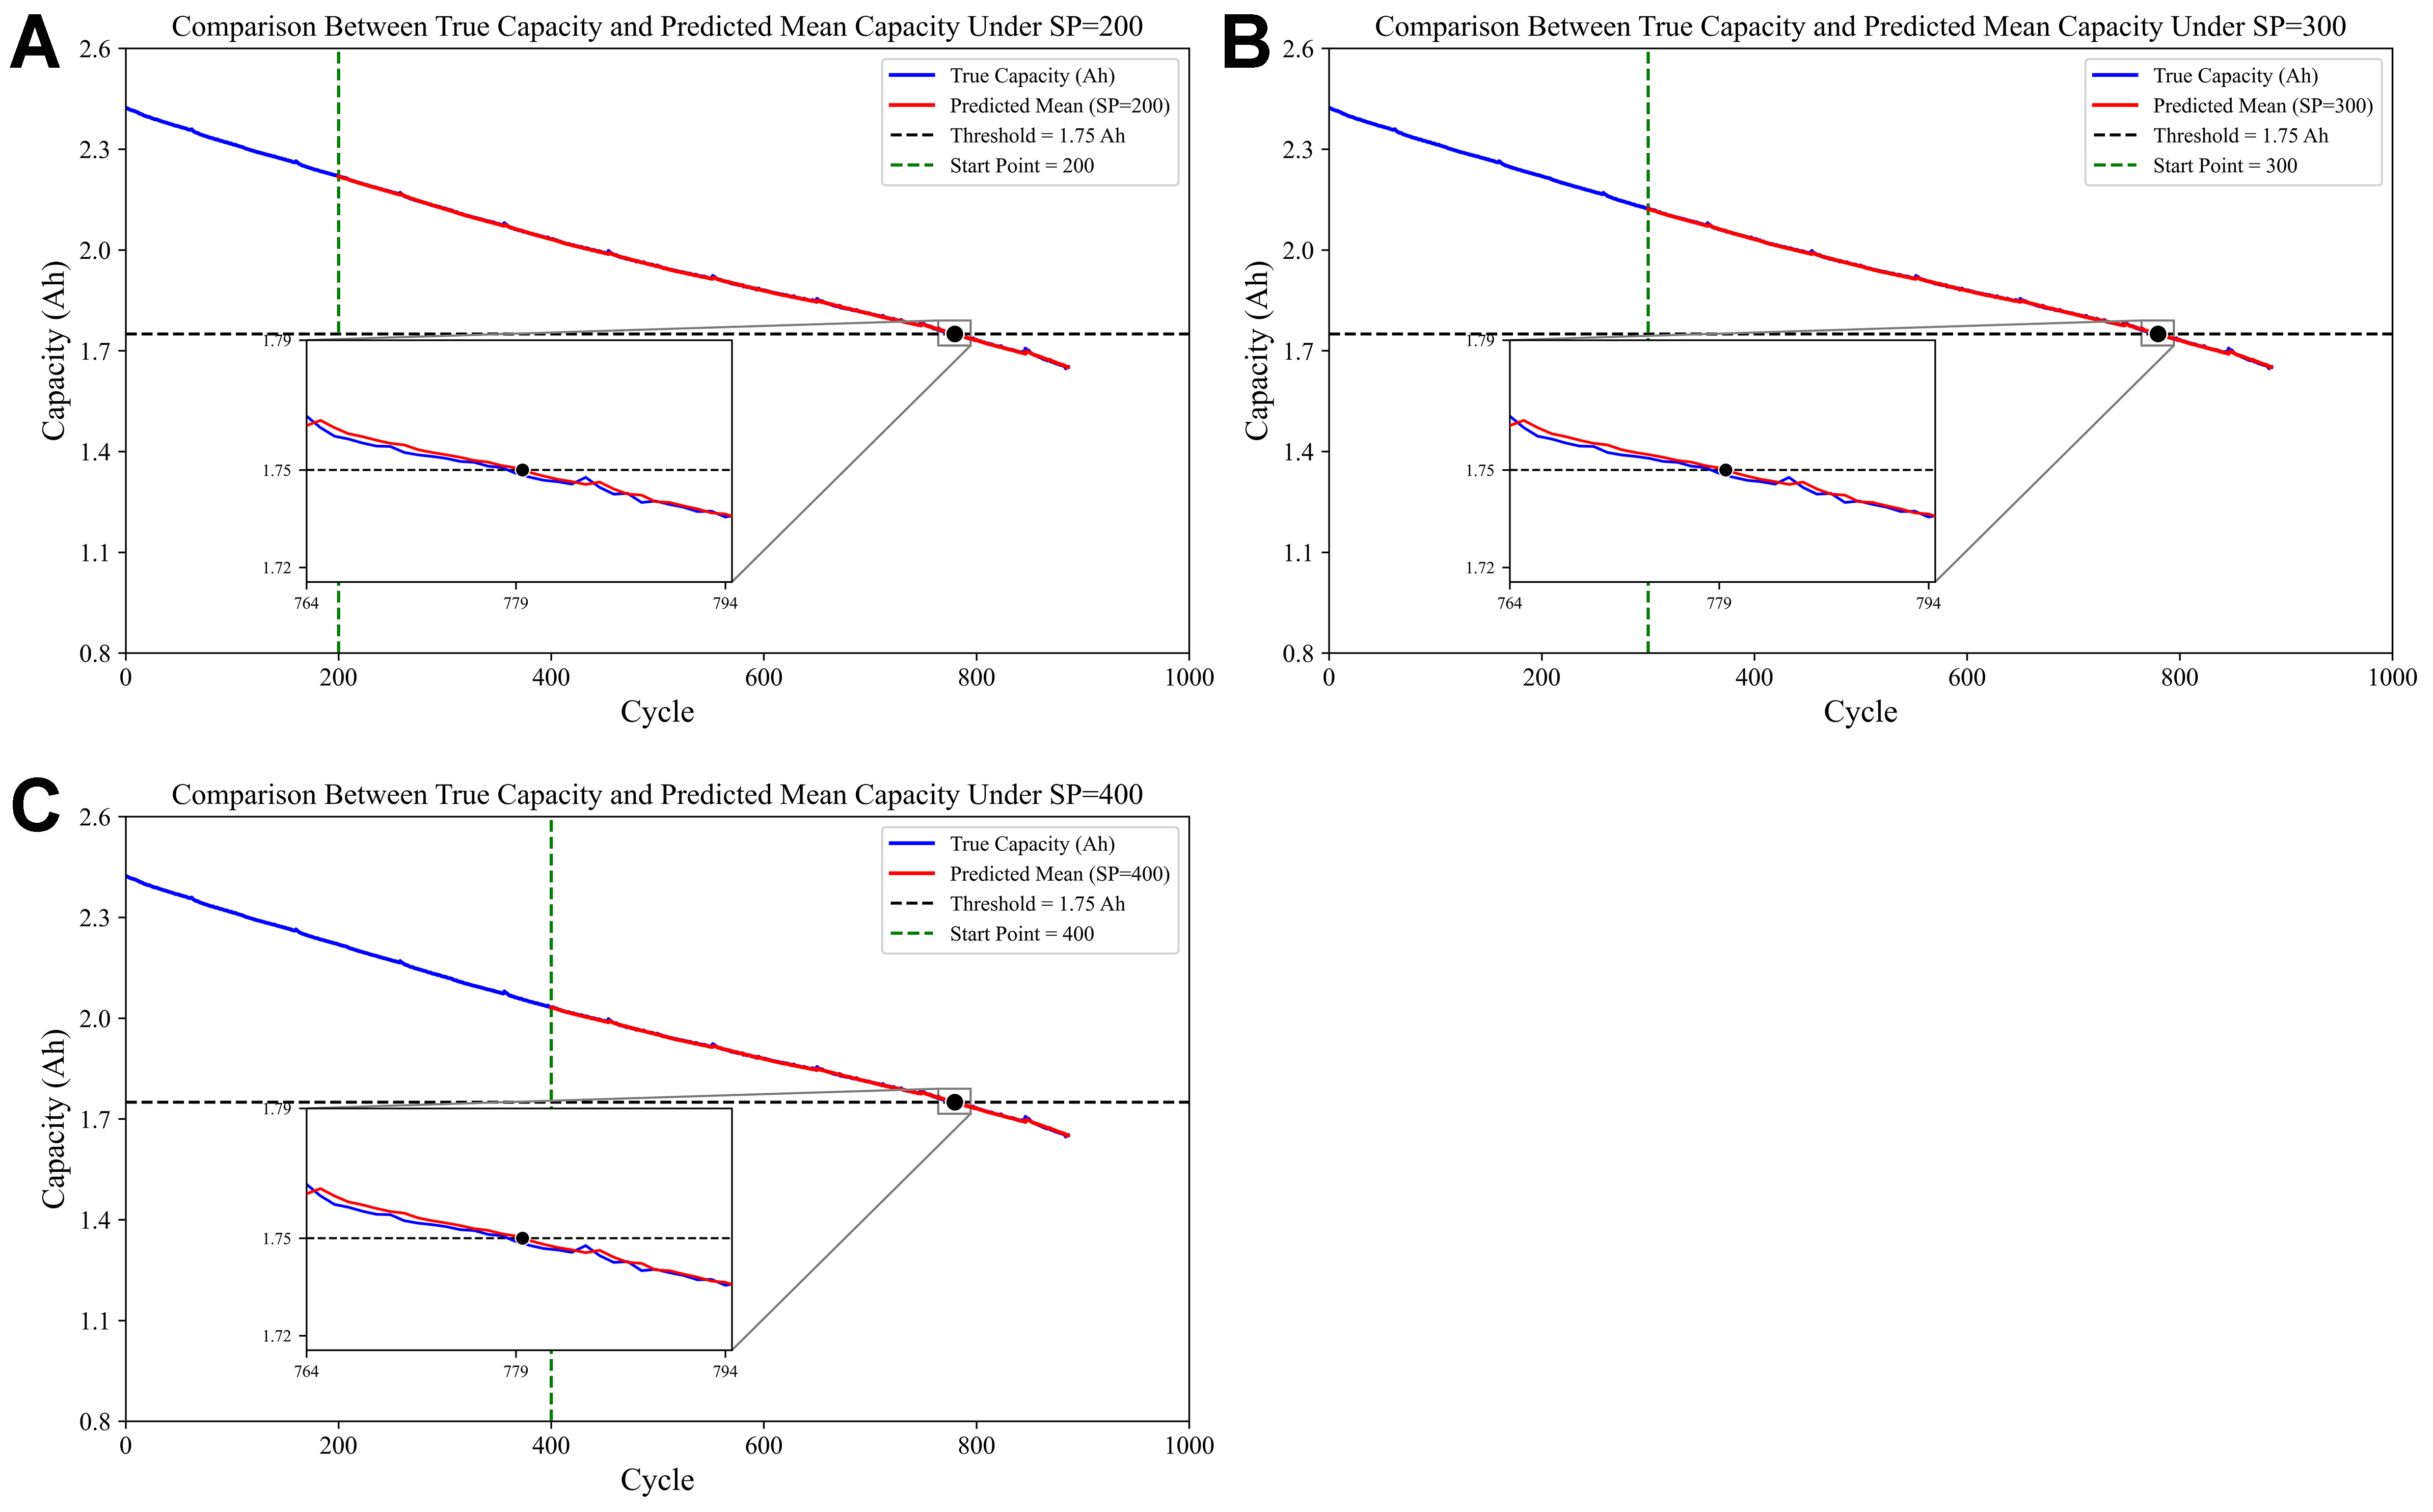
Figure 8. Comparison between predicted and measured battery capacity trajectories on the TJU dataset under different prediction starting points. Comparison curve between predicted value and true value when (A) SP = 200; (B) SP = 300; (C) SP = 400. TJU: Tongji University; SP: starting point.


